A closer look at chess scalings (into the past)
post by hippke · 2021-07-15T08:13:34.756Z · LW · GW · 14 commentsContents
  Introduction
  Reproducing chess scaling from 2020
    History of PC Programs (ELO by year)
    Human grandmasters
    Deep Blue
    Stockfish 8 experiment
      As a baseline, we need to establish its ELO at a defined speed.
      Execute the experiment
None
14 comments
Introduction
I had explored measuring AI or hardware overhang [LW · GW] in August 2020 using chess. Hardware overhang is when sufficient compute is available, but the algorithms are suboptimal. I examined the strongest chess engine of 2020, Stockfish 8, performing at 3,400 ELO under tournament conditions. When reducing compute to 1997 levels (equivalent to a Pentium-II 300 MHz), its ELO score was still ~3,000. That is an important year: In 1997, the IBM supercomputer "Deep Blue" defeated the world chess champion Gary Kasparov. With Stockfish, no supercomputer would have been required. I estimated that SF8 drops to Kasparov level on a 486-DX4 100 MHz, available already in 1994. To sum it up, the hardware overhang in chess is about 10 years, or 2-3 orders of magnitude in compute.
About a year later, in July 2021, Paul Christiano asked similar questions [LW · GW]: How much compute would the old engine need to match the current engines? What is the influence of RAM (size and speed), opening books, endgame tables, pondering? Also, my old post gave some insights, but it can be improved by sharing the sources and making it reproducible. That's the aim of the current post (the other questions will be adressed in a later post).
Reproducing chess scaling from 2020
History of PC Programs (ELO by year)
As a baseline of engine performance over the years, we plot the winner from the yearly rating list of the Swedish Chess Computer Association. Run on contemporary hardware,
- The list begins in 1984 when the program "Novag Super Constellation" reached 1631 ELO running on a 6502 CPU at 4 MHz.
- By 2005, Shredder 9 surpassed human levels on an AMD Athlon 1200 MHz.
- Today (2020), the leading engine is Stockfish 12 running on an AMD 1800X at 3.6 GHz.
Human grandmasters
To compare human grandmasters, we take the ELO over time for Kasparov and Carlsen. Carlsen's rating between 2003 and 2011 (age 13 to 21) grew from 2000 ELO to grandmaster strength, faster than any engine :-) [Thanks to User Bucky for the correction]
Deep Blue
The marker for "Deep Blue" in the year 1997 is a bit arbitrarily set to 2900 ELO. At the time, Kasparov had 2860 ELO, Deep Blue won, although close.
Stockfish 8 experiment
The main part is the Stockfish 8 experiment. How well does SF8 perform on slower PCs?
As a baseline, we need to establish its ELO at a defined speed.
- To obtain the speed baseline, we find that SF8 makes 721 kNodes/s on an AMD Athlon 64 3500+ at 2.20 GHz.
- We scale this linearly to 777 kNodes/s for the same CPU running at 2.4 GHz (+9%)
- SF8 achies 3302 ELO on an Athlon 64 X2 4600+ (2.4 GHz) in the CCRL Rating List, running 40 moves in 15 minutes (one has to dig into the side details to understand which CPU name tag is which CPU. 64bit 1 CPU is the Athlon; this can also be verified with the historical version of that list.). This is an important baseline, because it cross-calibrated to dozens of other engines.
- With that established, we can calculate the ELO as a function of kNodes/s. An average game has 40 moves. The 40 moves in 15 minutes leave 22.5 seconds per move (on average). That's 17.5 MNodes per move to achieve 3302 ELO.
- We benchmark our own machine, on which the experiments are run. This can be done with the Stockfish parameter "bench". For simplicity, suppose our machine performs at 10 x 777 kNodes/s = 7.8 MNodes/s. That's the ballpark of recent (2020) 4-core CPUs.
- Now we want to perform a game at 17.5 MNodes per move, on a machine running at 7.8 MNodes/s. Clearly, each move can only take 2.24 seconds. The whole 40-game match duration is: 90 seconds.
Execute the experiment
To build a ladder of SF towards slower machines, we let this version of SF8 play a set of games of 90s timecontrol versus half that (45s). The most well-established tool to compare chess engines is cutechess-cli. It is a command-line interface to play two engines (or two versions of the same engine) against each other. In the end, it nicely summarizes the results and includes a differential ELO estimate. A command may be:
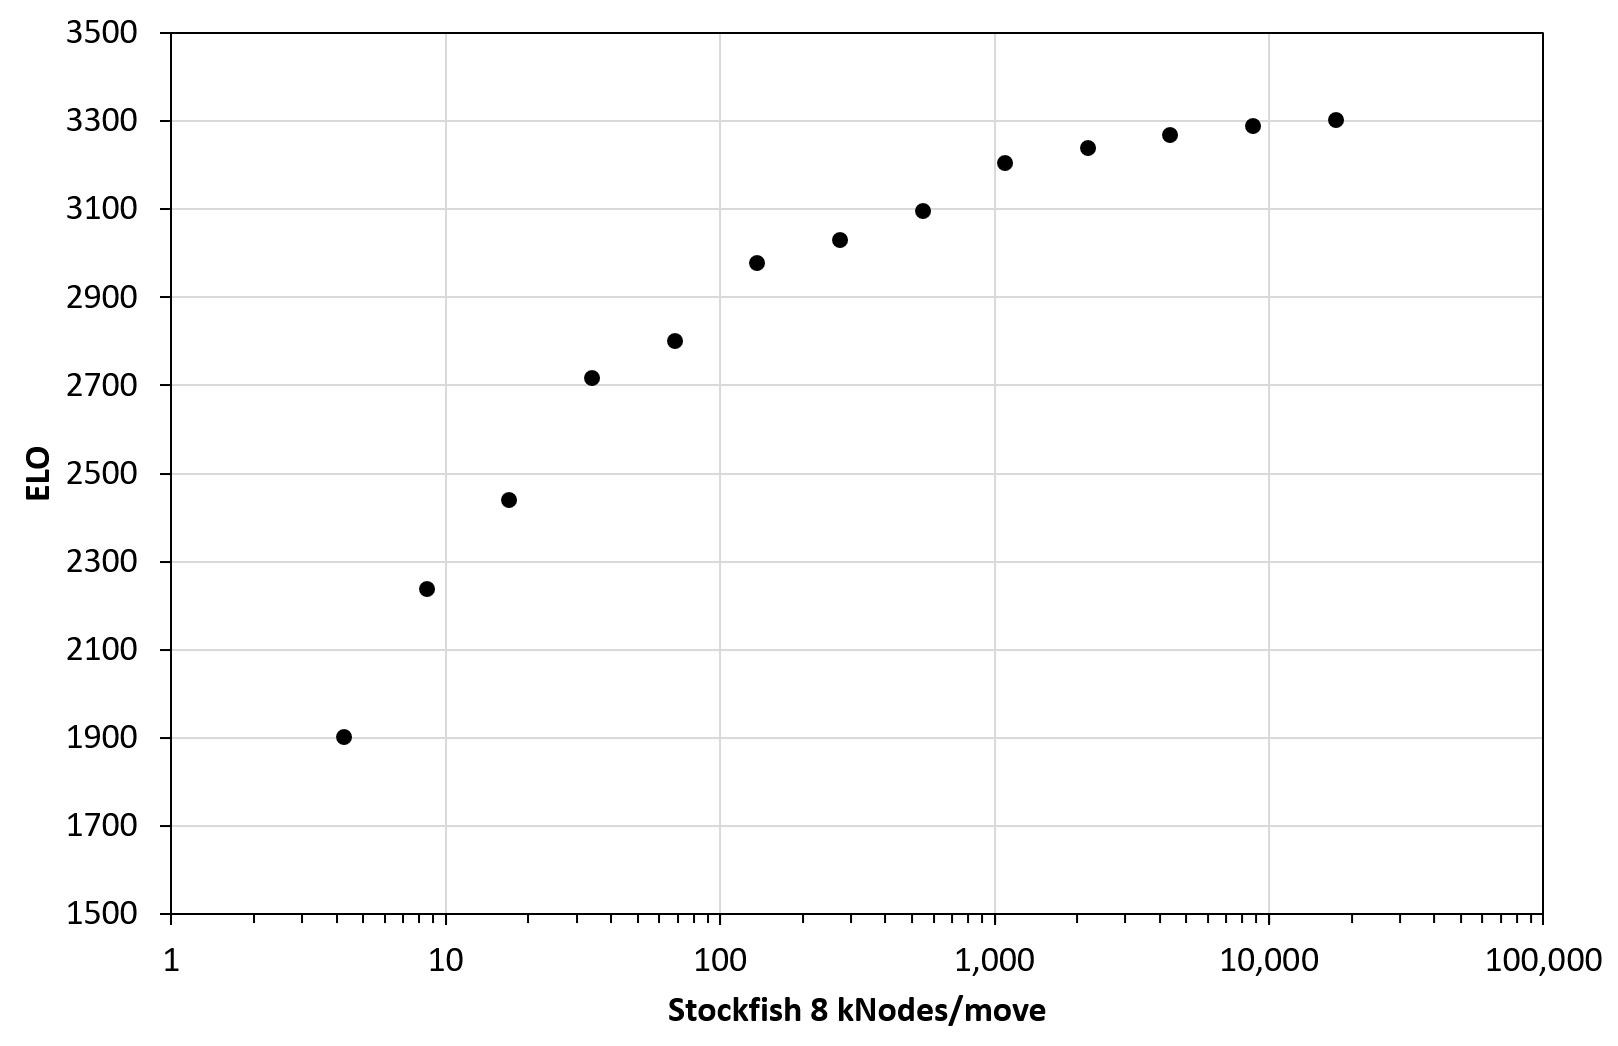
cutechess-cli -fcp cmd=stockfish proto=uci tc=40/90 -scp cmd=stockfish proto=uci tc=40/45 -games 100How bad does the version perform with less compute? In this experiment, after running 100 games, we get 14 ELO difference. That's much less than the usual statement of 70 ELO. Why is that? We can see the same effect in similar experiments down by others (1, 2): The ELO gain diminishes (flattens) at high compute. On the other hand, when we reduce compute to very low levels, the curve steepens dramatically. The full ELO loss result list from my experiment is for each halfing of compute:
| ELO | ELO Delta | kNodes/move |
| 3302 | 17476.4 | |
| 3288 | 14 | 8738.2 |
| 3268 | 20 | 4369.1 |
| 3240 | 28 | 2184.5 |
| 3205 | 35 | 1092.3 |
| 3097 | 108 | 546.1 |
| 3030 | 67 | 273.1 |
| 2977 | 53 | 136.5 |
| 2802 | 175 | 68.3 |
| 2716 | 86 | 34.1 |
| 2439 | 277 | 17.1 |
| 2238 | 201 | 8.5 |
| 1903 | 335 | 4.3 |
There is some jitter, despite increasing the number of games to 1,000 in the second half. Despite the jitter, we can clearly see the nonlinear ELO curve with compute:
The last thing we need to do is match the kNodes/move results to the old years. We may ask: In which year was the hardware available sufficient to play these kNodes/move in a usual tournament? This leaves some room for discussion. For 1997, should we choose a dual Pentium Pro 200, or a single Pentium 200 MMX? I believe it is reasonable to compare good CPUs of the time, without going overboard. After all, we're comparing chess on home computers. If we restrict it to <1000 USD CPUs for each year, we can find some SF8 benchmarking results across the web:
- AMD 5950X (2021): 71,485 kNodes/s
- Pentium III 500 MHz (1999): 127 kNodes/s
- Pentium 75 MHz (1995): 6.2 kNodes/s
- 386DX-33 MHz (1989): 1 kNode/s
There are many more such measurements found online, but for our purpose, this is sufficient. Caveats:
- Going back very far in time becomes difficult, because SF8 needed to be recompiled to reduced instruction sets to make it work; and RAM was limited in the experiment.
- It is more reasonable to match the speed to more recent years: About 200 kNodes/s in 2000, and 100 MNodes/s today. Everything before, and in between, has a factor of a few of error in its match of nodes to year.
- On the other hand, seeing benchmarks of real PCs is useful, because it encompasses uncertainties such as RAM speed.
- In reality, when considering hardware overhang for future AI, we must also ask: How well could SF8 be adapted to older hardware? Just running it unchanged will leave some performance (factor of a few?) on the table. That's a question for software engineers and compiler optimizers.
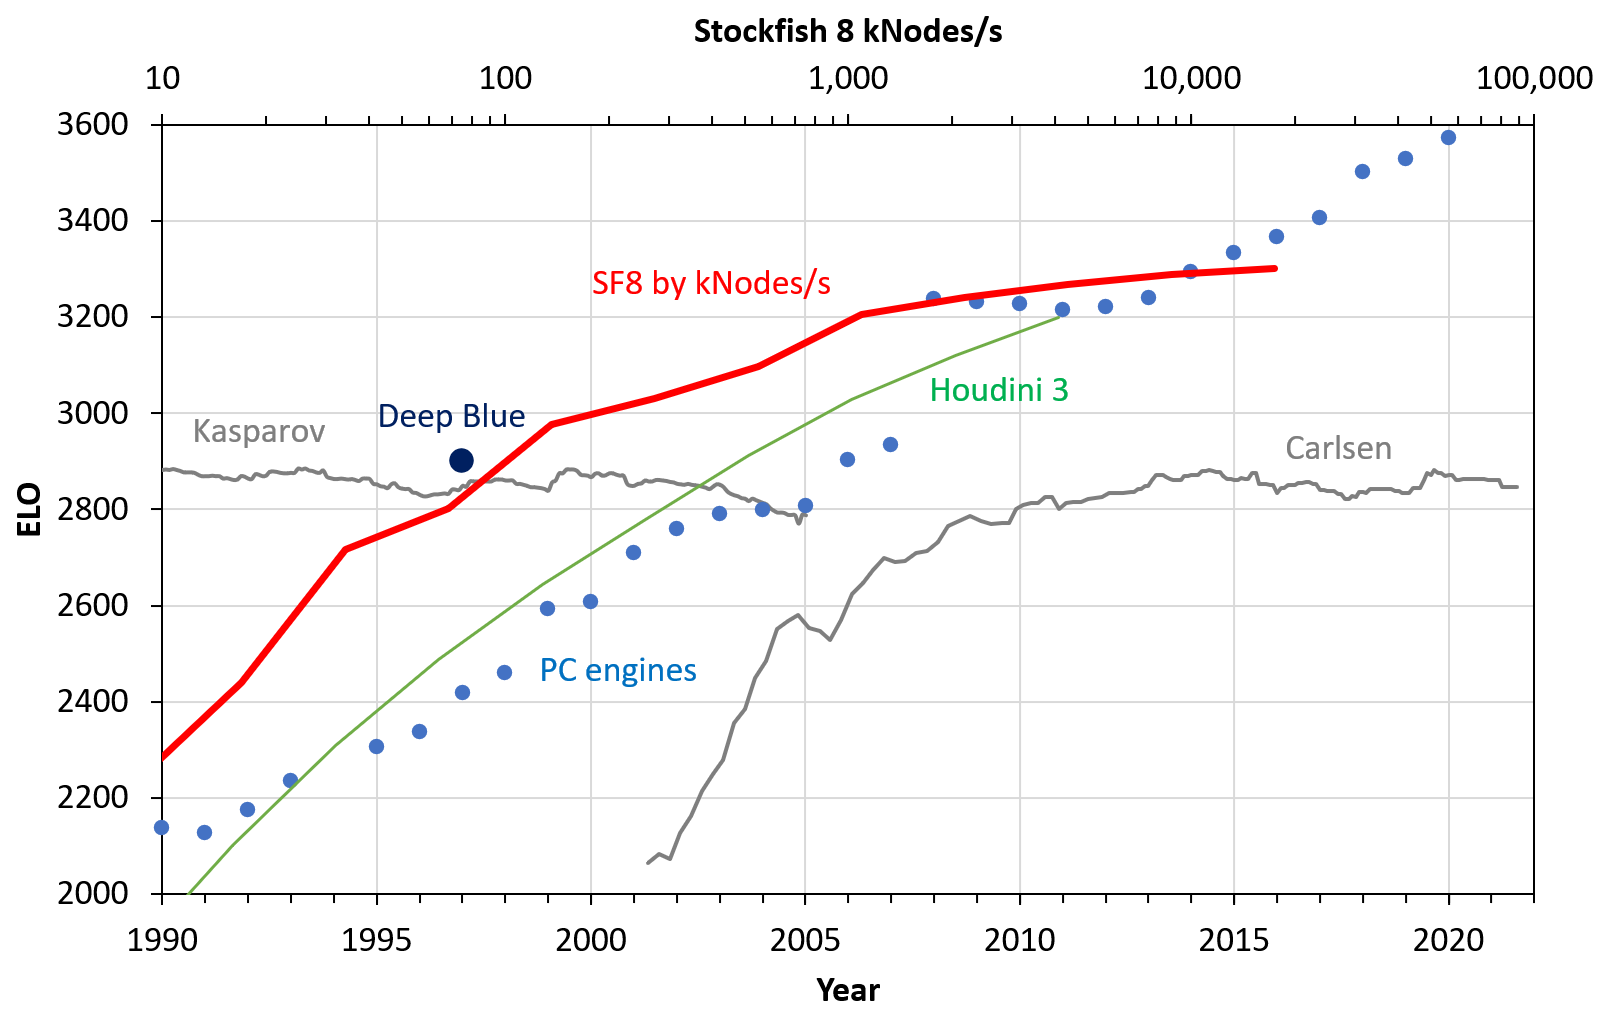
We can now bring the approximate match of Nodes/s with the years together with the other data, and present the result:

This looks quantitatively different to my first version [LW · GW], but is qualitatively similar.
- Again, a hardware overhang of ~10 years at maximum is visible: SF8 achieved Kasparov level in 1997
- This was only possible for contemporary PC engines of the year ~2006.
- In my old version, this was more like a 15 years gap. Back then, I had matched the speed to MIPS values for CPUs I found online.
- It is probably better to measure SF kNodes/s directly instead using a CPU speed proxy (MIPS, FLOPs, SPEC). Thus, I believe that the new figure is closer to reality.
In the next post, I will consider the other questions asked by Paul Christiano: How much compute would an old engine need to match current engines? What is the influence of opening books, endgame tables, pondering?
Edit (15 July): Magnus Carlsen time series fixed
14 comments
Comments sorted by top scores.
comment by paulfchristiano · 2021-07-15T16:49:54.960Z · LW(p) · GW(p)
I'm confused about the top end of the graph. Shouldn't SF8 with the reference compute basically match the final datapoints? But it looks like you'd have to scale it up extremely far to get to such a high elo.
Replies from: Charlie Steiner↑ comment by Charlie Steiner · 2021-07-15T17:01:12.624Z · LW(p) · GW(p)
We're on SF14 now. Stockfish didn't even have neural net evaluation until SF12 I think.
I just checked, and SF8 is from 2016. So still slightly off, but makes more sense.
Replies from: hippke↑ comment by hippke · 2021-07-15T19:58:39.017Z · LW(p) · GW(p)
Yes, that's correct. It is slightly off because I manually set the year 2022 to match 100,000 kNodes/s. That could be adjusted by one year. To get an engine which begins its journey right in the year 2021, we could perform a similar experiment with SF14. The curve would be virtually identical, just shifted to the right and up.
comment by gwern · 2021-07-29T21:37:02.761Z · LW(p) · GW(p)
I was reading about endgame databases and happened to note Thompson discussing a bit scaling of brute force search, and it 'asymptotic' or flattening. Ken Thompson, oral history, February 2005
...
Q: So at that stage how many plies was it [Belle] going and what kind of rating did it have?
Ken Thompson: It was going 8 full plies easily, the other one was probably going 6 and was easily master, probably 2300. I never worked for rating. You can squeeze rating points out by studying your opponents and booking up and taking away---put a punch of trap kind of stuff in. But I wanted to just play nice solid chess, so it was probably 2300.
Q: And I think at some point I recall you talking about the ratings compared to compute power and you had I think extrapolated for and about what kinds of compute power it would take to get certain improvements and ratings
Ken Thompson: Yeah...
Q: I can’t remember when that was, it must have been early ‘80s or something...
Ken Thompson: Yeah it was early ‘80s---It was asymptotic but it was in the high rise part of the asymptote so you can’t really tell whether---where it rolled over. But it would, certainly in that era you were gaining---for every doubling of horsepower you’d gain a hundred points. I came with some really fake-y back of the envelope calculations that said at around 12 or 13 ply you’d be world class. Maybe not---you’d compete for the world title, you may not win it but you’d be comparable.
Q: Presumably the ratings in some sense get a little less accurate at the very top I would think...
Ken Thompson: Yes, yes.
The WP article on Belle notes some of this in more detail and gives two refers, a 1983 and 1997 book. Quoting a bit (both are on Libgen and easy to acccess):
1983 says
Newborn [155] has suggested that if you double the speed of a brute force program, you will gain 100 rating points. If you assume a 5.5 branching factor, then a ply will yield 250 points. In the linear range of P4-P6 (the range observed by Newborn in existing programs) this relation holds. In the extended range of this experiment, ratings do not grow as fast as predicted. Any major conclusions about the experiment we leave up to the reader. Here are some of our observations that may be of help.
From [the book](https://cloudflare-ipfs.com/ipfs/bafykbzacebnknut4q77j4foxnybstbry5w3g5poigcqase47g4cryanhweags?filename=Monty Newborn (auth.) - Kasparov versus Deep Blue_ computer chess comes of age-Springer-Verlag New York (1997).pdf#page=132)
Thompson conducted two experiments in the late 1970s to study this issue. In his first experiment, he had one version of BELLE play a series of twenty games against an identical second version, except that one version, call it BELLE(P), searched to a depth of, say, P levels while the other, BELLE(P + 1), searched to a depth of P + 1 levels. The results of this experiment are presented in Figure 6.24a for 3 <= P <= 8. It shows, for example, that BELLE(3) won four of the twenty points against BELLE(4), and that BELLE(4) won five and a half of twenty points against BELLE(5). His second experiment, carried out shortly thereafter, was more extensive: for 4 <= P, Q <= 9 and for P ≠ Q, BELLE(P) played a twenty-game series against BELLE(Q). The results are presented in Figure 6.24b. Rather than relating rating improvement to the number of positions searched, Thompson related rating improvement to the depth of search, pointing out that an improvement of one hundred points for each doubling of speed was approximately equivalent to an improvement of 250 points for each additional level of search.
The main difference between the curve of ratings shown in Figure 6.23 and Thompson's results is that the relation between ratings and search depth appears to be almost linear to about 2500 while Thompson found that rating improvement drops off from linear at ratings above 2000 points. Certainly, eventually the curve approaches the limit imposed by perfect play but the question is how fast. Thompson evidently did not study deeper search depths because of the large amount of time required to obtain results.
[The next part discusses a different way to try to extrapolate based on differences in tree search choice which reminds me a little of Paul Christiano's counting argument/coincidence in Andy Jone's RL scaling paper.]
The descriptions here of flattening are suspicious, given the economizing on compute. It doesn't look like Thompson ever clearly revisited the topic later on than the '80s, or considered functional forms beyond increasing 1 ply at a time and expecting n ELO points. I would not be surprised if Belle continued scaling the same as Jones, and here again practitioners mistake a log or powerlaw for 'flattening out' (and thus futility compared to Bitter-Lesson-vulnerable-but-more-engineerable approaches).
comment by paulfchristiano · 2021-07-15T17:24:25.111Z · LW(p) · GW(p)
I'm quite surprised by how far out on the Elo vs compute curve we already are by a million nodes/move. Is this the main "target platform" for stockfish, or are people mostly trying to optimize the performance for significantly smaller node counts?
(I'm wondering whether such strong diminishing returns are fundamental to the domain, or whether people are putting the most work into optimizing performance down at more like 100kNodes/sec.)
Replies from: paulfchristiano, hippke↑ comment by paulfchristiano · 2021-07-15T20:13:30.750Z · LW(p) · GW(p)
In another comment [LW(p) · GW(p)] you wrote "In between is the region with ~70 ELO; that's where engines usually operate on present hardware with minutes of think time" which made sense to me, I'm just trying to square that with this graph.
Replies from: hippke↑ comment by hippke · 2021-07-15T20:25:28.930Z · LW(p) · GW(p)
Mhm, good point. I must admit that the "70 ELO per doubling" etc. is forum wisdom that is perhaps not the last word. A similar scaling experiment was done with Houdini 3 (2013) which dropped below 70 ELO per doubling when exceeding 4 MNodes/move. In my experiment, the drop is already around 1 MNode/move. So there is certainly an engine dependence.
Replies from: hippke↑ comment by hippke · 2021-07-15T20:36:15.699Z · LW(p) · GW(p)
OK, I have added the Houdini data from this experiment to the plot:
The baseline ELO is not stated, but likely close to 3200:
| Experiment | kNodes/move | ELO drop | ELO calculated |
| 4k nodes vs 2k nodes | 2 | 303 | 1280 |
| 8k nodes vs 4k nodes | 4 | 280 | 1583 |
| 16k nodes vs 8k nodes | 8 | 237 | 1863 |
| 32k nodes vs 16k nodes | 16 | 208 | 2100 |
| 64k nodes vs 32k nodes | 32 | 179 | 2308 |
| 128k nodes vs 64k nodes | 64 | 156 | 2487 |
| 256k nodes vs 128k nodes | 128 | 136 | 2643 |
| 512k nodes vs 256k nodes | 256 | 134 | 2779 |
| 1024k nodes vs 512k nodes | 512 | 115 | 2913 |
| 2048k nodes vs 1024k nodes | 1024 | 93 | 3028 |
| 4096k nodes vs 2048k nodes | 2048 | 79 | 3121 |
| Baseline | 4096 | 3200 |
↑ comment by paulfchristiano · 2021-07-23T19:22:23.739Z · LW(p) · GW(p)
The results look quite different for Houdini 3 vs SF8---is this just a matter of Stockfish being much better optimized for small amounts of hardware?
↑ comment by hippke · 2021-07-15T20:13:19.762Z · LW(p) · GW(p)
From what I understand about the computer chess community:
- Engines are optimized to win in the competitions, for reputation. There are competitions for many time controls, but most well respected are the CCC with games of 3 to 15 minutes, and TCEC which goes up to 90 minutes. So there is an incentive to tune the engines well into the many-MNodes/move regime.
- On the other hand, most testing during engine development is done at blitz or even bullet level (30s for the whole game for Stockfish). You can't just play thousands of long games after each code commit to test its effect. Instead, many faster games are played. That's in the few MNodes/move regime. So there's some incentive to perform well in that regime.
- Below that, I think that performance is "just what is it", and nobody optimizes for it. However, I think it would be valuable to ask a Stockfish developer about their view.
comment by Bucky · 2021-07-15T17:54:24.604Z · LW(p) · GW(p)
Is there a story behind the PC results 2008-2011 where they deviate from the fairly straight line?
Nitpick: There’s an issue with Magnus Carlsen’s ratings - he became a GM at 13 in 2003, not 21 in 2011 or in 2009 as shown in the graph (famously he was the second youngest ever GM at the time).
Replies from: hippke↑ comment by hippke · 2021-07-15T19:55:16.072Z · LW(p) · GW(p)
Oh, thank you for the correction about Magnus Carlsen! Indeed, my script to convert the timestamps had an error. I fixed it in the figure.
Regarding the jump in 2008 with Rybka: I think that's an artifact of that particular list. Similar lists don't have it.
comment by Bartlomiej Lewandowski (bartlomiej-lewandowski) · 2021-07-18T11:19:29.903Z · LW(p) · GW(p)
Isn't ELO a reference metric that changes with time? I would assume that 2800 ELO in the 90s is a different level to today's 2800. Can we still make the same conclusions with that in mind?
Replies from: hippke↑ comment by hippke · 2021-07-19T06:10:50.750Z · LW(p) · GW(p)
From what I understand about "ELO inflation", it refers to the effect that the Top 100 FIDE players had 2600 ELO in 1970, but 2700 ELO today. It has been argued that simply the level increased, as more very good players entered the field. The ELO number as such should be fair in both eras (after playing infinitely many games...). I don't think that it is an issue for computer chess comparisons. Let me know if you have other data/information!