The first RCT for GLP-1 drugs and alcoholism isn't what we hoped
post by dynomight · 2025-02-20T22:30:07.536Z · LW · GW · 4 commentsThis is a link post for https://dynomight.net/glp-1/
Contents
  What they did
  Outcome 1: Drinking
  Outcome 2: Delayed drinking
  Outcome 3: Laboratory drinking
  Discussion
None
4 comments
GLP-1 drugs are a miracle for diabetes and obesity. There are rumors that they might also be a miracle for addiction to alcohol, drugs, nicotine, and gambling. That would be good. We like miracles. But we just got the first good trial and—despite what you might have heard—it’s not very encouraging.
Semaglutide—aka Wegovy / Ozempic—is a GLP-1 agonist. This means it binds to the same receptors the glucagon-like peptide-1 hormone normally binds to. Similar drugs include dulaglutide, exenatide, liraglutide, lixisenatide, and tirzepatide. These were originally investigated for diabetes, on the theory that GLP-1 increases insulin and thus decreases blood sugar. But GLP-1 seems to have lots of other effects, like preventing glucose from entering the bloodstream, slowing digestion, and making you feel full longer. It was found to cause sharp decreases in body mass, which is why supposedly 12% of Americans had tried one of these drugs by mid 2024.
(I’m skeptical that of that 12% number, but a different survey in late 2024 found that 10% of Americans were currently taking one of these drugs. I know Americans take more drugs than anyone on the planet, but still…)
Anyway, there are vast reports from people taking these drugs that they help with various addictions. Many people report stopping drinking or smoking without even trying. This is plausible enough. We don’t know which of the many effects of these drugs is really helping with obesity. Maybe it’s not the effects on blood sugar that matter, but these drugs have some kind of generalized “anti-addiction” effect on the brain? Or maybe screwing around with blood sugar changes willpower? Or maybe when people get thinner, that changes how the brain works? Who knows.
Beyond anecdotes, are some observational studies and animal experiments suggesting they might help with addiction (OKeefe et al. 2024). We are so desperate for data that some researchers have even resorted to computing statistics based on what people say on reddit.
So while it seems plausible these drugs might help with other addictions, there’s limited data and no clear story for why this should happen biologically. This makes the first RCT, which came out last week, very interesting.
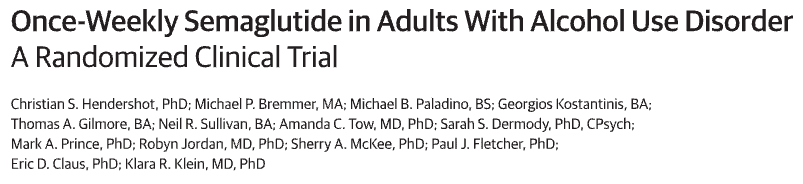
This paper contains this figure, about which everyone is going crazy:
I admit this looks good. This is indeed a figure in which the orange bar is higher than the blue bar. However:
- This figure does not mean what you think it means. Despite the label, this isn’t actually the amount of alcohol people consumed. What’s shown is the result of a regression, which was calculated on a non-random subset of subjects.
- There are other figures. Why isn’t anyone talking about the other figures?
What they did
This trial gathered 48 participants. They selected them according to the DSM-5 definition of “alcohol use disorder” which happens to be more than 14 drinks per week for men and 7 drinks per week for women, plus at least 2 heavy drinking episodes. Perhaps because of this lower threshold, 34 of the subjects were women.
The trial lasted 9 weeks. During it, half of the subjects were given weekly placebo injections. The other half were given weekly injections of increasing amounts of semaglutide: 0.25 mg for 4 weeks, then 0.5 mg for 4 weeks, and then 0.5 or 1 mg in the last week, depending on a doctor’s judgement.
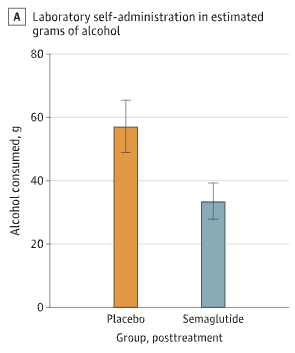
Outcome 1: Drinking
The first outcome was to simply ask people to record how much they drank in daily life. Here are the results:
If I understand correctly, at some point 6 out of the 24 subjects in the placebo group stopped providing these records, and 3 out of 24 in the semaglutide group. I believe the above shows the data for whatever subset of people were still cooperating on each week. It’s not clear to me what bias this might produce.
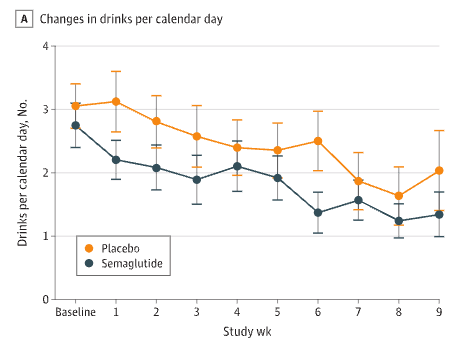
When I first saw that figure, I thought it looked good. The lines are going down, and the semaglutide line is lower. But then I checked the appendix. (Protip: Always check the appendix.) This contains the same data, but stratified by if people were obese or not:
Now it looks like semaglutide isn’t doing anything. It’s just that among the non-obese, the semaglutide group happened to start at a lower baseline.
How to reconcile this with the earlier figure? Well, if you look carefully, it doesn’t really show any benefit to semaglutide either. There’s a difference in the two curves, but it was there from the beginning. Over time, there’s no difference in the difference, which is what we’d expect to see if semaglutide was helping.
The paper provides other measurements like “changes in drinking days” and “changes in heavy drinking days” and “changes in drinks per drinking day”, but it’s the same story: Either no benefit or no difference.
So… This is a small sample. It only lasted nine weeks, and subjects spent many of them on pretty small doses. But this is far the miracle we hoped for. Some effect might be hiding in the noise, but what these results most look like is zero effect.
Outcome 2: Delayed drinking
There are also lab experiments. They did these at both the start and end of the study. In the first experiment, they basically set each subject’s favorite alcoholic drink in front of them and said them, “For each minute you wait before drinking this, we will pay you, up to a maximum of 50 minutes.”
How much were they paid, you ask? Oddly, that’s not specified in the paper. It’s also not specified in the supplemental information. It’s also not specified in the 289 page application they made to the FDA to be able to do this study. (Good times!) But there is a citation for a different paper in which people were paid $0.24/minute, decreasing by $0.01/minute every five minutes. If they used the same amounts here, then the maximum subjects could earn was $9.75.
Anyway, here are the results:
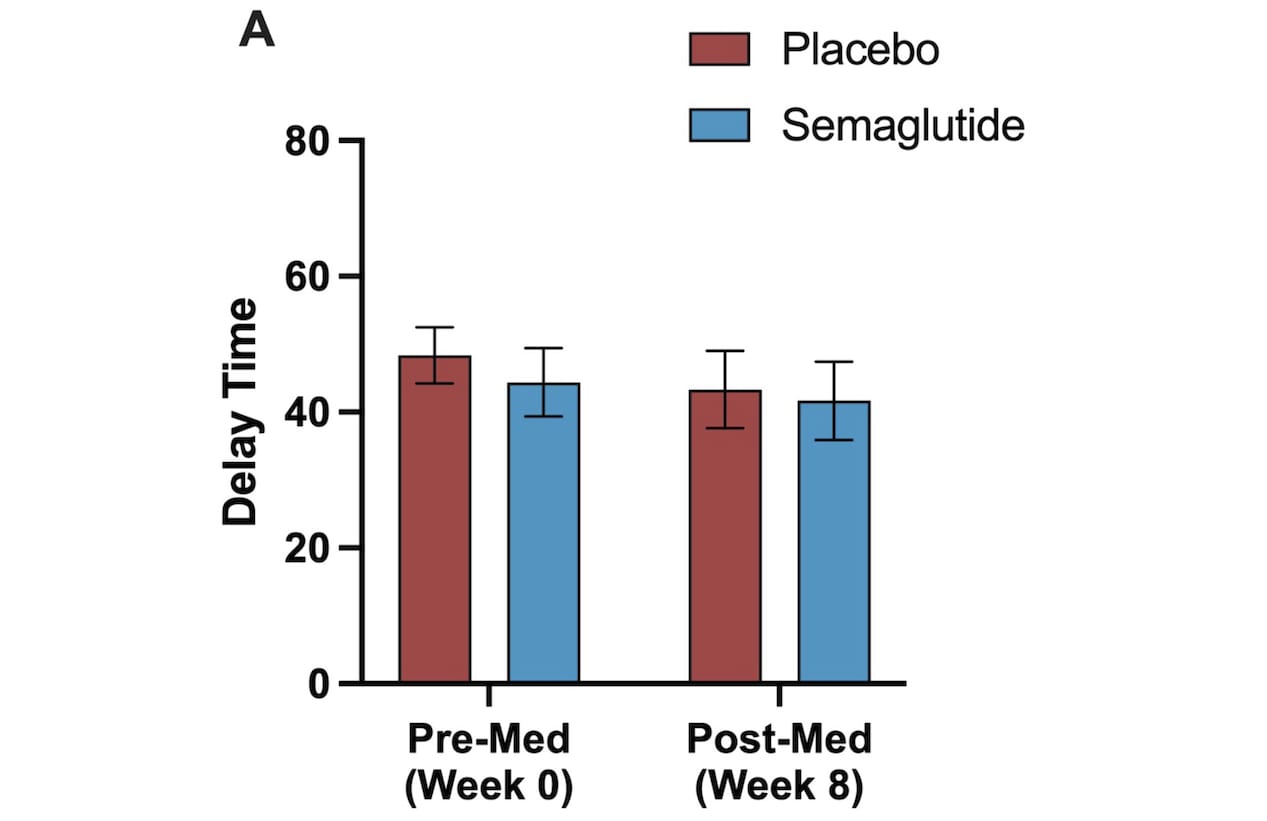
So… basically nothing? Because almost everyone waited the full 50 minutes? And they did this for only $9.75? Seems weird.
I don’t really see this as evidence against semaglutide. Rather, I think this didn’t end up proving much in either direction.
Outcome 3: Laboratory drinking
So what’s with that initial figure? Well, after the delayed drinking experiment was over, the subjects were given 2 hours to drink as much as they wanted, up to some kind of safe limit. This is what led to the figure everyone is so excited about:
When I first saw this, I too thought it looked good. I thought it looked so good that I started writing this post, eager to share the good news. But at some point I read the caption more carefully and my Spidey sense started tingling.
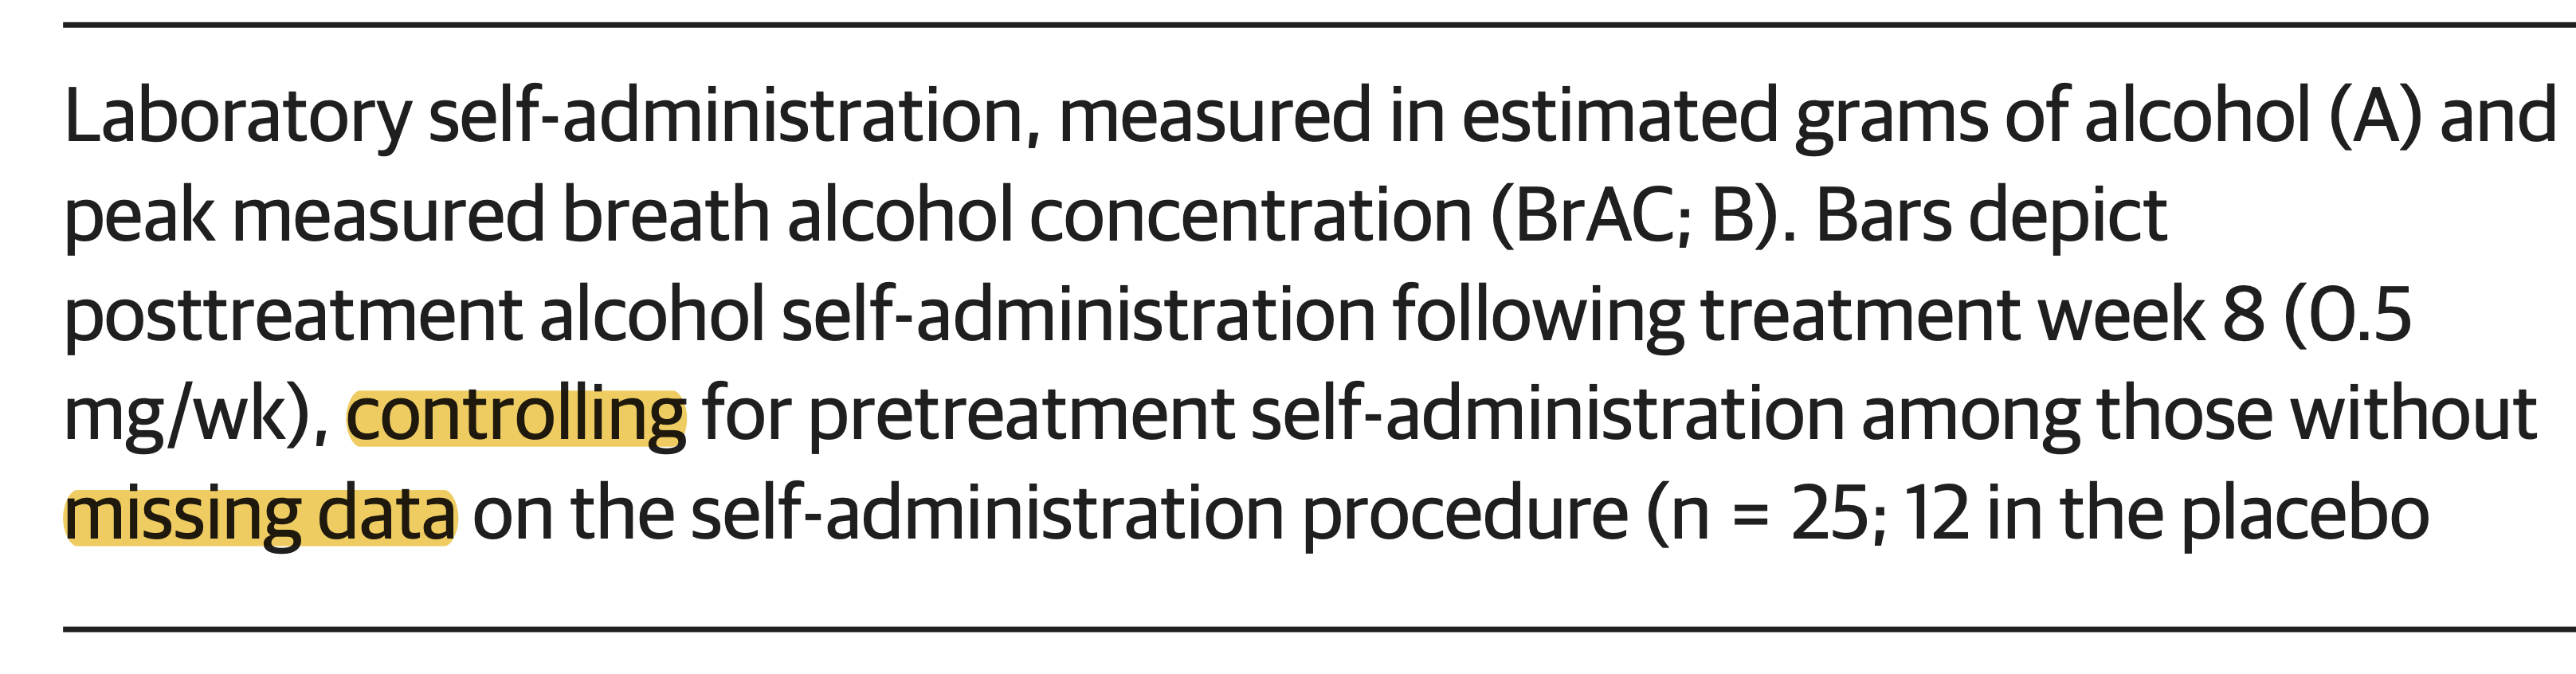
There’s two issues here. First of all, subjects were free to skip this part of the experiment, and a lot did. Only 12 of the 24 subjects in the placebo group and 13 of 24 in the semaglutide group actually did it. This means the results are non-randomized.
I mean, the people who declined to do this experiment would probably have drunk different amounts than those who agreed, right? So if semaglutide had any influence on people decision’s to participate (e.g. because it changed their relationship with alcohol, which is the hypothesis of this research) then the results would be biased. That bias could potentially go in either direction. But this means we’re sort of working with observational data.
The second issue is that what’s being show in this plot is not data. I know it looks like data, but what’s shown are numbers derived from regression coefficients. In the appendix, you can find this table:
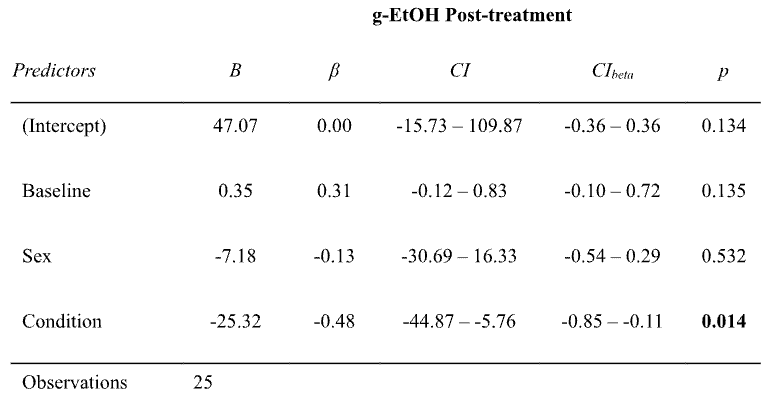
Basically, they fit a regression to predict how much people drank in this experiment at the end of the study (“g-EtOH”) based on (a) how much they drank during the same experiment at the start of the study (“Baseline”) (b) their sex, and (c) if they got semaglutide or not (“Condition”). Those coefficients are in the B column.
How exactly they got from these coefficients to the numbers in the figure isn’t entirely clear to me. But using a plot digitizer I found that the figure shows ~56.9 g for the placebo group and ~33.3 g for the semaglutide group, for a difference of ~23.6 g. I believe that difference comes from the regression coefficient for “Condition” (-25.32) plus some adjustments for the fact that sex and baseline consumption vary a bit between the two groups.
So… that’s not nothing! This is some evidence in favor of semaglutide being helpful. But it’s still basically just a regression coefficient computed on a non-randomized sample. Which is sad, since the point of RCTs is to avoid resorting to regression coefficients on non-randomized samples. Thus, I put much more faith in outcome #1.
Discussion
To summarize, the most reliable outcome of this paper was how much people reported drinking in daily life. No effect was observed there. The laboratory experiment suggests some effect, but the evidence is much weaker. When you combine the two, the results of this paper are quite bad, at least relative to my (high) hopes.
Obviously, just because the results are disappointing does not mean the research was bad. The measure of science is the importance of the questions, not what the answers happen to be. It’s unfortunate that a non-randomized sample participated in the final drinking experiment, but what were they supposed to do, force them? This experiment involved giving a synthetic hormone and an addictive substance with people with a use disorder. If you have any doubts about the amount of work necessary to bring that to reality, I strongly encourage you to look at the FDA application.
OK, fine, I admit that I do feel this paper “hides the bodies” slightly too effectively, in a way that could mislead people who aren’t experts or that don’t read the paper carefully. I think I’m on firm ground with that complaint, since in the discussions I’ve seen, 100% of people were in fact misled. But I’m sympathetic to the reality that most reviewers don’t share my enlightened views about judging science, and that a hypothetical paper written with my level of skepticism would never be published.
[redacted]
Anyway, despite these results, I’m still hopeful that GLP-1 drugs might help with addiction. This is a relatively small study, and it only lasted 9 weeks. I don’t think we can dismiss the huge number of anecdotes yet. And the laboratory experiment was at least a little promising. Given how destructive addictions can be, I vote for more research in this direction. Fortunately, given the billions of dollars to be made, that’s sure to happen.
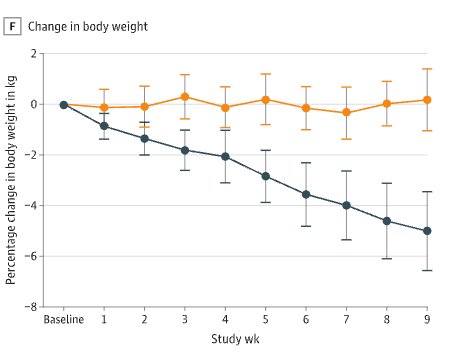
But given just how miraculous semaglutide is for obesity, and given the miraculous anecdotes, I don’t see how to spin this paper as anything but a letdown. It provides weak evidence for any effect and comes close to excluding the possibility of another miracle. If you’ve forgotten what miracles look like, here is the figure for body weight:
4 comments
Comments sorted by top scores.
comment by Daniel V · 2025-02-21T20:49:53.836Z · LW(p) · GW(p)
I appreciate this kind of detailed inspection and science writing, we need more of this in the world!
I'm writing this comment because of the expressed disdain for regressions. I do share the disappointment about how the randomization and results turned out. But for both, my refrain will be: "that's what the regression's for!"
This contains the same data, but stratified by if people were obese or not:
Now it looks like semaglutide isn’t doing anything.
The beauty of exploratory analyses like these is that you can find something interesting. The risk is that you can also read into noise. Unfortunately, all they did was plot these results, not report the regression, which could tell us whether there is any effect beyond the lower baseline. eTable3 confirms that the interaction between condition and week is non-significant for most outcomes, which the authors correctly characterized. That's what the regression's for!
This means the results are non-randomized.
Yes and no. People were still randomized to condition and it appears to be pretty even attrition. Yes, there is an element of self-selection, which can constrain the generalizability (i.e., external validity) of the results (I'd say most of the constraint is actually just due to studying people with AUD rather than the general population, but you can see why they'd do such a thing), but that does not necessarily mean it broke the randomization, which would reduce the ability to interpret differences as a result of the treatment (i.e., internal validity). To the extent that you want to control for differences that happen to occur or have been introduced between the conditions, you'll need to run a model to covary those out. That's what the regression's for!
the point of RCTs is to avoid resorting to regression coefficients on non-randomized samples
My biggest critique is this. If you take condition A and B and compute/plot mean outcomes, you'd presumably be happy that it's data. But computing/plotting predicted values from a regression of outcome on condition would directly recover those means. And from what we've seen above, adjustment is often desirable. Sometimes the raw means are not as useful as the adjusted/estimated means - to your worry about baseline differences, the regression allows us to adjust for that (i.e., provide statistical control where experimental control was not sufficient). And, instead of eyeballing plots, the regressions help tell you if something is reliable. The point of RCTs is not to avoid resorting to regression coefficients. You'll run regressions in any case! The point of RCTs is to reduce the load your statistical controls will be expected to lift by utilizing experimental controls. You'll still need to analyze the data and implement appropriate statistical controls. That's what the regression's for!
Replies from: dynomight↑ comment by dynomight · 2025-02-21T22:51:57.568Z · LW(p) · GW(p)
Thanks for the response! I must protest that I think I'm being misinterpreted a bit. Compare my quote:
the point of RCTs is to avoid resorting to regression coefficients on non-randomized sample
To the:
The point of RCTs is not to avoid resorting to regression coefficients.
The "non-randomized sample" part of that quote is important! If semaglutide had no impact on the decision to participate, then we can argue about about the theory of regressions. Yes, the fraction that participated happened to be close, but with small numbers that could easily happen by chance. The hypothesis of this research is that semaglutide would reduce the urge to drink! If the decision to participate was random, and I believed the conclusion of the experiment, then that conclusion would seem to imply that the decision to participate wasn't random after all. It just seems incredibly strange to assume that there's no impact of semaglutide on the probability of agreeing to the experiment, and very unlikely the other variables in the regression fix this, which is why I'm dubious that the regression coefficients reflect any causal relationship.
That said, I think the participation bias could go in either direction. I said (and maintain) that the lab experiment does provide some evidence in favor of semaglutide's effectiveness. I just think that given the non-random selection, small sample, and general weirdness of having people drink in a room in a hospital as a measurement, it's quite weak evidence. Given the dismal results from the drinking records (which have less of all of these issues) I think that makes the overall takeaway from this paper pretty negative.
↑ comment by Daniel V · 2025-02-22T14:51:02.847Z · LW(p) · GW(p)
I guess I misunderstood you. I figured that without "regression coefficients," the sentence would be a bit tautological: "the point of randomized controlled trial is to avoid [a] non-randomized sample," and there were other bits that made me think you had an issue with both selection bias (agree) and regressions (disagree).
I share your overall takeaway, but at this point I am just genuinely curious why the self-selection is presumed to be such a threat to internal validity here. I think we need more attention to selection effects on the margin, but I also think there is a general tendency for people to believe that once they've identified a selection issue the results are totally undermined. What is the alternative explanation for why semaglutide would disincline people who would have had small change scores from participating or incline people who have large change scores to participate (remember, this is within-subjects) in the alcohol self-administration experiment? Maybe those who had the most reduced cravings wanted to see more of what these researchers could do? But that process would also occur among placebo, so it'd work via the share of people with large change scores being greater in the semaglutide group, which is...efficacy. There's nuance there, but hard to square with lack of efficacy.
That said, still agree that the results are no slam dunk. Very specific population, very specific outcomes affected, and probably practically small effects too.
Replies from: dynomight↑ comment by dynomight · 2025-04-11T15:54:11.881Z · LW(p) · GW(p)
(Sorry for the slow reply—just saw this.)
> What is the alternative explanation for why semaglutide would disincline people who would have had small change scores from participating or incline people who have large change scores to participate (remember, this is within-subjects) in the alcohol self-administration experiment?
I'm a bit unsure what the non-alternative explanation is here. But imagine that semaglutide does not reduce the urge to drink but—I don't know—makes people more patient, or makes them more likely to agree to do things doctors ask them to do, or makes them more greedy. Then take the "marginal" person, who is just on the border of participating or not. If those marginal people drink less on average, then semaglutide would look good purely due to changing selection rather than actually reducing drinking.
Now, I don't claim that the above story is true. It's possible, but lots of other stories are also possible, including ones where the bias could go in the other way.
I also think there is a general tendency for people to believe that once they've identified a selection issue the results are totally undermined.
I expected this sentence to be followed by you praising me for explicitly disavowing such a view and stating that, since the bias could be in either direction, the lab experiment does provide some evidence in favor of semaglutide. :) (Just very weak evidence.)