Crowd-Forecasting Covid-19
post by nikos (followtheargument) · 2020-12-31T19:30:37.019Z · LW · GW · 0 commentsContents
  The crowd-forecasting app
  Evaluating Forecasts
  Results and Lessons Learned
  Future Work
None
No comments
Forecasting is hard and many forecasting models do not do a particularly good job. The question is: can humans do better? And if so, how can we best use that? This is what I have tried to investigate in the last few months.
Many platforms like Metaculus, Good Judgement, or the Delphi Crowdcast Project collect human forecasts. Other platforms like the Covid-19 Forecast Hub (their data is used by the CDC) collect forecasts from computer models submitted by different teams around the world. As targets and forecasting formats often differ, human and computer forecasts are often hard to compare. Often, policy-makers want a visual representation of the forecast, which requires a format that is more suitable for computers than humans. Sometimes, we therefore would like to have something like a drop-in replacement for a computer model that reflects human judgement - which is exactly what I have been working on.
This post will give an overview of the crowd-forecasting project I created for my PhD in epidemiology. It will
- present a crowd-forecasting web app developed
- explain how we evaluate forecasts and present the necessary tools
- discuss results and lessons learned
- give a quick overview of future development
I wrote a post previously on my own blog that presents some preliminary evaluation and also goes into more detail on how to make a good forecast. If you like, check that out as well.
The crowd-forecasting app
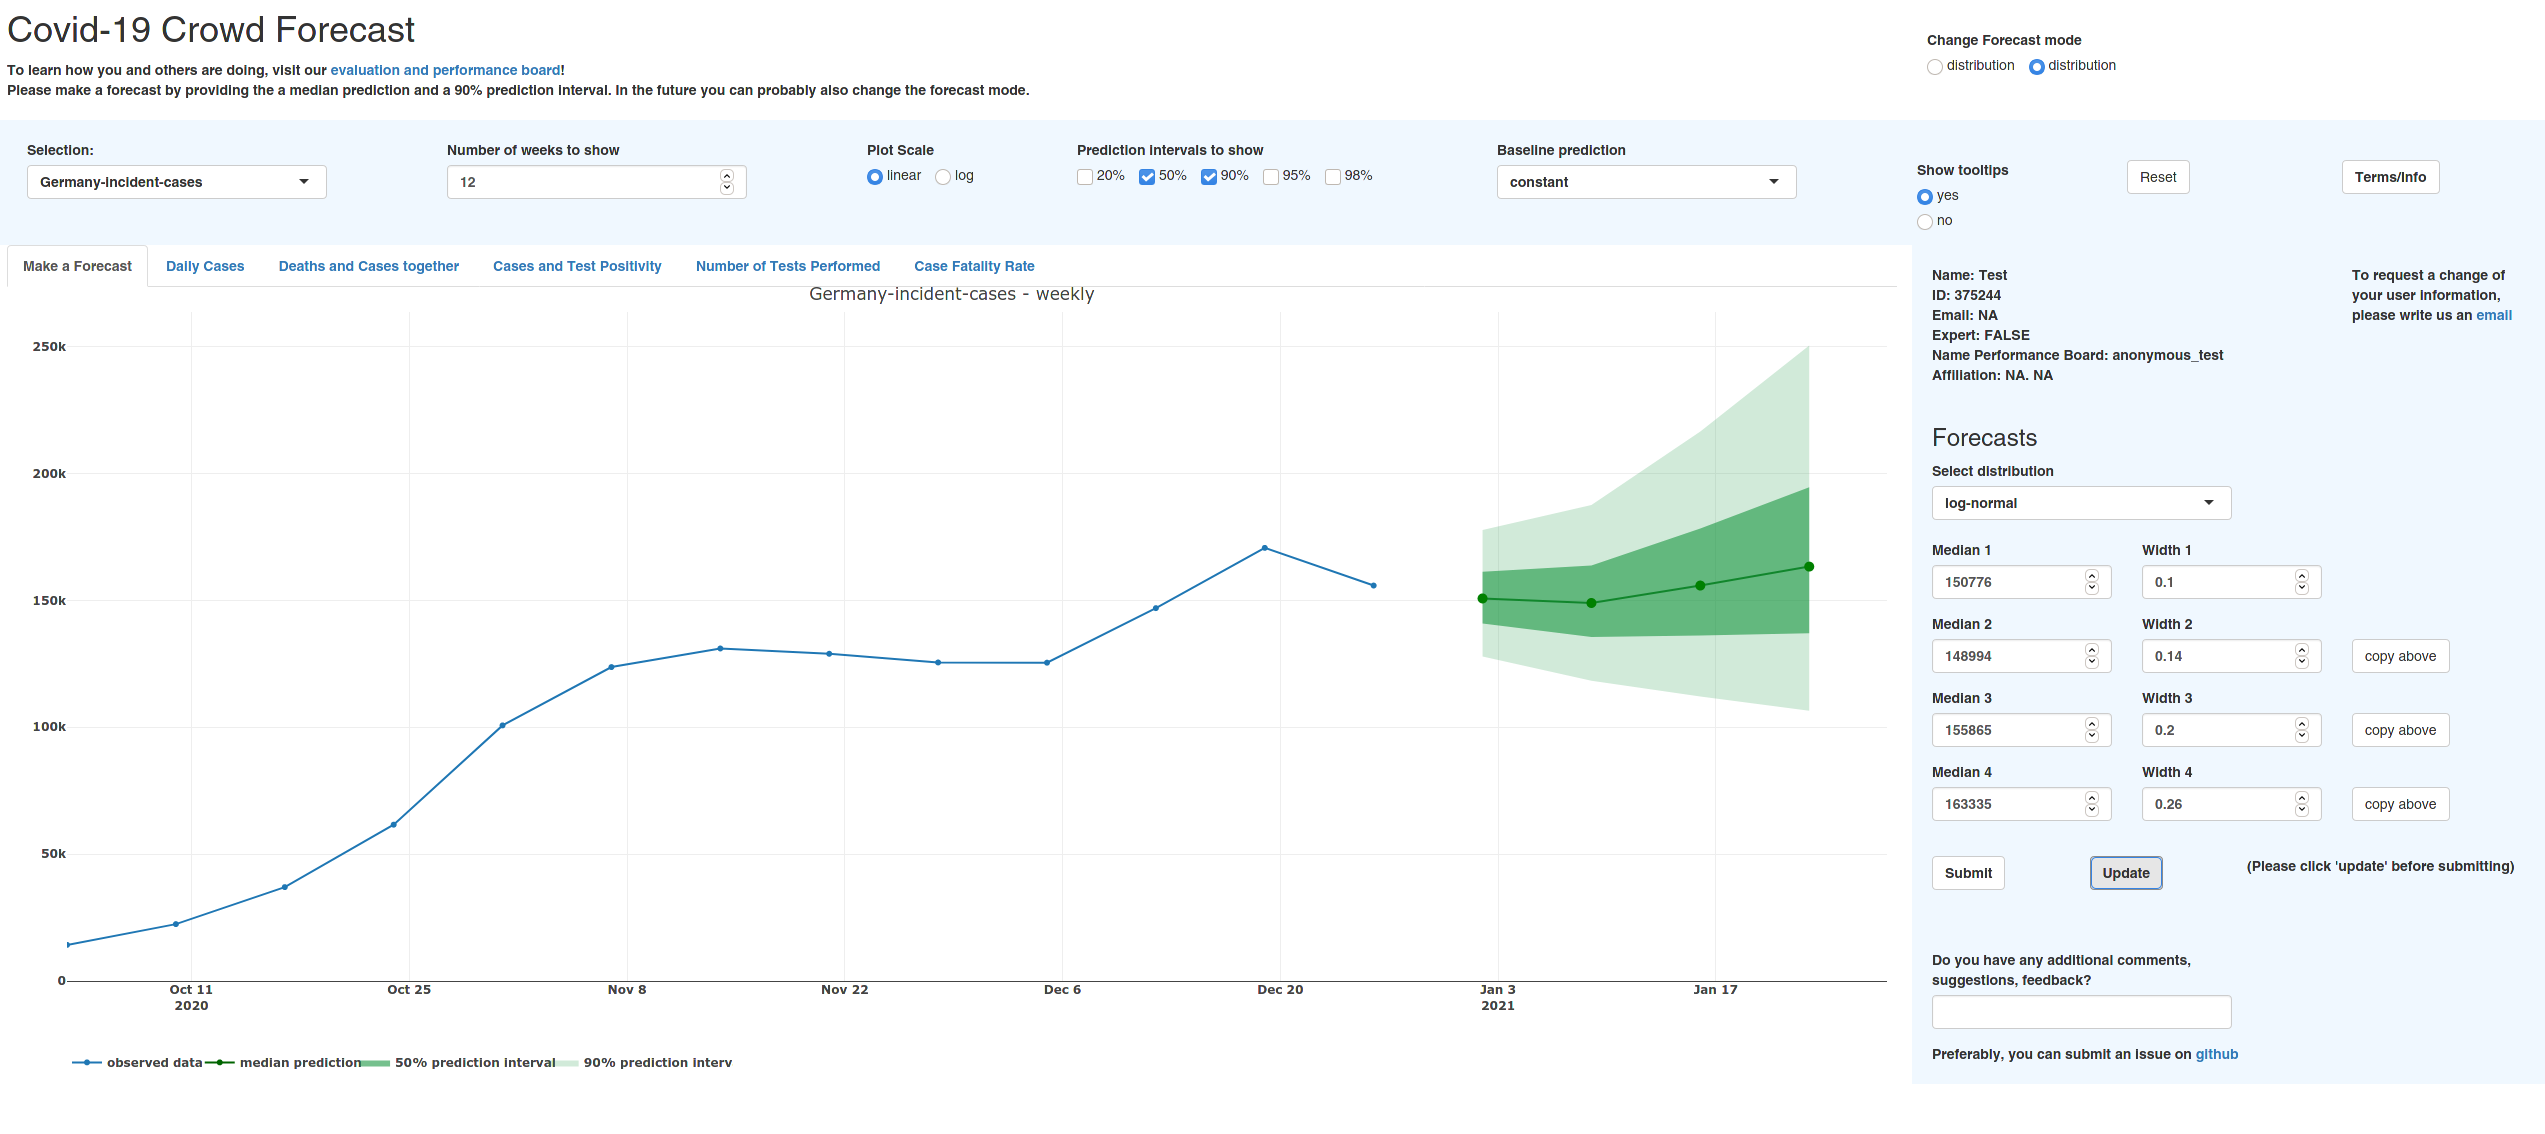
To elicit human predictions, I created a R shiny web app. The app can be found here, the associated github repo is here (you need to navigate to human-forecasts). Here is what the app currently looks like:
Starting from early October, participants were asked to provide one- to four-week-ahead forecasts for Covid-19 case and death numbers in Germany and Poland. Germany and Poland were chosen as a test ground, as we could submit the forecast to the German and Polish Forecast Hub, where our crowd forecasts would directly compete against a variety of computer-generated models.
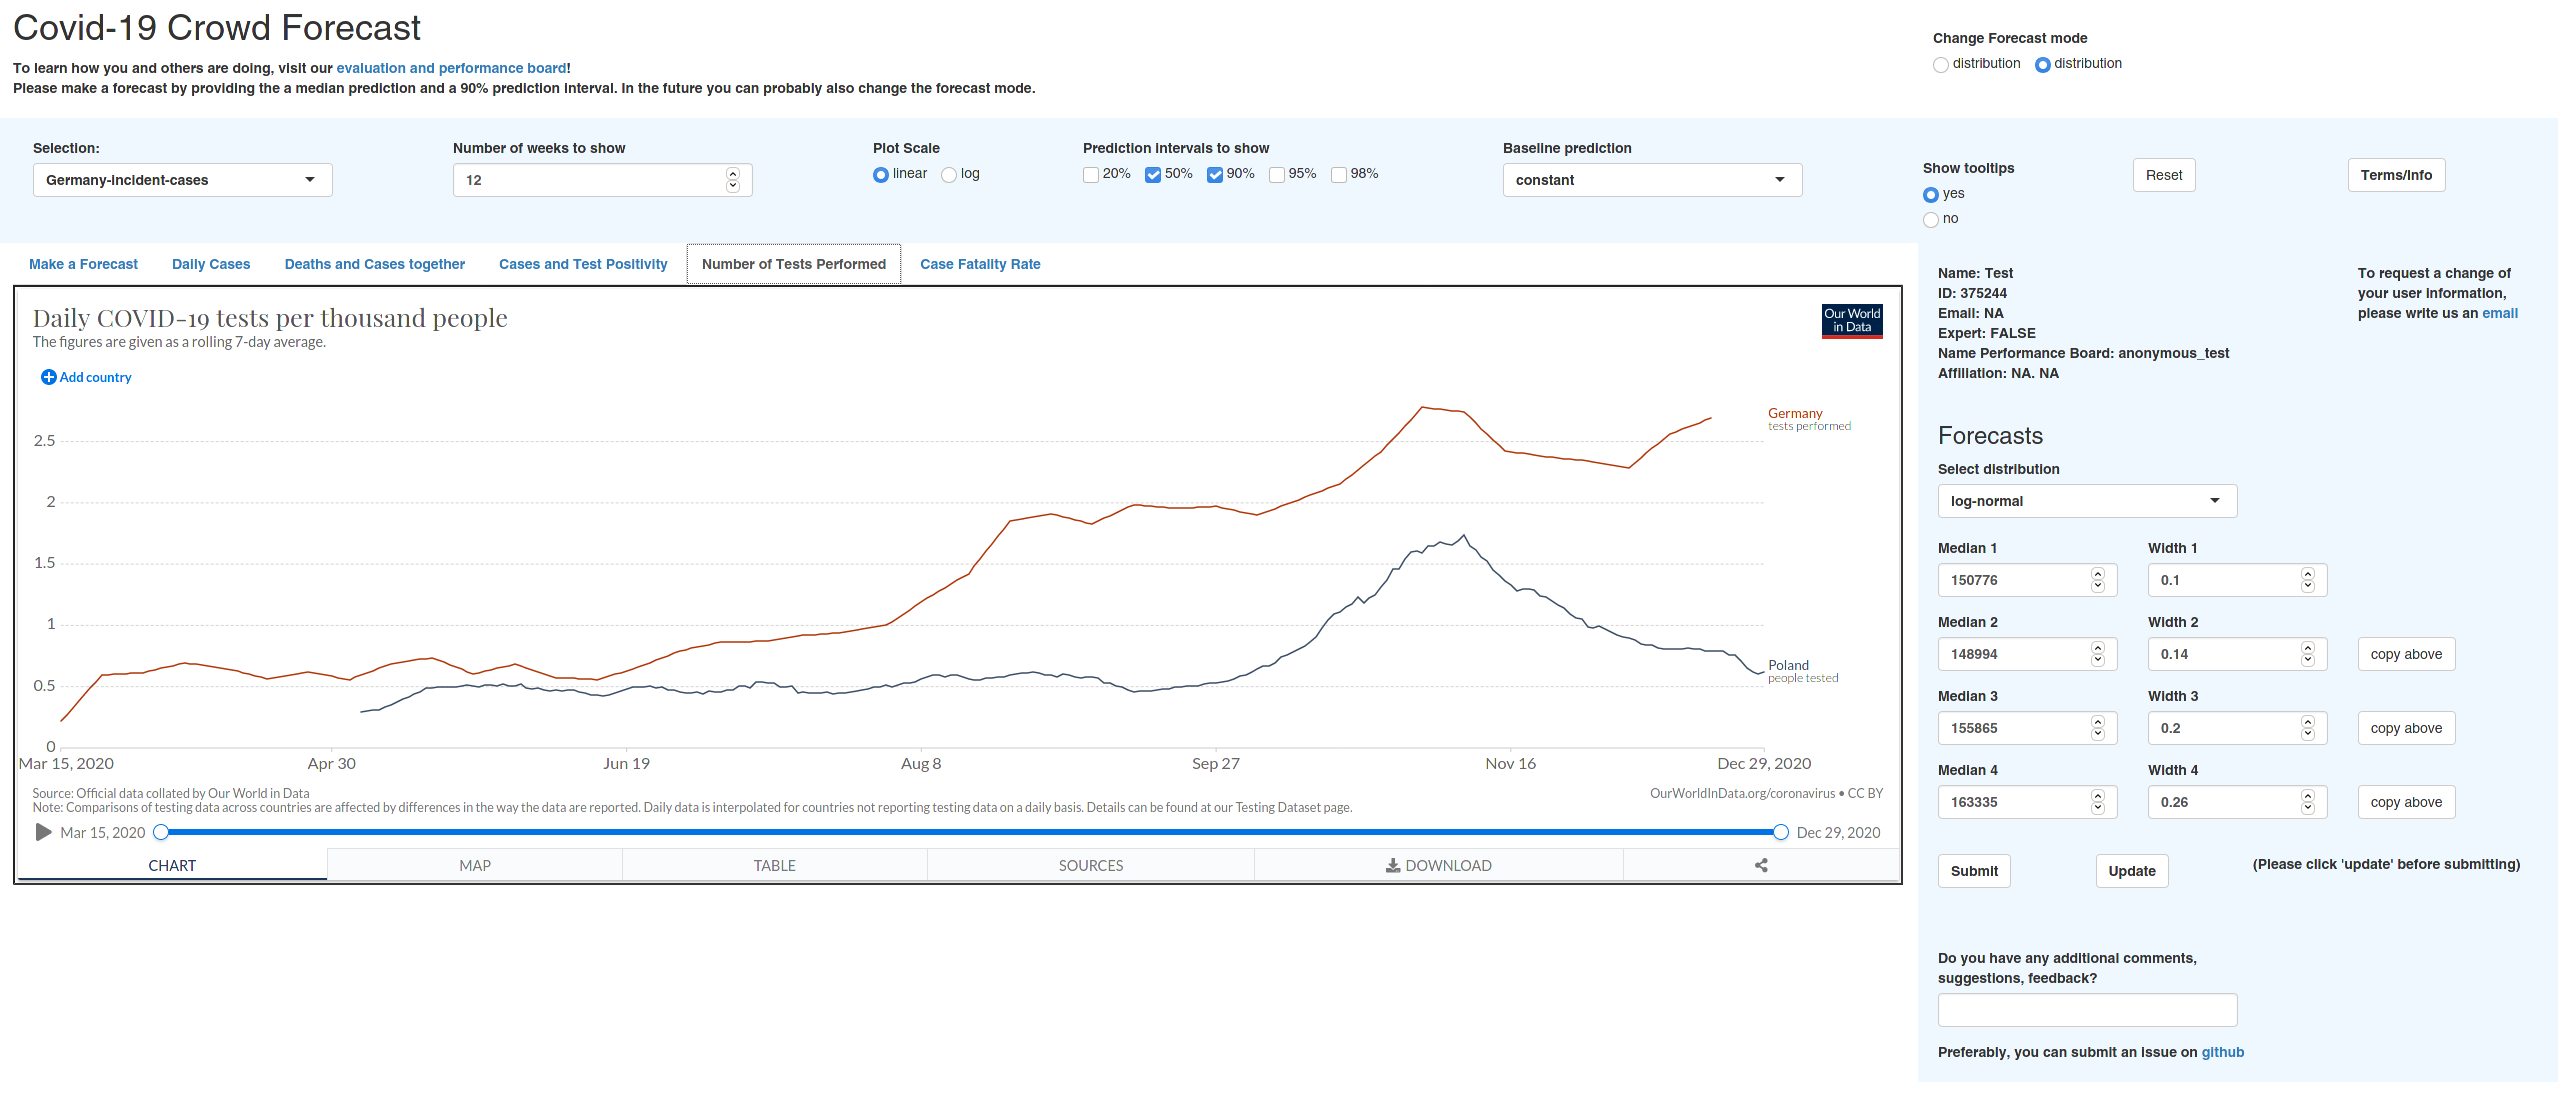
In addition to the past observations, users could access some additional information, e.g. from Our World in Data through the app. Here is a screenshot of that:
Users were asked to provide a full predictive distribution. They would pick one of several variations of the normal distribution (the default is log-normal) and give a median forecast as well as a shape parameter that would determine the amount of uncertainty around the median forecast. Asking for a full predictive distribution makes this a very powerful and flexible tool, as forecasts can easily be converted into other formats. To comply with requirements of the Forecast Hub, we currently convert forecasts into a set of 23 quantiles. These quantiles are the median plus eleven prediction intervals (e.g. a 50% prediction interval, where you would ideally like to have 50% of the true observations fall within that interval).
Forecasts are aggregated by using the mean for every single quantile. Other approaches like taking the quantile-wise median, or using a trained ensemble are of course possible. We decided against this, as we did not have a lot of forecasters (usually between three and eight) and many did not submit a forecast every week or joined later in the project.
Evaluating Forecasts
Forecasts were evaluated using proper scoring rules, as well as a variety of other metrics. Proper scoring rules, in short, are called proper if there is no way to cheat - the forecaster judged by a proper scoring rule is always incentivized to state their true best belief. As we deal with forecasts in a quantile format (after conversion), we can use the weighted interval score (WIS). The WIS assesses forecasts by measuring
score = underprediction + overprediction + sharpness.
Underprediction and overprediction are penalties that you get if the true observed value falls outside of your prediction interval. Sharpness means the width of your forecasts. You therefore get penalised if you are either wrong or to cautious and uncertain in your prediction. Smaller scores are better. The score is then weighted according to the prediction interval. This happens such that inner predictions (e.g. the median) matter more than the outer predictions (e.g. your 98% prediction interval).
All forecasts were scored using an R package called scoringutils I created to automatically score arbitrary kinds of forecasts (You can find the code here). The package does basically all of the work using just a few lines of code.
Other metrics we used were meant to assess certain aspects of the forecasts to find out whether forecasts were biased or badly calibrated. For example, we also looked at coverage, i.e. the percentage of values covered by a given central prediction interval. You would ideally want 50% of true observations to fall in your 50% prediction intervals, 90% in the 90% prediction intervals etc. You can find a full evaluation of our forecasters here. This report is automatically generated using scoringutils.
Results and Lessons Learned
So how did we do? Depending on your point of view: either reasonably, or surprisingly well. First results from the German and Polish Forecast Hub are already published as a pre-print, so I'm mostly taking their results here. The most important plot from the paper in terms of evaluation is this one (we are the yellow model and a lower score is better):
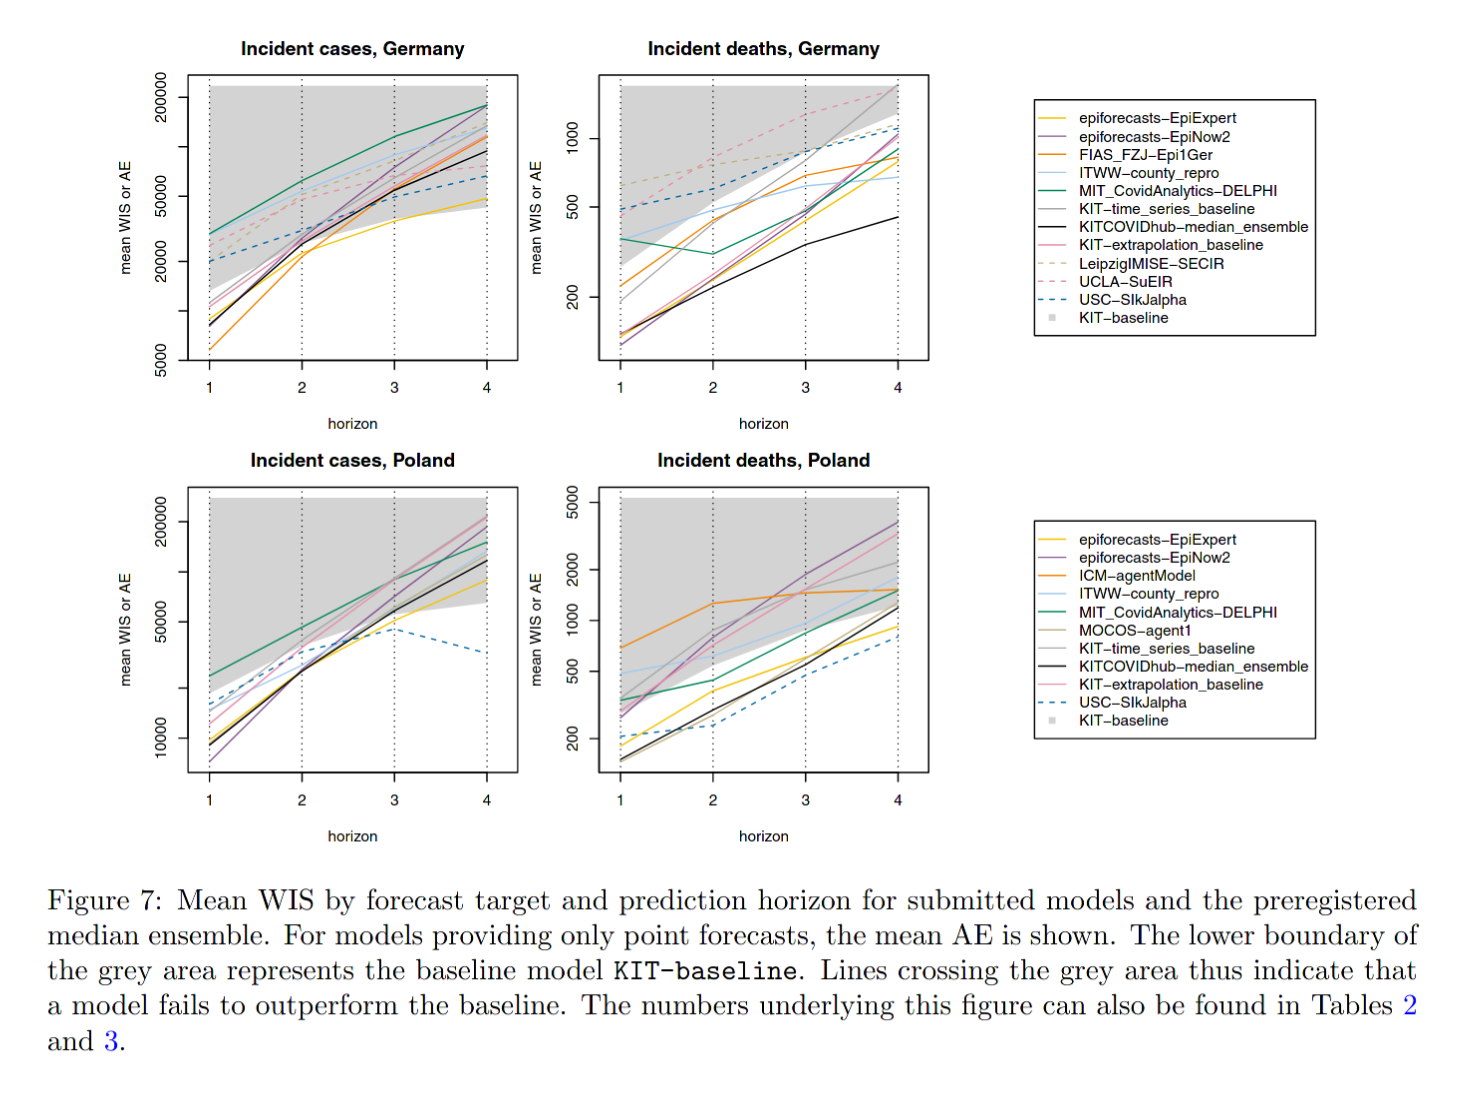
You can see that our model ranks consistently among the top performing models. This is remarkable, given the low number of participants (usually between three and eight, most of whom are living and working in the UK) who each did not spend much more than a few minutes to make a weekly forecast. Usually, researchers tend to spend much more time on tuning computer models. The authors write:
Interestingly, the expert forecast epiforecasts-EpiExpert is often among the more successful methods, indicating that an informed human assessment sets a high bar for more formalized model-based approaches
However, none of the models (including our own) was able to beat the baseline model when it came to forecasting case numbers four-weeks ahead. Sure, the observation period was a time when cases stayed constant for a long time and forecasting is simply a difficult task. It still doesn't bode great that no group was able to outperform a model that simply predicts constant cases on a four-week horizon.
While this is true for the ensemble of all forecasters, it is not necessarily true for all individual forecasters. Our evaluation shows that the ensemble ranks in the middle - some forecasters tend to be quite consistently better than the unweighted mean ensemble. This roughly falls in line with existing literature on Superforecasters [LW · GW] - some people tend to perform systematically better than others. We also found that regular contributors tended to outperform those who only participated sporadically. Providing feedback to participants also helped a lot. Unfortunately, we didn't have a way to assess that rigorously, but quite a few participants told me that and stopped making easy to spot mistakes after receiving feedback. (Such a mistake, for example, would be to not have uncertainty that increases with the forecast horizon.)
Future Work
In terms of the actual predictions, I want to experiment with other model aggregation techniques. Now that we have some past data on performance it seems a good idea to leverage the fact that some forecasters outperform the simple mean ensemble. I'm also working on making forecasts more flexible, i.e. finding simpler and more flexible ways to change certain properties like skew and kurtosis of the forecast. This looked like a promising candidate to me.
The current evaluation report will get a visual make-over and some more explanation to make it more helpful to forecasters. I'm also working on incorporating personalized feedback as well as a simple tutorial with mistakes to avoid into the crowd-forecasting app itself. I believe this is a simple, yet powerful way to improve individual performance.
In terms of the project itself, my goal is to turn it into something that can be easily set up for all kinds of forecasting purposes. I'm currently reworking the app to turn it into a much nicer looking R package called crowdforecastr (you can see the development version here and the code here), but that is not completed. With the package, I want to provide a flexible framework for anybody to use who wants to create their own crowd-forecasting project. Once this is done, you will be able to supply any data you like and start your own forecasting challenge, collect predictions and provide users with feedback.
We are still looking for forecasters, and I would very much appreciate your participation as well as any feedback you might have!
0 comments
Comments sorted by top scores.