Pomodoro Method Randomized Self Experiment
post by niplav · 2024-09-29T21:55:04.740Z · LW · GW · 2 commentsContents
  Scoring the Market
None
2 comments
| Value tracked | Effect size d (λ, p, σ change, k) |
|---|---|
| Productivity | 0.26 (λ≈6.23, p≈0.069, 0.05, 52) |
| Creativity | -0.04 (λ≈0.58, p≈0.92, 0.01, 52) |
| Subjective length | -0.147 (λ≈3.33, p≈0.37, 0.03, 52) |
| Happiness | -0.07 (λ≈0.32, p≈0.96, 0.01, 111) |
| Contentment | -0.13 (λ≈1.08, p≈0.83, 0.05, 111) |
| Relaxation | -0.04 (λ≈1.23, p≈0.8, -0.25, 111) |
| Chastity | -0.14 (λ≈7.76, p≈0.02, 0.74, 111) |
I ran the experiment from 2024-01-29 to 2024-06-17, using spt with this script, managed by this script.
The data on whether a particular day was a pomodoro-method day was saved in this file, and the data on the pomodoros was saved in this file.
The code for loading and transforming the pomodoro data isn't particularly interesting, if you're curious you can find it in this file.
datasets=get_datasets_pom()
Let's proceed to the analysis, then (using the same methodology as for my nootropics experiments:
res=analyze(datasets)
And the results are:
>>> res
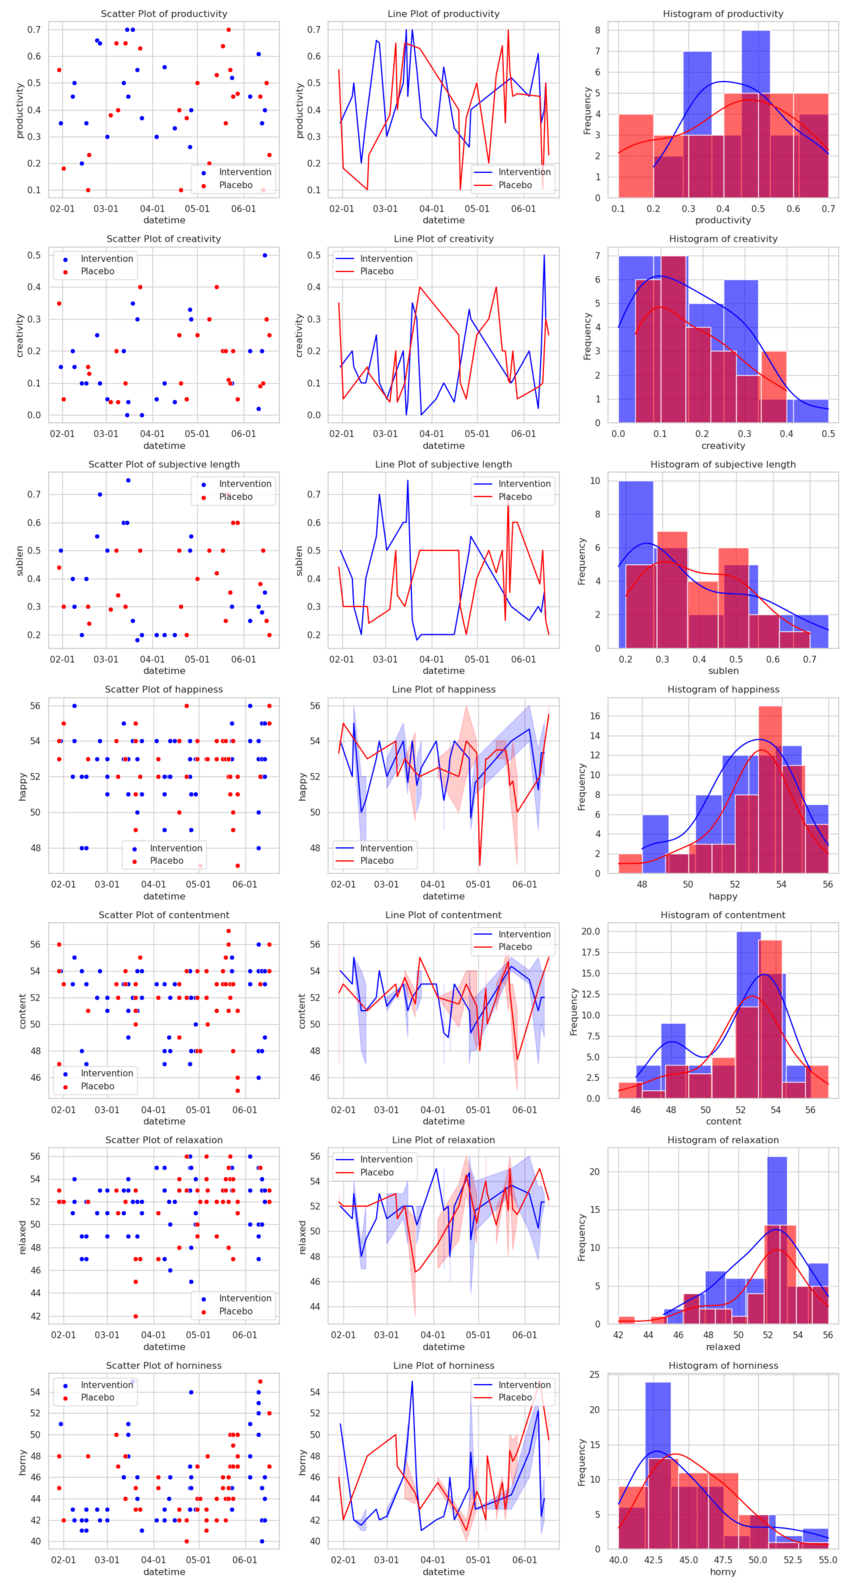
productivity creativity sublen happy content relaxed horny
d 0.259951 -0.041504 -0.147437 -0.073699 -0.132798 -0.038319 -0.144040
λ 6.225107 0.583007 3.329000 0.318865 1.078502 1.232905 7.756272
p 0.069062 0.918520 0.368416 0.959552 0.827240 0.795999 0.022903
dσ -0.050269 0.013871 0.033902 0.007177 0.047723 -0.252365 0.744675
k 52.000000 52.000000 52.000000 111.000000 111.000000 111.000000 111.000000
I didn't meditate or do flashcards during that time, so most of the results don't contain any content.
So the pomodoro method somewhat increases productivity (at the edge of statistical significance), and maybe decreases subjective length of the day a bit.
Scoring the Market
As this experiment was done in the context of an endeavour of selecting QS experiments via prediction markets, I can now score the market:
def logscore(o,p):
        return np.mean(o*np.log(p)+(np.ones_like(o)-o)*np.log(np.ones_like(p)-p))
p=np.array([0.06, 0.29, 0.39, 0.19, 0.07])
o=np.array([0, 0, 1, 0, 0])
logscore(outcomes, p)
-0.3258531953347593
Honestly: The market did pretty well.
2 comments
Comments sorted by top scores.
comment by Derek M. Jones (Derek-Jones) · 2024-09-30T01:24:53.814Z · LW(p) · GW(p)
Thanks for sharing your data.
Column name missing in pomodoros.csv, after start column. Perhaps 'action' is an appropriate name?
The 'action' data could do with some cleaning, e.g., uni vs university, work job vs job work, cal -> call.
Suggest splitting the 'action' column into main/sub. A regression model should find some patterns.
An analysis of a Pomodoro data set.
Replies from: niplav