Mechanistic Exploration of Gemma 2 List Generation
post by Gerard Boxo (gerard-boxo) · 2024-10-14T17:04:57.010Z · LW · GW · 0 commentsThis is a link post for https://gboxo.github.io/2024/10/03/Gemma2-Lists.html
Contents
  Summary
      Preface
  Data Generation
      We ask GPT4-o to provide a list of topics to create lists about.
      We create several templates for Gemma to generate lists:
      For each topic, we sample 5 Gemma Completions with top-k = 0.9 and temperature=0.8
    The mysterious filler token
    Metric
    Attribution of the Proxy Metric in the feature basis.
    Visualization of Features
  Causal ablation Experiments
      Method
      Metrics
    Results
    Conclusions and Future Directions
    Future Work
None
No comments
Summary
- Small Language Models like Gemma 2 2b are incredibly capable of performing an increasing number of tasks, this and the release of the Gemma Scope suite of SAE's motivates the exploration of real world behaviors in LLMs through the lens of Mechanistic Interpretability.
- We investigate the mechanisms behind the so-called "List ending behavior", by leveraging Sparse Autoencoders, and attribution techniques.
- We propose a metric to measure the tendency to end a list by the model at generation time.
- We propose visualization techniques inspired in Bioinformatics to analyze feature importance across the dataset.
- We perform causal ablation experiments to check if we can suppress the list ending behavior while staying in distribution.
Preface
This post is a followup, of a 10h research sprint for a failed MATS application, the structure and methods are similar, but the content has been substantially expanded.
In this post, we will explore the mechanisms behind Gemma 2 2b’s ability to create lists of items, when prompted to.
Specially, we are interested in the mechanism by which Gemma knows when to end a list.
To do so, we leverage SAE and techniques like gradient-based attribution and causal ablations.
Data Generation
To investigate the behavior of Gemma when asked for a list, we create a synthetic dataset of model responses to several templates.
We ask GPT4-o to provide a list of topics to create lists about.
This results in 23 final topics, that we will ask Gemma 2 to create lists about.
Some examples, of those are: Vegetables, Countries, Movies, Colors, etc
We create several templates for Gemma to generate lists:
Template 1 (Base)
Provide me a with short list of {topic}. Just provide the names, no need for any other information.
Template 2 (Contrastive)
Provide me a with long list of {topic}. Just provide the names, no need for any other information.
Template 3
Provide me a with list of {topic}. Just provide the names, no need for any other information.
If not otherwise indicated, all the analysis and explorations were done with Template 1
For each topic, we sample 5 Gemma Completions with top-k = 0.9 and temperature=0.8
The generated outputs look like the following, colored by token/position type.
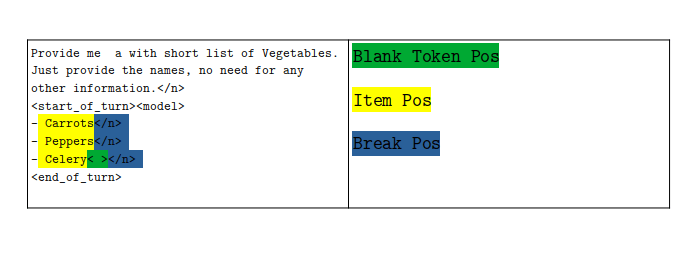
The mysterious filler token
By far, the most interesting behavior that we’ve observed trough different topics and temperatures is the model behavior of including blank tokens near the end of the list. The model includes white space tokens at the very last item position (like the Celery example) or in some cases the last few tokens.
Metric
We use a proxy metric to capture the "List ending behavior", concretely the Logit Difference between the blank and line break token in the last token position of the last item in the list (the Celery position in the above example).
Full explanation in the link post.
In the investigation we selected 5 layers for RS SAEs and 5 layers for Attn SAEs.
| SAE | Layers |
|---|---|
| Attn | 2, 7, 14, 18, 22 |
| RS | 0, 5, 10, 15, 20 |
All the SAEs correspond to the 16k series, and have the sparsity of the ones present in Neuronpedia.
All the experiments with SAEs are done in a one-by-one basis.
Attribution of the Proxy Metric in the feature basis.
Given the vast number of features that get activated in the dataset it’s important to pin down the most important features for the behavior we are investigating, to do so we use Attribution techniques.
Concretely, we want to obtain the most important features that explain a given metric. This metric should reflect the behavior we are interested in.
In this case, given that we are interested in the “list ending behavior” a suitable metric can be the logit difference between the blank token and the line break token logits, at the position just before the end of the list.
We run attribution experiments for all the Attention and RS SAEs (one by one) across all the dataset, and keep the top (pos, feature) tuples.
Visualization of Features
We introduce a kind of plot that resembles Gene Expression Matrices, that enable us to detect local communities of features that are specially present in a subset of examples.
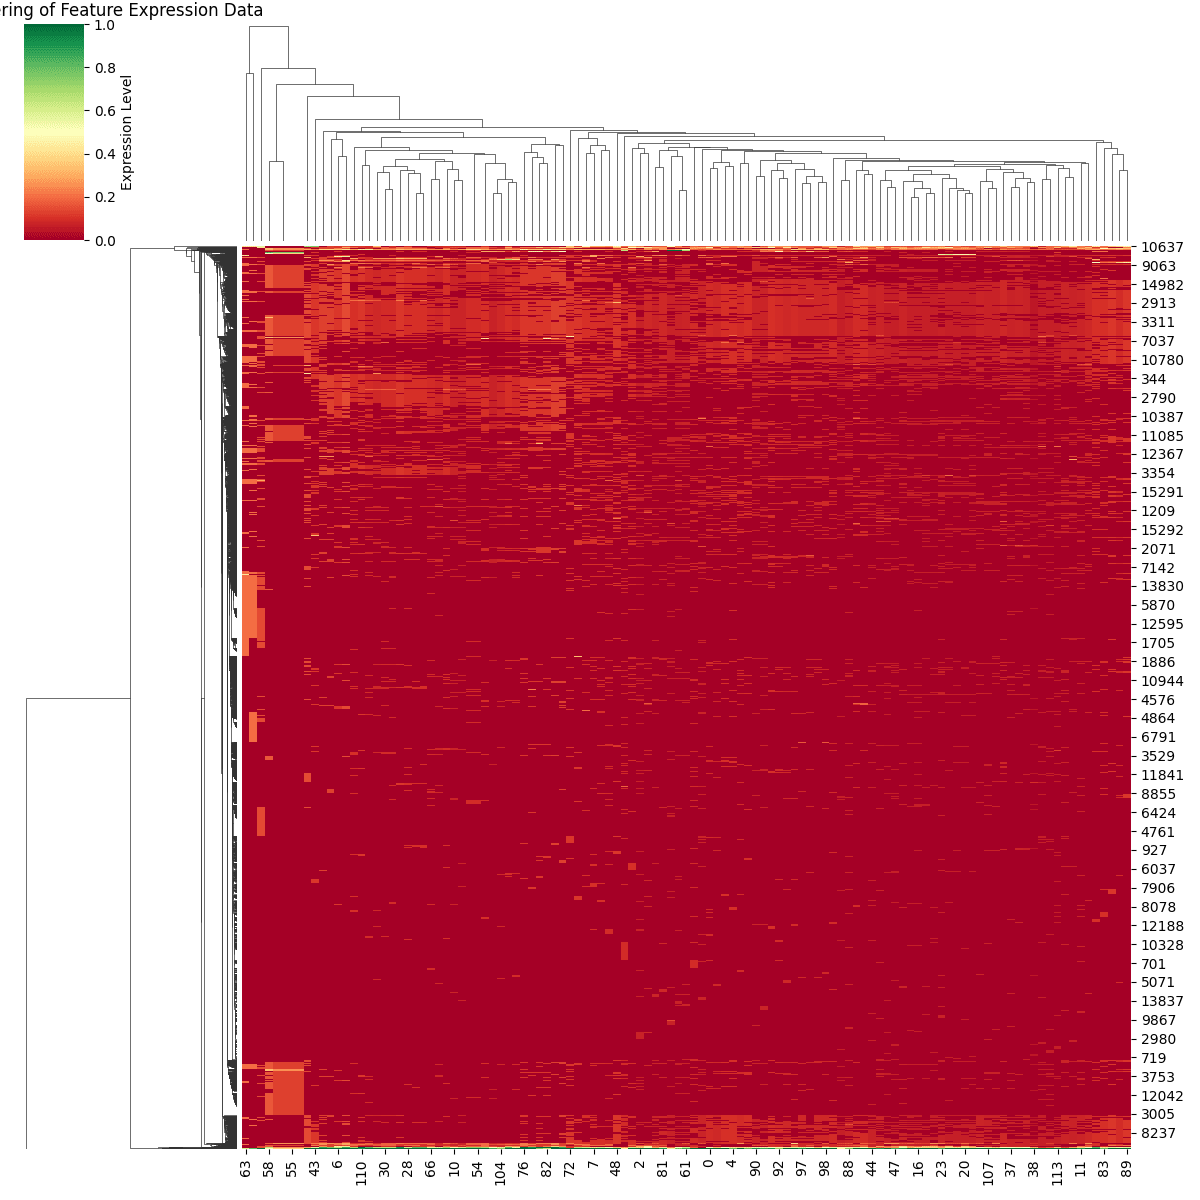 | Feature Expression for important features in RS 5, across the whole dataset.
|
Causal ablation Experiments
Experiments must be performed to empirically test whether the top important features affect in the expected way the behavior of interest.
To this end we performed causal ablation experiments that consisted in setting to 0 the top 5 most important (pos,features) and generating completions. This allows us to investigate whether the list ending behavior was maintained.
Method
- For a given component and layer, SAE. (one-by-one)
- For each sample, we zero ablate the top-5 (position, features).
- Then we generate completions (without any other ablation) and recorded key metrics.
Metrics
- Number of items
- Shannon Index for Items across a topic
- Number of tokens
- Number of repeated Items for each generation
Results
We report the average difference in key metrics between the Ablated Generation and the Base Generation.
The full results are in tables in the link post.
If we average the ablation effects on generation across topics, we get the following key metrics.
| diversity_mean | diversity_variance | n_items_mean | n_items_variance | |
|---|---|---|---|---|
| attn_layer_14 | 0.111443 | 0.048028 | 1.963043 | 6.213043 |
| attn_layer_18 | 0.065051 | 0.028595 | 0.718116 | 1.526087 |
| attn_layer_2 | 0.221969 | 0.064955 | 3.265217 | 8.373913 |
| attn_layer_22 | 0.069707 | 0.035557 | 0.989855 | 2.765217 |
| attn_layer_7 | 0.177179 | 0.043048 | 1.983333 | 3.073913 |
| res_layer_0 | 0.628397 | 0.325129 | 22.221739 | 82.069565 |
| res_layer_7 | 0.329185 | 0.080516 | 7.098551 | 21.591304 |
One impressive example of this, is the SAE in the RS in layer 0, upon close inspection, the top-5 features for this SAE were very related to the short token, after ablation the average number of items is close to the Template 2.
For the other SAEs the resulting number of tokens was close to the Template 3.
The SAEs with less than 1 extra item in average can be classified as not effective at suppressing the list ending behavior.
Conclusions and Future Directions
In summary, applying Mechanistic Interpretability techniques in real world problems is not straight forward, and many compromises and assumptions must be made. This work pretended to be a first approximation in using MI techniques in scenarios that more resemble the real world.
Even though some amount of progress has been made into attacking this problem, this investigation falls short to the goals of mechanistic interpretability.
While the empiric results are encouraging, (full elimination of the list ending behavior with just 5 edits), the results are not fully satisfactory.
Even though ablating some key features prevents the list ending behavior, other simple methods do it also like restricted sampling, or steering vectors.
Future Work
Several areas for future research have been identified:
- Benchmarking different heuristics for selecting layers based on memory versus circuit faithfulness.
- Applying established techniques for feature explanation to the relevant dataset.
- Utilizing Transcoders and hierarchical attribution to develop complete linear circuits.
0 comments
Comments sorted by top scores.