Averaging samples from a population with log-normal distribution
post by CrimsonChin · 2023-11-03T19:42:16.630Z · LW · GW · 2 commentsContents
    A silly example of CLT
     Does it work with log-normal populations?
  Chess matches:
    Data from the population
    Tournaments
  Lessons?
None
2 comments
This was originally a comment on this post [LW · GW] by mruwnik [LW · GW] regarding averaging various distributions with different distributions. I made it a post to include pictures.
The Central Limit Theorem, henceforth CLT, states (in my own words) that regardless of the distribution of a population, sample averages from that population should be normally distributed.
In theory it should hold for log-normal distributions but that doesn't feel intuitive to me so I tested it.
A silly example of CLT
An example I made up in my head to make sense of it:
Imagine a population comprised of all the people who nap 2 times in a day. Lets plot the ages of this population:
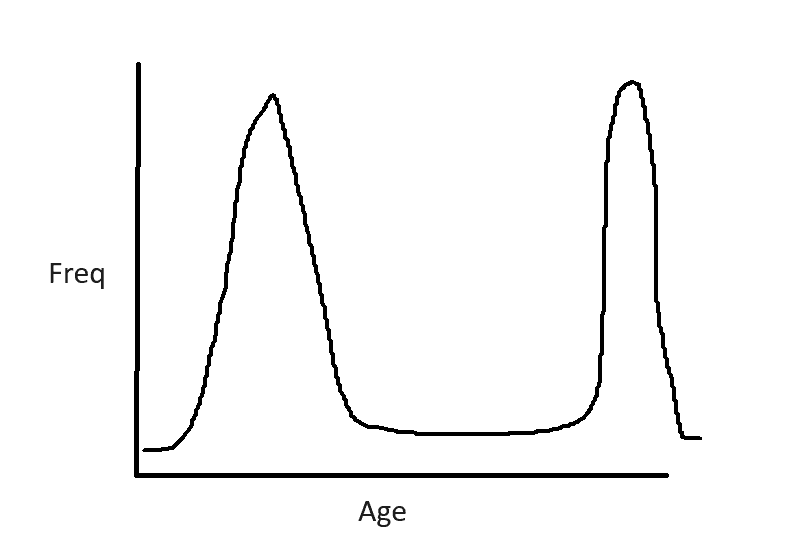
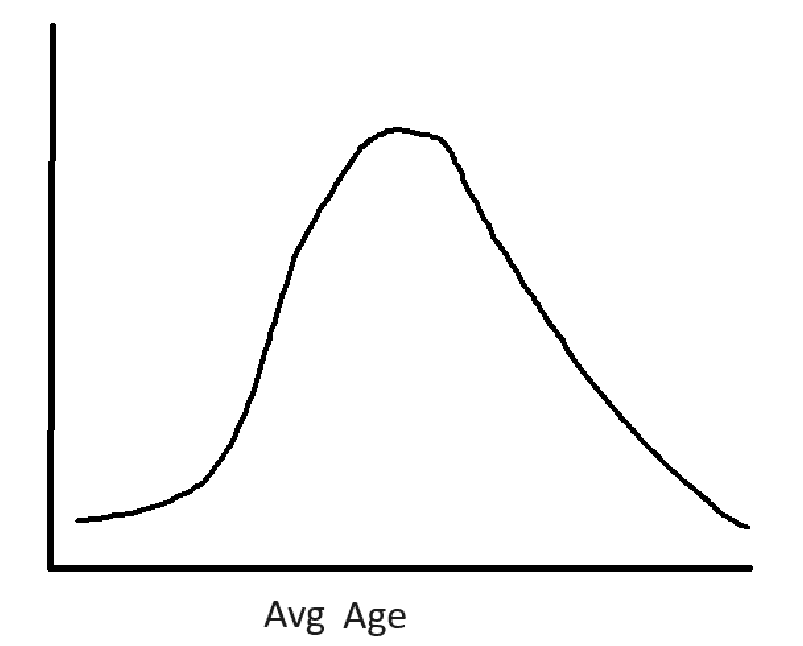
Mostly infants and elderly people nap, hence the shape of the graph. This data is NOT normal. But if you randomly pick a small sample (n=10) from this population and average it, it will have a mix of old people and infants that averages to middle-age. For example imagine the ages are 80,2,1,2,75,76,1,1,85,70 this will average to about 39. If you do this over and over again with randomly chosen samples you will get a normal distribution.
Does it work with log-normal populations?
I didn't find it intuitive this would work for a log-normal population.
If I take data that is log-normal but split it into small samples, will the average of those small samples be normally distributed?
Chess matches:
I am arranging a chess tournament. I need to figure out how long the average match is so I can plan accordingly. I hear that chess matches seem to follow a log-normal distribution, but I'm not sure what that means statistically so I will try to just average the game times.
Data from the population
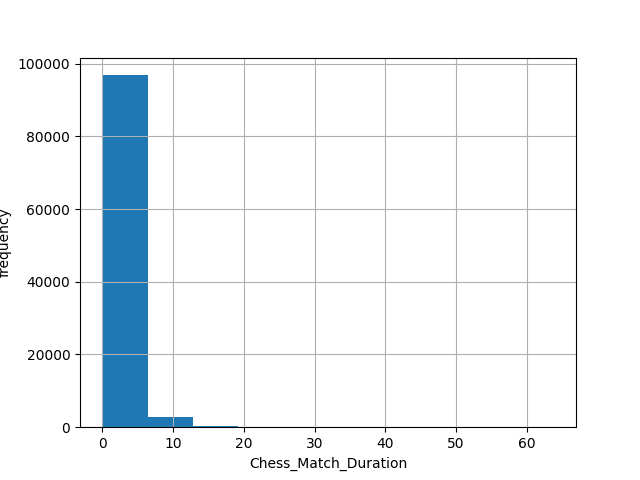
This is what my fake population (n=100,000) looks like. Its log-normal.
Tournaments
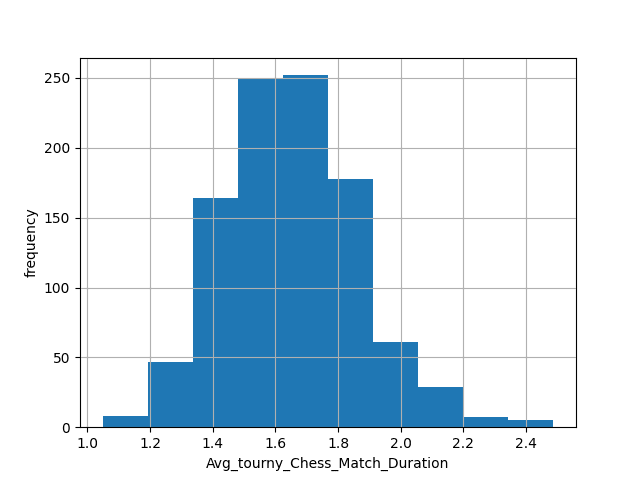
I observe tournaments (n=100 games) and take a simple average of the match length.
Here is a histogram plot of the tournaments
Lessons?
The sample size does matter here. A sample size too small (n=10) and you just end up with the original log-normal distribution. This is expected as the sample size moves from small to large you get a range of smoothing effects pushing the distribution to normal until you get a single point, when the sample = population.
2 comments
Comments sorted by top scores.
comment by gwern · 2023-11-03T20:40:00.863Z · LW(p) · GW(p)
This is a good starting point to discuss where the CLT breaks down: a log-normal doesn't look all that normal, but it's normal enough that it will converge under CLT. So at what point does CLT break down? Well, the log-normal tail is fat but not fat enough to do it; you need to go to something without finite variance, like a Cauchy distribution... You could also discuss the log-normal variation of the CLT: why does it not happen for your chess match length when the chess matches are log-normal, and what sort of scenario might make it do so?
comment by lalaithion · 2023-11-03T21:03:18.163Z · LW(p) · GW(p)
There are distributions which won't approach a normal—Lévy distributions and Cauchy distributions are the most commonly known.