Quantitative Philosophy: Why Simulate Ideas Numerically?
post by Shmi (shminux) · 2019-04-14T03:53:11.926Z · LW · GW · 4 commentsThis is a link post for https://quantitativephilosophy.wordpress.com/
Contents
  PEOPLE FEEL MORE AFFINITY TO THOSE WHOSE VIEWS ARE CLOSE TO THEIR OWN, AND ARE OFTEN REPULSED BY THOSE WHOSE VIEWS DIVERGE A LOT FROM THEIRS. WHAT IS THE RESULTING DYNAMICS OF THESE HUMAN PREFERENCES?
None
4 comments
Adapted from my blog. I argue that numerical simulations are an effective yet underused tool in philosophy (and rationality) and give a concrete example of a numerical toy model, from assumptions to design to implementations to results, including the source code and a live site to play with.
It used to be that logic was king. A convincing argument was all that was necessary to get one’s ideas taken seriously and often accepted. After all, if it makes sense, it must be right, right? Right? The thought of actually checking the ideas experimentally is not very old, and, while firmly entrenched in the scientific method, sometimes earnestly, sometimes as a lip service, it is still not the commonly accepted practice in many “softer” sciences.
This forum is a site devoted to rationality, and has plenty of interesting insights, but very few of them have been actually tested. There is a good reason for it: thinking ideas up is much easier than checking them! Eliezer Yudkowsky, the original contributor, set this tone of using reasoning as an argument, without ever closing the feedback loop of checking the conclusions with numbers. There were a few exceptions to this pattern, such as the Iterated Prisoner’s Dilemma bot tournaments, but in general the focus is on reasoning and sometimes mathematical proofs, where possible and warranted, not on making testable predictions and actually testing them.
This leaves out one of the most powerful tools of checking validity of an idea: numerical simulation. If the idea is any good, one ought to be able to formalize it to the degree where its conclusions can be tested by creating simulations and studying their behavior.
The situation is somewhat better at Slate Star Codex: Scott Alexander has lots of wonderful ideas, and he is more aware of the need to check them by something other than more logic. But his approach for testing them is generally literature search or polls/surveys. Those are useful, but they focus on the ideas as black boxes, rather than on their internal mechanics.
Some examples of interesting ideas ripe for numerical modeling:
In the following I focus on one idea, similar to the outgroup one listed above:
PEOPLE FEEL MORE AFFINITY TO THOSE WHOSE VIEWS ARE CLOSE TO THEIR OWN, AND ARE OFTEN REPULSED BY THOSE WHOSE VIEWS DIVERGE A LOT FROM THEIRS. WHAT IS THE RESULTING DYNAMICS OF THESE HUMAN PREFERENCES?
An obvious conclusion that people form cohesive groups that are hostile to other cohesive groups. A set of local (often suboptimal in some sense) equilibria forms that is hard to change.
How would one go about modeling these ideas numerically? My attempt at doing so is described below.
First, obviously we cannot model this segmentation and alienation process in full generality, there are too many factors to consider. The art of modeling is in picking those that are both important and easy to describe quantitatively. The results of such an approach look pretty natural in retrospect, but are anything but easy to converge on. So, below I will endeavor to describe not just the final model, but how I got there, without the benefit of a hindsight.
- How does interaction between people work? At a very basic level people exchange ideas, opinions, thoughts and, more often than not, praise and insults.
- This used to happen mostly between those who are in physical proximity, but, the world being global and connected, at least (mis)informationally, the interaction is no longer limited by distance
- Even people who are fairly close in views to each other tend to have a bit of variation, and their views may shift randomly a little here and there
To describe what happens to people’s views as a result of an interaction between them, we need some simplified description that can be modeled numerically. People tend to fall prey to the confirmation bias a lot, which gives us two basics characteristics of the interaction:
- Interaction between two people who are fairly close in their views on a given topic provides the confirmation they crave, and results in further convergence of the views. This phenomenon can be described as a force of attraction.
- Interaction between people with wildly divergent views also provides the confirmation of their own opinions, only in contrast to the other person’s horribly misguided and wrong one. This can be modeled as a, well, repulsive force, pushing people further apart.
What happens when people’s views are very far from or very close to each other?
- When the views have almost converged, there is very little change as a result of the interaction, so the force of attraction is, counter-intuitively, gets weaker at “shorter distances”
- When the views are so far apart, we can no longer relate to them, or maybe even take them seriously, the result of the interaction is very little change in our own views, so the force of repulsion is weaker, as well.
- Potentially, since we are all humans, there are limits to how far the views can diverge, because there are generally some basic shared ideas that most people subscribe to, like, say, the desire for humanity to survive and prosper. So, at the very large divergences the repulsion again turns into attraction, if very weak.
Humans have opinions on a wide variety of topics, and, while there is a correlation, even if they are in agreement on one issue, they do not necessarily agree on every issue. This complicates the situation, making it multi-dimensional, and adding complications to a potential numerical model of it. So, at this point, as a toy model, focusing on a single dimension should be a good enough start.
It is a well known phenomenon that people sometimes radically change their views, for example undergoing religious conversion or de-conversion, and changing group allegiances as a result. It is not immediately clear how to model this numerically, and, unless this process magically emerges from the results of the simulations, is best left for future investigations.
Another point to keep in mind is the initial distribution of views before the interaction. If everyone starts agreeing with everyone else, it is not likely that anything would change, given the above assumptions. So, some spread of the views is necessary to get a non-trivial dynamics. The nature of this spread is probably something to play with once the model is implemented. Potential options to consider:
- Symmetric vs. asymmetric distributions, corresponding to mainstream vs niche views.
- Uniform vs. “dumbbell” distribution, where people are already primed even before the interaction.
Assuming the above program is implemented, what do we expect to learn from running the simulations?
- First, validate the model itself! Always an essential step. If the underlying code or math is wrong, the model is worse than useless, it can force one to make completely unwarranted conclusions. (Totally not speaking from experience! Not at all!)
- Second, figure out the range of parameters where we get the expected results. Every model has adjustable numerical parameters, and finding the parameter space as the home base to start at is definitely worthwhile.
- It might happen that there is no such home base, and this would be even more exciting than getting the expected results! It would either mean that the whole idea is bogus, or that our model of it is inadequate. In either case, it is back to the drawing board!
- Once we have a well-behaving numerical model, it is play time! Time to reap the rewards of all the hard work by varying the parameter space and watching what happens. Hopefully something new and unexpected would show up!
- This is where the real payoff of numerical modeling is: finding something new and having those “Aha!” moments, where the unexpected results make us learn something new and gain insights that were missed in simply “applying logic”.
So having put some thought into what to model, what simplification to make and what the goals are, it’s time to get down and dirty.
I have already decided that:
- The initial version would be one-dimensional.
- The interaction is attractive at short distances, repulsive at large distances, and again weakly attractive at large distances.
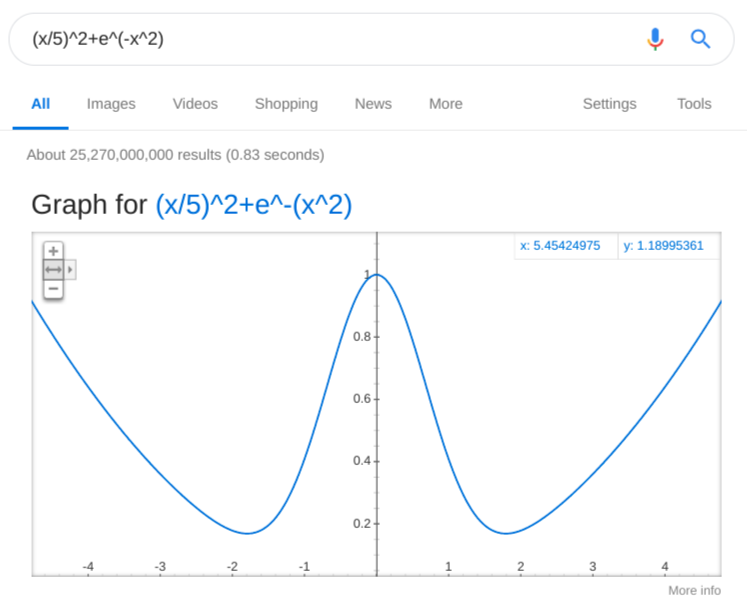
These two assumptions let us pick the shape of the interaction. Given my background in physics, I naturally think of forces in terms of potentials first. The magnitude of the force corresponds to the slope of the potential. Attractive force corresponds to the positive slope, and repulsive force corresponds to the negative slope. The complete potential can be combined from those with the basic tools of addition and multiplication. To simulate the attractive force, we can use everyone’s favorite harmonic oscillator: a stretched spring tends to contract. Google helpfully constructs the graph for it:
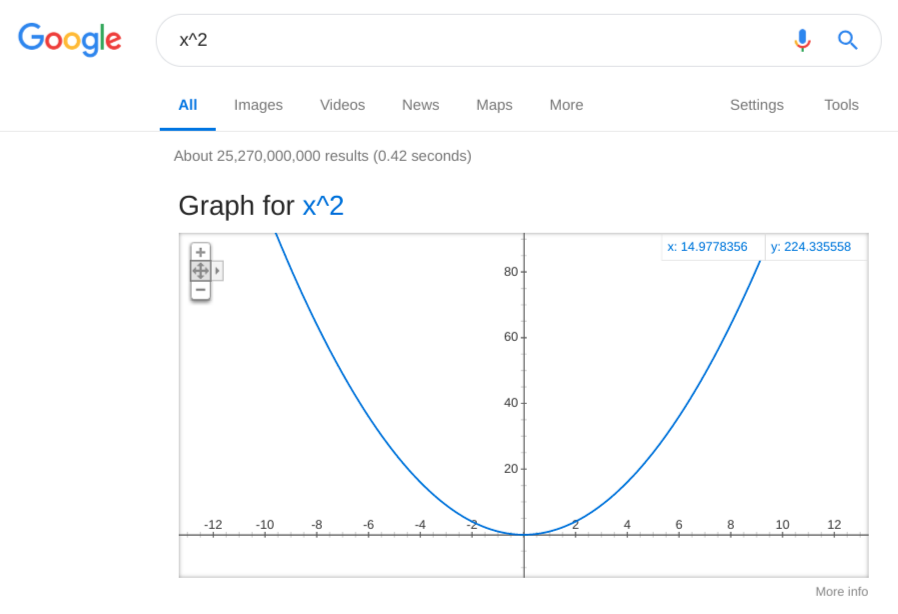
This has the basic shape we want:
- The attraction (convergence of views) is low when the views are already similar.
- The attraction increases when the separation is a bit larger.
If you are not familiar with the potential curves, think of it as a hilly slope, and you and your friend being on the opposite sides of it. In the situation above you would naturally roll down toward each other.
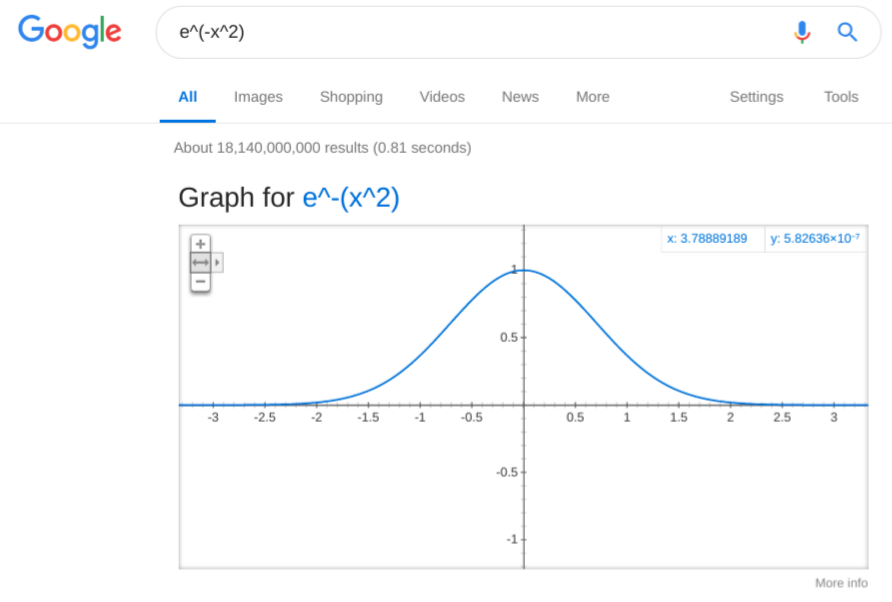
Now, to get the repulsive side of the interaction, we can use another well-worn tool, the bell curve:
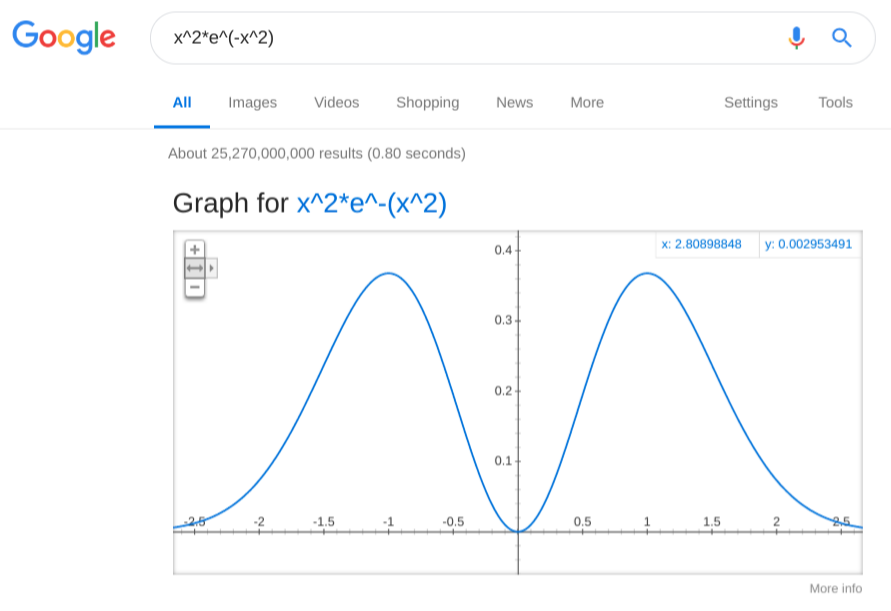
So we have the two out of three features of the interaction shape: the attraction when close together and repulsion when further apart. Let’s compose them together, and the way to do it is simple multiplication:
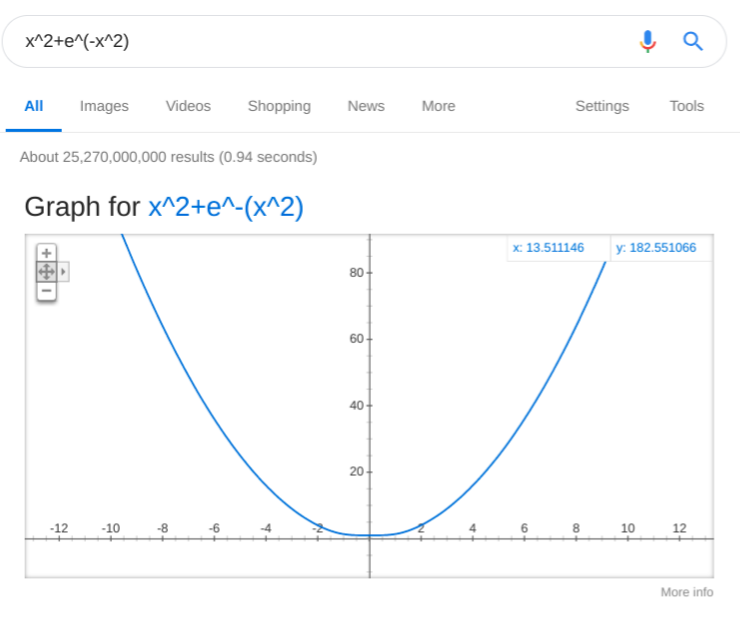
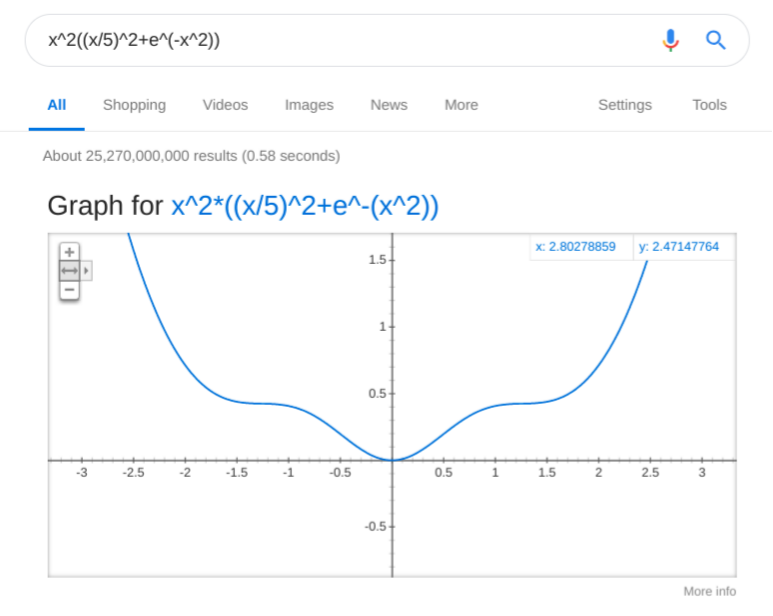
We are almost there! Just need to add the last piece, the weak attraction at large separations. Again, the harmonic oscillator potential to the rescue! Only we need to add it to the bell curve first:
Uh oh… That didn’t work out as expected! The spring is too stiff and completely overwhelms the little bell. Let’s loosen the spring up a bit, by dividing its potential by a big number. Say, make 5 times looser:
That looks better, but clearly the stiffness of the spring should become one of those adjustable parameters once the model is done. Now to put all three together:
Another oops… What happened? The bell curve, again, was too weak to show prominently. Need to suppress the weaker spring a bit more, maybe 10 times more:
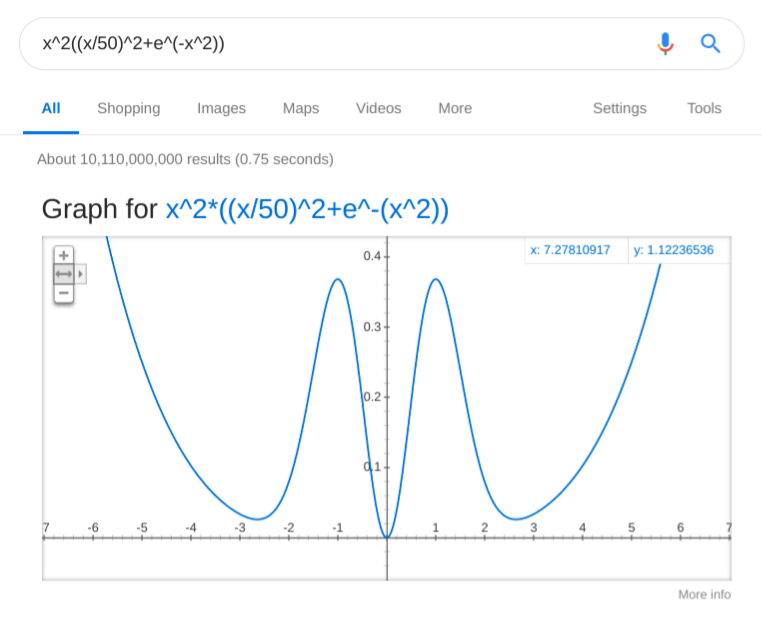
This is more like it! Let’s look at it more closely:
- People whose opinions are separated by approximately less than one “unit of disagreement” would tend to “slide” toward each other and maybe slosh a bit around zero-disagreement.
- People whose opinions a separated by somewhat more than that, will find each other’s views repulsive enough to feel like the other person is a part of an “outgroup”, and instinctively distance themselves from them.
- Eventually the “shared human values” start to matter, and there is a certain separation distance where the two parties, while repulsed by each other, just shrug it off without any further need to distance themselves from the other. How faithful this model is is debatable, of course, but for a first approximation it does not look too out of place.
Clearly playing with the shape of the interaction potential is not done, but it is good enough for now, and it is time to go to the next step. Well, not quite. Let’s have one more chart, converting the shape of the potential into the shape of the force. Google calculator is not up to snuff there quite yet, but Wolfram Alpha is, though the free version has low resolution and no customization:
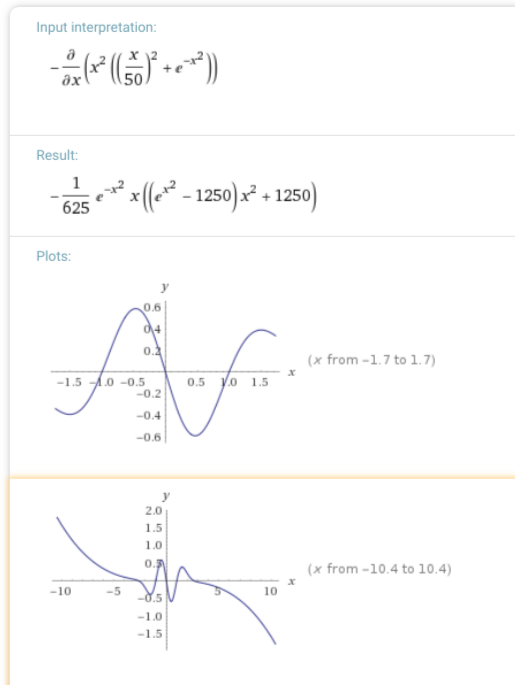
I don’t find the force graphs as illuminating as the potential graphs, but one can still make sense of it: negative values correspond to the force pulling to the left, and positive values correspond to the force pulling to the right. So, again, when the views are close, they converge, when they are farther apart, they tend to separate to a respectable distance, but not infinitely far. The force, and not the potential is what we need to calculate how people’s opinions move after interacting, anyway.
That was the easy part, picking the shape, next we have to figure out how to actually implement the dynamics of interactions and changing personal views.
I will not discuss it here, an interested party can read about it in my blog post:
The code itself can be found in https://quantitativephilosophy.wordpress.com/2019/04/12/separation-and-clustering-of-views-the-app/
This site doesn't seem to allow embedded sites or embedded html+javascript, so I cannot insert the actual app in here, instead you can go to
https://sites.google.com/view/numericalsimulationofclusterin/home
to play with the model. I will talk about it more in a companion post to follow. But here is a video of one simulation run: https://i.imgur.com/iDaH9nj.mp4 to give the idea of it, wish I could embed it here though.
4 comments
Comments sorted by top scores.
comment by Gordon Seidoh Worley (gworley) · 2019-04-17T02:17:51.437Z · LW(p) · GW(p)
It's unclear to me that the model you construct has much relationship to your tested idea, or at least any more than any other words or images you could have provided to illustrate the idea. I get that you see peaks and valleys in the function that you interpret as related to attraction and repulsion of people towards clusters, but again I don't see any clear grounding of this model in the idea you are testing, so to me it just feels like you drew a picture to illustrate the idea in a very convoluted way. Put another way, I don't feel like your model constrains your belief in the idea at all, because you could have come up with any function to draw any curve you could have wanted to show us.
Maybe I've missed something where you did provide a grounding, but I read back through the post a second time and still didn't see anything definitive. If there is something like that, or if you left it out and can explain how the model is causally connected to the idea such that something about the model says something about the idea, can you do so now?
FWIW I went in to this expecting a very different sort of model, one more like a simulation using simple bots that interact in simplified ways you describe and then we could see how they end up clustering, maybe by each bot keeping an affinity score for the others and finding results about the affinity of the bots forming clusters. That feels to me like it does have some more grounding in the idea being tested, where each bot is simplified stand-in for a person and their interactions and affinity scores for the other bots stand in for human interactions and human affinity for other humans. But again maybe you have some reason for thinking the model you present has the same kind of causal connection by sharing some structural similarity; I just don't see it so would appreciate if you could clarify.
Replies from: shminux↑ comment by Shmi (shminux) · 2019-04-18T01:41:07.766Z · LW(p) · GW(p)
First, thank you so much for taking the time to reply! I sucks to write into the void, and your thorough comment gives me much needed feedback.
It's unclear to me that the model you construct has much relationship to your tested idea
I must have been super unclear, yes. The model I suggested as a first approximation is very basic:
- People with similar views attract (they talk and their views converge), people with divergent views repel (they talk and dislike what the other party says, and their views drift apart even more).
- The interaction amount between people does not depend on how close their views are. This is not a great approximation in general, but gotta start somewhere. Also, in an online world it is hard to avoid interactions with those you disagree with, so the assumption does not seem to be totally without merit. But definitely can be improved upon.
- The shape of the attraction/repulsion as a function of the distance between views is definitely largely arbitrary, just something simple that would reflect the first point above.
- The model is memory-less, e.g. you don't keep tabs on the past interactions, at each step each interaction between each two people is evaluated on its own merit.
I am not sure if this answers the question about the grounding, I am most likely missing something.
FWIW I went in to this expecting a very different sort of model, one more like a simulation using simple bots that interact in simplified ways you describe and then we could see how they end up clustering, maybe by each bot keeping an affinity score for the others and finding results about the affinity of the bots forming clusters.
I am not sure I follow. The bots indeed do end up clustering into 4 to 5 different clusters, where each cluster represents a certain convergent view. By "keeping the affinity score", do you mean they keep track of the past interactions, not just compare current views at each step? That would be an interesting improvement, adding memory to the model, but that would be, well, an improvement, not necessarily something you put into a toy model from the beginning. Maybe you mean something else? I'm confused.
Replies from: gworley↑ comment by Gordon Seidoh Worley (gworley) · 2019-04-18T21:15:28.201Z · LW(p) · GW(p)
I am not sure I follow. The bots indeed do end up clustering into 4 to 5 different clusters, where each cluster represents a certain convergent view. By "keeping the affinity score", do you mean they keep track of the past interactions, not just compare current views at each step? That would be an interesting improvement, adding memory to the model, but that would be, well, an improvement, not necessarily something you put into a toy model from the beginning. Maybe you mean something else? I'm confused.
Oh, this paragraph seems to suggest your model has a lot more going on that I got from reading this post. Maybe if I followed you links I would find some more details (sounded like they were just extra details that could be skipped)? I got the impression you found a function that has a shape illustrative of what you want and that was it, but this sounds like there's a lot more going on not described in the text of this post!
Replies from: shminux↑ comment by Shmi (shminux) · 2019-04-19T01:46:41.303Z · LW(p) · GW(p)
Right, this an honest dynamical model, the curves from the followup post is the opinion bots converging or diverging as they interact. I thought I explained it, and I think it's in one of the blog posts, but looking back at it, apparently not on this site. Thanks!