Do small studies add up?
post by one_forward · 2022-03-15T22:00:24.625Z · LW · GW · 6 commentsContents
  Overcomplicating the problem with math
    Blindly weighted averages
    Bayes and bias
  Meta-analyses
None
6 comments
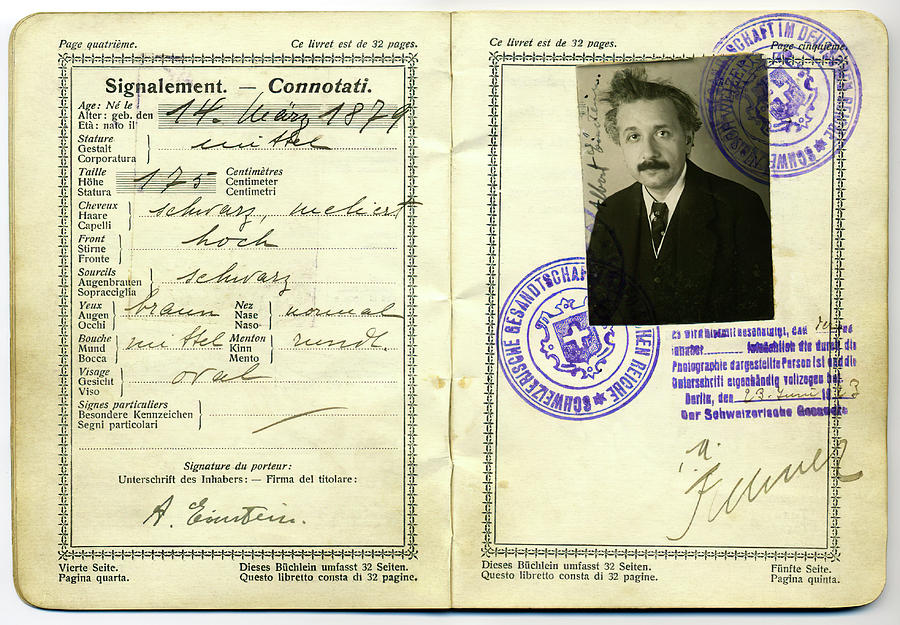
Suppose you want to estimate how tall Albert Einstein was. You ask a friend of yours, who suggests , though they have no particular reason to know.
doesn't sound unreasonable. Of course you're still very uncertain. Say you're sure your friend, like any random American, would guess Einstein's height within inches.
You'd like a more precise estimate, so you do a survey. You contact million people in the US and get them to estimate Einstein's height for you; the average of the survey responses is . You also visit the Library of Congress and Bern Historical Museum to find an immigration form and a Swiss passport giving his height as and (near ) respectively.
How tall do you think Einstein was? How confident are you?
Overcomplicating the problem with math
Let's formalize everything in a few equations. Call Einstein's height . From the survey, we have million estimates of the form where we assume the error has a standard deviation of inches (corresponding to the probability of being within inches we had above). For convenience, assume all the errors are normally distributed, though that's not essential to the qualitative argument. We couldn't predict whether would be too high or too low, so assume has mean zero.
We also have two estimates and from the Library of Congress and museum. The formal documents should be more reliable than an average person's guesswork. Let's assume their errors have a standard deviation of inches. With our assumption of normal distributions, that means being sure Einstein's passport had his height correct to within inch.
Blindly weighted averages
One more assumption and we'll be ready to calculate how tall Einstein is. Suppose all of our errors are independent, as is often assumed in meta-analyses of scientific studies. Then the standard best thing to do is take an average of the estimates with inverse variance (precision) weights; the new precision will be the sum of the previous precisions. Don't worry about the details; they aren't particularly important.
Using just your friend's guess, we'd estimate
The uncertainty there is standard deviation, i.e. half the width of a confidence interval. Using just the Library of Congress immigration form, we'd estimate To put them together, we give higher weight because it has smaller standard error. That leads to a combined estimate So far so good. We basically ignored the unreliable estimate from your friend in favor of the better one from the Library of Congress. I only included the mostly-meaningless extra digits to show there is a tiny change. I won't include them again.
The Swiss passport seems just as reliable as the immigration form, so they each get equal weight when averaged: That seems ok too.[1] What if we average in our survey responses in the same way? Our model is confident it knows Einstein's height to the nearest thousandth of an inch, around the diameter of a single skin cell or human hair. Its estimate is entirely based on the survey; the documents are basically ignored.
Oops.
Bayes and bias
Where did the analysis go wrong? We made many assumptions in setting up the statistical model. Several were suspect. To find a better set of assumptions, let's take two intuitions about the conclusions our inference method should draw.
- The first estimate from a friend would convey some information to an alien who had no idea how big people are.
- Once you have a few such estimates, adding a million more doesn't tell you much of anything.
The analysis above satisfies 1 but not 2. Throwing out all the survey responses because they must be biased satisfies 2 but not 1. Is there an approach in between those extremes?
The first thing we'll do is change to a Bayesian perspective. We didn't start totally ignorant about Einstein's height. We could either invent a prior distribution for that feels reasonable or look for references like this paper claiming the height distribution for European men born at the end of the nineteenth century has a mean of and standard deviation .
However, just adding a prior to the model above doesn't help at all. A standard deviation of is twice as small as the standard deviation we postulated for survey respondents, so the prior contributes the same amount to the posterior as four survey respondents out of million. It would be ignored too.
The more important change will be to restructure our model. Let's explicitly allow for the possibility that our survey responses are systematically biased by some amount :
Note the lack of subscript on . This isn't about unknown individual biases that average out to zero. We're trying to drop the assumption that an infinitely large survey would give us an infinitely precise estimate.[2]
Separately, let be the average height bias in government documents. To complete the model, we'll need to put priors on , , and the random errors. Suppose we arbitrarily decide that about half our uncertainty is due to systematic effects ( and ) and half is due to random errors that could average out (the ).[3]
Now, we conclude from the survey that We're still extremely confident in the survey outcome. But because we're acknowledging the possibility of bias, that no longer translates into confidence about Einstein's height. Instead, The survey adds moves us very little from our prior. Adding in the documents, we get That's what we would have concluded by throwing out the survey, but we didn't need to tell your friend their guess has no value in any circumstances.
Meta-analyses
After all, a good Bayesian should be able to say “Well, I got some impressive results, but my prior for psi is very low, so this raises my belief in psi slightly, but raises my belief that the experiments were confounded a lot.”
Scott Alexander, The Control Group is Out of Control
This post isn't really about Einstein. Meta-analyses that matter share the same potential problem we saw with height, that a sufficiently large quantity of not-very-good estimates can swamp better estimates.
Standard statistical approaches to meta-analysis, like Dersimonian and Laird with its 33000 citations, do nothing to allow for unknown bias that's consistent across studies.[4] This isn't necessarily wrong. If you don't have many studies and the statistical uncertainty is large, the possibility of bias may not affect your conclusions much. Or maybe you're CERN and you understand the noise in your experiment so well that you believe the ten digits of precision you might get.
Consider, however, observing the scientific study of a phenomenon from its beginning. First, an exploratory study comes out that suggests . It's soon followed by more small studies in favor of ; after a couple years, the literature has a huge number of studies generally supporting . Only a few have obvious fatal flaws. The rest appear to be reasonable, honest, small-scale efforts that individually wouldn't be too compelling. Eventually, someone does one more thorough and better-conducted study. Perhaps it's an RCT where the others were observational; perhaps the authors looked up Einstein's passport instead of surveying friends. It concludes not-.
Many people's belief in would go up a little with the first study, go up a bounded amount more as the field grows and continues to find , and then crash after the higher quality study regardless of how many low quality studies preceded it or how thoroughly they were critiqued individually. Adding a literature-wide bias term like we did above is a way to translate that qualitative thought process into a Bayesian meta-analysis.[5]
Importantly, with that approach you are not going through the studies and looking for specific causes of bias to model (as here, for example). Instead, you're acknowledging that even when you can't explicitly identify flaws your confidence in the study-generating process is finite. At the same time, you're not totally throwing out potentially-biased studies. You don't need to give up if no studies are perfect. You just increase your uncertainty.
When you read your next meta-analysis, consider how much you believe its implicit prior on the bias of the field as a whole. Please do keep in mind that this essay is descriptive more than prescriptive. The model discussed here won't always be appropriate; I am not dealing with any of the difficulties in when to use it or how to nail down the details; I've been quick and glib with making up priors. There will be more work to do in any particular case.
Perhaps a little overconfident. ↩︎
We implicitly assumed that when declaring errors to be independent. ↩︎
To me this feels generous to the survey. ↩︎
"Consistent across studies" is the important part here. Dersimonian and Laird do model bias in individual studies. Their method should give reasonable results if you treat the survey as one study with million samples rather than million studies. ↩︎
See here (paywalled) for a more formal writeup of a similar idea. It doesn't look widely used. ↩︎
6 comments
Comments sorted by top scores.
comment by gwern · 2022-03-15T22:15:55.085Z · LW(p) · GW(p)
(Older LWers will be familiar with this as E.T. Jaynes's "Emperor of China fallacy" from chapter 8.)
Replies from: one_forward↑ comment by one_forward · 2022-03-16T20:51:05.775Z · LW(p) · GW(p)
Thanks gwern! Jaynes is the original source of the height example, though I read it years ago and did not have the reference handy. I wrote this recently after realizing (1) the fallacy is standard practice in meta-analysis and (2) there is a straightforward better approach.
comment by [deleted] · 2022-03-16T00:35:53.679Z · LW(p) · GW(p)
To me the obvious 'gotcha' is that you should probably treat every measurement from the survey as having zero weight, or at least everyone who has not met Einstein in person, because there is no causal mechanism for them to have information about this value (no unique information I mean, not published in data samples you already considered previously). Huh, that also invalidates the efficient market hypothesis. (partially - it means that if most market participants have no source of information for their valuation of a security beyond information you could simply analyze with a rational model*, then the market price determined by the rational model is more likely, over the long term, to be the true price - not what the market votes it to be)
*some model that regresses between public financials disclosed and other information and predicted long term profits and revenue, and a second model that regresses between actual profits/revenue and long term securities value.
(EMH works fine if some actors have insider information or are using rational models, because they over time will have more and more of the shares of a given security as they systematically win and thus their votes count for greater and greater weight, converging on the true value of the security)
Replies from: one_forward↑ comment by one_forward · 2022-03-16T21:01:33.299Z · LW(p) · GW(p)
I see two reasons not to treat every measurement from the survey as having zero weight.
First, you'd like an approach that makes sense when you haven't considered any data samples previously, so you don't ignore the first person to tell you "humans are generally between 2 and 10 feet tall".
Second, in a different application you may not believe there is no causal mechanism for a new study to provide unique information about some effect size. Then there's value in a model that updates a little on the new study but doesn't update infinitely on infinite studies.
Replies from: gwern↑ comment by gwern · 2022-03-16T21:14:27.174Z · LW(p) · GW(p)
The approach I suggest is that you can model standard biases like p-hacking via shrinkage, and you can treat extremely discrete systematic biases like fraud or methodological errors (such as confounding which is universal among all studies) as a mixture model, where the different mixtures correspond to the different discrete values. This lets you model the 'flip-flop' behavior of a single key node without going full Pearl DAG.
So for example, if I have a survey I think is fraudulent - possibly just plain made up in a spreadsheet - and a much smaller survey which I trust but which has large sampling error, I can express this as a mixture model and I will get a bimodal distribution over the estimate with a small diffuse peak and a big sharp peak, which corresponds to roughly "here's what you get if the big one is fake, and here's what you get if it's real and pooled with the other one". If you can get more gold data, that updates further the switching parameter, and at some point if the small surveys keep disagreeing with the big one, the probability of it being fake will approach 1 and it'll stop visibly affecting the posterior distribution because it'll just always be assigned to the 'fake' component and not affect the posteriors of interest (for the real components).
You can take this approach with confounding too. A confounded study is not simply going to exaggerate the effect size X%, it will deliver potentially arbitrarily different and opposite signed estimates, and no matter how many confounded studies you combine, they will never be the causal estimate and they may all agree with each other very precisely if they are collecting data confounded the same way. So if you have an RCT which contradicts all your cohort correlational results, you're in the same situation as with the two surveys.
Replies from: None↑ comment by [deleted] · 2022-03-17T20:18:07.283Z · LW(p) · GW(p)
Just to simplify your approach to a non-mathematician, you're proposing not doing any information flow analysis but finding autonomously cases where an information input, like the opinion poll, is not adding any useful information. And you name one way to do this.
Fair enough but the problem is that if you do an information flow analysis - "does any causal mechanism exist where this source could provide information"? - you can skip considering the faulty information with 100% probability. Sheer chance can show a correlation using your proposed approach.