Data on forecasting accuracy across different time horizons and levels of forecaster experience
post by CharlesD · 2021-05-27T18:53:07.884Z · LW · GW · 0 commentsContents
  Key Points
  Background
  Data
  PredictionBook Analysis
    Brier Scores
    Updating
    Calibration
     Did practice make perfect?
  Metaculus Analysis
    Brier Scores
    Calibrations
  Future Work
  Appendix
    Data sources I looked into but did not find useful
    PredictionBook and Metaculus data extraction
    Samples for PredictionBook calibration plots
  Credits
None
No comments
Cross posted from the EA Forum [EA · GW]
Key Points
- Forecasting well is a valuable skill for many purposes and people, including for EA organisations aiming to identify which areas they should focus on and what the outcomes of various initiatives would be.
- There is a limited public record of people making scored forecasts over time horizons greater than ~1 year. Here I use data from PredictionBook and Metaculus to study performance of predictions over different time horizons. I also looked at performance between users with different levels of forecasting practice.
- When looking at individual predictors, it seems that a very common failure mode among newer or less dedicated predictors is overconfidence, and that it is more prevalent than underconfidence across most subgroups.
- Across both PredictionBook and Metaculus, there seemed to be a significant bias towards overestimating the chances of positive resolution. This effect seemed to get stronger as time to resolution increased.
- At least in the PredictionBook data, there was some weak evidence to suggest prediction performance improves with making more predictions, but there were too many confounding factors here to draw any confident conclusion.
- The conclusions I was able to draw from this were limited, and working to improve this by expanding the amount and quality of data available for analysis like this seems worth doing.
This post draws a lot on niplav's Range and Forecasting Accuracy [LW · GW], not least for much of the code used to extract the PredictionBook forecasts, and also in identifying the most promising sources of useful data.
I think that this post is probably most useful to individuals making forecasts being aware of common failure modes and attempting to learn from them, and informing decision makers about these failure modes also, rather than attempting to provide those looking to use forecasts with e.g. a transform they should apply to long term forecasts.
Background
There has been a great deal of interest in forecasting in the EA community in recent years, particularly with the prominence of longtermist thinking. It is clearly of great interest that we be well equipped to make predictions about future events, and to understand the accuracy and failure modes of such predictions. Additionally, many of the questions we care most about will have long time horizons, therefore any evidence we can gain which helps us become better at making better long term predictions in particular could be quite valuable (see also Muehlhauser, 2019).
Some potential tools for making longer term forecasts include:
- extrapolating from shorter term forecasts expected to be correlated to the long term question - this to an extent transforms the question to a different problem, that of forecasting which intermediate milestones might usefully predict our ultimate questions, and how well.
- assuming that those who are well calibrated in the short term will also do well in the long term, and using their forecasts.
The second point here is probably to a certain extent unavoidable, as most forecasters will get few totally independent iterations of making long term forecasts in their lifetimes. One could potentially make hundreds of 10 year predictions now, but lessons cannot be drawn directly from these for 10 years, and if the wrong lessons are learned, it could take another 10 year iteration to realise that. In addition, these hundreds of forecasts may not be independent. I think many forecasts made over longer time horizons will be subject to errors from the same sources, due to society wide effects such as, for example, rates of economic and technological development, a more/less peaceful climate for international relations, or other large scale effects. I would expect many predictions made on a range of topics in 2015, for example, to be affected by the pandemic.
There is some evidence that forecasting skill generalises across topics (see Superforecasting, Tetlock, 2015 and for a brief overview see here) and this might inform a prior that good forecasters in the short term will also be good over the long term, but there may be specific adjustments which are worth emphasising when forecasting in different temporal domains.
This suggests the question of how much correlation there really is between how good a forecaster is at short term forecasts and how good they are at long term forecasts is important to investigate. It also suggests the related questions of how good long term forecasts in general tend to be, and what the best methods for them are.
I look at two main issues in this piece:
- Predictor performance: How does prediction performance vary with frequency of making predictions? Are there any other tendencies (e.g. frequently updating predictions) which are common among better forecasters? Do forecasters do better with more practice?
- Effects of time horizons: How does performance vary over different time horizons? Does this vary for better forecasters?
Unfortunately, there are very few public forecasting resources with data available over >1 year time horizons, let alone >10 years. What data I did find was mostly on medium range forecasts (1-10 years, weighted more heavily to the shorter end of that spectrum). There were still interesting results to be found, which could plausibly generalise to even longer time horizons.
Data
Much of forecasting in the public domain is done via competitions, or on prediction markets, both domains where participants are interested in getting feedback quickly if possible, either for reasons of short attention spans, to qualify for superforecaster status (in the case of Good Judgement Open), or to avoid locking up capital for extended periods of time (in the case of markets).
Two sources which ultimately proved useful were PredictionBook and Metaculus. From niplav (2020) [LW · GW]:
PredictionBook and Metaculus are both forecasting websites for hobbyists. They are not prediction markets, but rather function on the base of merit and track records.[...]
However, both sites differ in their approach to writing questions and judging and scoring forecasts. PredictionBook is much older than Metaculus: the former was first released in 2008, the latter started in 2015. It is also much less formal than Metaculus: it doesn't require stringent resolution criteria, making possible for everybody to judge a question (unrelated to whether the person has even made a prediction on the question themselves!), while Metaculus requires a short text explaining the context and resolution criteria for a question, with the questions being resolved by moderators or admins. This leads to Metaculus having fewer questions than PredictionBook, but each question having more predictions on it.[...]
Another significant difference between these two websites is the amount of data they publish: PredictionBook shows every single forecast made, while on Metaculus one can only see the community forecast (a time-weighted median of the forecasts made on the question). This is relevant for this analysis.
Metaculus keeps track of its best predictors (per its own scoring system) on a public rankings page, and also runs some competitions with prizes. Due to the self-judging system and lack of user rankings or prizes, the incentives on PredictionBook are somewhat weaker. This might lead to less accurate forecasts.
For my purposes, PredictionBook proved to have the most useful data, going back 13 years with large numbers of resolved questions with >5 year time horizons, while Metaculus had few resolved questions with that kind of range, and the inability to extract individual data. This post will mostly discuss lessons from the PredictionBook forecasts.
From PredictionBook, I extracted 47,548 predictions from 1,846 unique users on 14,033 questions.
Most predictors made few predictions - 615 made just one prediction, and another 545 made fewer than five. Most of the predictions on the site came from power users - 32,204 predictions (68% of the total) came from the 76 users with over 100 predictions, and 4,301 of these came from just one user.
There were 36,248 predictions over a <1 year time horizon, 7,081 with a 1-3 year time horizon, 2,850 with a 3-5 year time horizon and 1,369 with a greater than 5 year time horizon.
From Metaculus I got data from 798 resolved binary questions. The data was in the form of a time series with up to 101 approximately evenly spaced entries, with questions with fewer than 101 entries having one entry per prediction. The entries represented the “community prediction” at a given point in time, which itself is a recency weighted analogue of the median of user predictions. In my subgroup analyses, to avoid overweighting questions with more entries, I used the mean value for each question’s community prediction over the set of times when it qualified for the specified subgroup. As a result many questions appear in multiple subgroups at different stages in their question lifetime.
PredictionBook Analysis
Brier Scores
The Brier Score is a scoring rule for probabilistic forecasts. It is equivalent to the mean squared error of forecasts for binary forecasts, so a lower score is better.
More predictions by an individual predictor were associated with better Brier scores, and this looked to be independent of question duration.
| N | μPreds | μQs | μDuration | μBrier | μE[Brier] | Overconfidence |
Preds |
|
|
|
|
|
|
|
1 | 615 | 1.00 | 1.00 | 325.19 | 0.245 | 0.130 | 47.8% |
2-4 | 545 | 2.65 | 2.52 | 299.54 | 0.228 | 0.133 | 38.8% |
5-10 | 258 | 6.80 | 6.27 | 349.06 | 0.212 | 0.134 | 31.2% |
11-25 | 182 | 16.59 | 15.31 | 337.99 | 0.190 | 0.138 | 22.2% |
26-100 | 170 | 50.02 | 45.15 | 334.68 | 0.167 | 0.138 | 11.2% |
100+ | 76 | 423.73 | 319.01 | 333.20 | 0.153 | 0.135 | 5.6% |
Shorthands to make the table fit: N=the number of predictors in the set, μ=the value is the mean of that variable for the set, Preds=predictions, Qs=unique questions predicted on, Duration=time from prediction to resolution in days, others explained below
Note that just guessing 50% on all questions would by definition yield a Brier score of 0.25, and guessing randomly from [0,1] would yield a Brier score of 0.33, so the infrequent predictors did better than chance but not much better than a position of agnosticism. Across the bottom 3 groups on average 41% of questions resolved positively - guessing 41% on every question would have scored a Brier of 0.242, slightly outperforming both the 1 prediction group and the guessing 50% strategy. See the Calibration section below for further discussion of this “naive prior”.
E[Brier] is the Brier score you would expect if the predictors were perfectly calibrated. It is quite similar across subgroups, as is average question duration. I include it to check if subgroups were typically making more or less confident predictions on average - more confident predictions would have a lower E[Brier].
That E[Brier] values were similar between groups while actual Briers were not suggests that less frequent predictors either (i) were less informed about questions of a similar calibre of difficulty, or (ii) were asking more difficult questions and were not appropriately less confident.
Overconfidence here is the same formula used by Metaculus for overconfidence,

where p(r_i) is the probability given for the resolution which occurred - e.g. for a 10% prediction of something which ultimately indeed didn’t happen, p(r_i) is 90%.
From Metaculus:
The over- (or under-)confidence score shows how much the predictions would need to be rescaled in order to optimize the average Brier score. An overconfidence score of 100% means that the predictor would have been better off predicting 50% for each question, and an overconfidence of 200% means that the predictor would have better off making the opposite prediction for each question.
This has the property that scaling a set of predictions by this value (which translates to moving an x% overconfident prediction x% of the way to 50%) would minimise the Brier score of the set. Scaling the predictions above we get:
| μBrier | μE[Brier] | μScaledBrier |
NumPreds |
|
|
|
1 | 0.245 | 0.130 | 0.220 |
2-4 | 0.228 | 0.133 | 0.209 |
5-10 | 0.212 | 0.134 | 0.199 |
11-25 | 0.190 | 0.138 | 0.184 |
26-100 | 0.167 | 0.138 | 0.165 |
100+ | 0.153 | 0.135 | 0.152 |
From this it appears only a small fraction of the group inaccuracy can be explained by the group level overconfidence. It also shows that after accounting for overconfidence it is quite clear that there was some informational content in the predictions of those with 1 prediction, and novice predictors could plausibly improve significantly if equipped with the knowledge that new predictors tend to be overconfident.
There was substantial within group variation in overconfidence in the 26-100 and over 100 predictions groups, which were the only groups with sufficient predictions per user to get reasonable per user overconfidence values. Few predictors were underconfident. The median user overconfidence in both cases was lower than the group level overconfidence, which was lower than the mean user overconfidence.

Over different time horizons, all of Briers, E[Brier]s and overconfidence decreased, which is a surprising result which niplav (2020) [LW · GW] also found.
| μBrier | μE[Brier] | Overconfidence |
TimeHorizon |
|
| |
<1 year | 0.162 | 0.138 | 10.4% |
1-3 years | 0.162 | 0.139 | 10.4% |
3-5 years | 0.149 | 0.126 | 9.3% |
5+ years | 0.140 | 0.118 | 8.2% |
There are clear differences here in the last two groups, with scores getting better as time horizons got longer. Are there clear differences in who was answering these questions?
It doesn’t look like there are big enough differences to matter here to me.
One very plausible explanation for the lower Brier scores on longer term questions is Simpson’s paradox. This is the phenomenon that while two features are correlated in a dataset, it can be true that the features are negatively correlated for some distinct subsets of the dataset. Here that would mean that time to resolution is negatively correlated with accuracy within questions, but between questions difficulty differences or other considerations have a larger effect. See niplav [LW · GW]for some further discussion of this and evidence that this is occurring here.
See the calibration section for more discussion of some potential explanations for this and the overconfidence scores.
Updating
Few users updated their predictions, and updating was not associated with lower Brier scores overall, though there was not enough data to infer much here. Of 9230 updates, 3141 (34%) were performed by the most frequent individual predictor and 4710 (51%) were due to the top 3 most frequent updators.
Calibration
There were two main axes I was interested in looking at calibrations: (i) are more frequent predictors better calibrated as a class? and (ii) how does calibration vary over time horizons?
First, by user group:

See appendix for sample sizes
The most interesting thing here to me is the two least frequent predictor groups dropping off significantly past the 70% range. Events they predicted to occur 80-90% of the time were only happening 50-60% of the time! And in general, predictions in the top half of the distribution looked more overconfident than those at the bottom.
How did this vary over time?
See appendix for sample sizes
What happened here? It looks quite clear that, particularly over longer time periods, things just did not happen as often as expected. This is different to overconfidence as defined above, in that when making <50% predictions, predictors were actually underconfident.
Why might this be?
A possible partial explanation is base rate neglect. A majority of the PredictionBook questions were of the form "will X happen?" for some event X. In some cases, a predictor made multiple questions in an attempt to cover all possible outcomes, as so:

The oil price has to be something, so a predictor here cannot be overconfident on every question unless they don’t check that their predictions add up to approximately 100%. From spot checking a few of these collections of questions it appears the predictors typically do make them add up to close to 100%.
Far more common, however, were individual propositions that something would happen. For example:
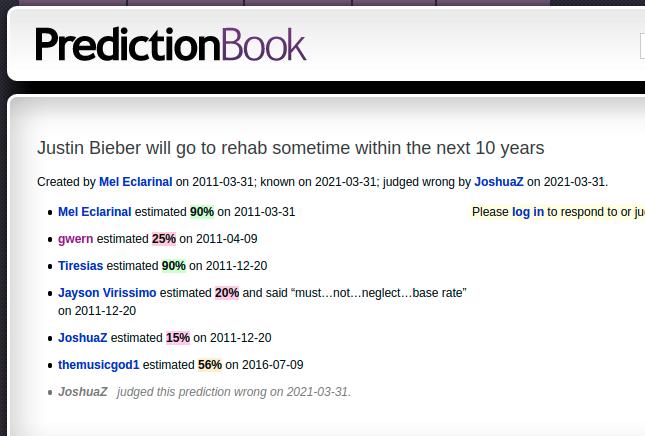
Perhaps Jayson’s advice here is more universal than one might think at first glance.
These seem to me like questions where base rate neglect is potentially an issue. Over longer time horizons, predictors may be reluctant to give low probabilities to plausible sounding hypotheses. I have experienced this myself when arriving at a prediction of sub 10% for something which seems plausible to me; I have quite a bit of reluctance to go to the very confident ends of the scale when there is a long time to resolution, though I don’t have a good story for why this might be asymmetric.
Another possibility is that people had the wrong naive prior on questions where they relied on it. One might assume that on an unknown proposition a reasonable prior is 50%, but from this article it appears a reasonable prior on Metaculus questions would have been 29%, as of late 2019. The current prediction on the question “Will the 1000th binary Metaculus question resolution be positive?” is 39%. If for some reason predictors were more likely to fall back on naive priors on longer term questions, then this might explain the phenomenon we see.
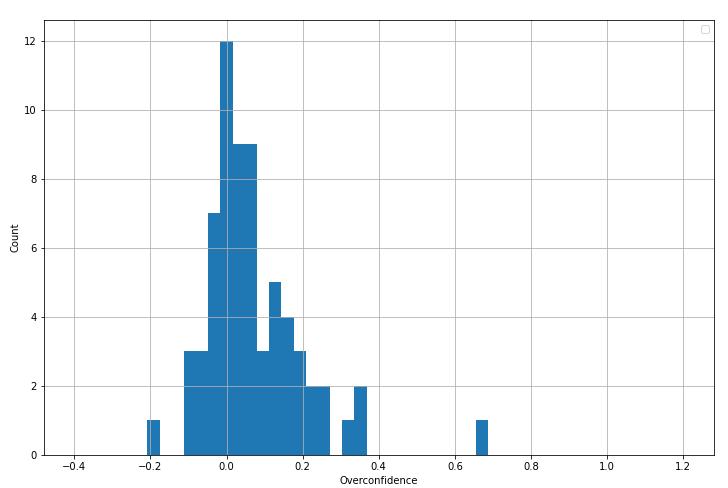
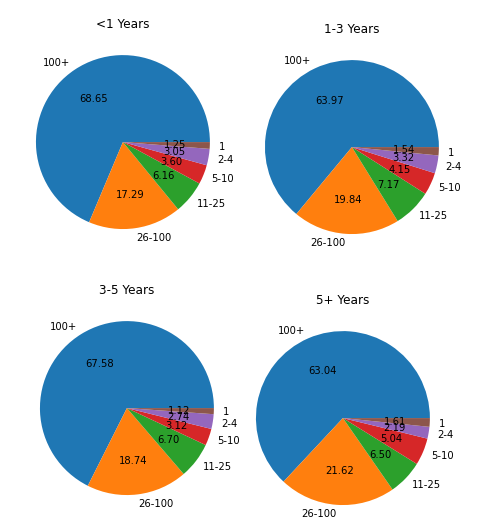
Weak evidence suggests this is not the case, however. Here are histograms of predictions for each time horizon:
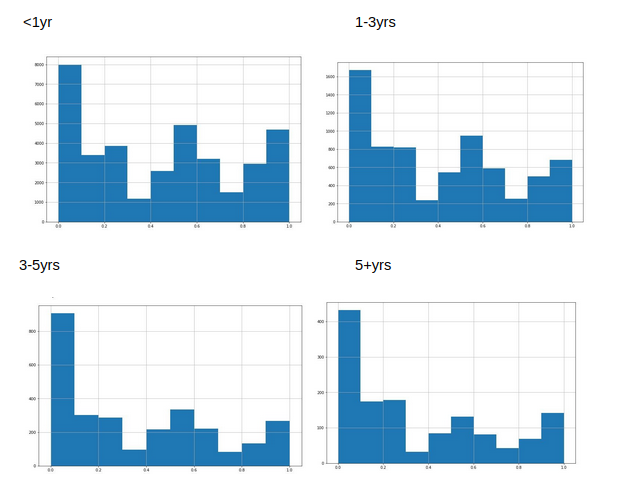
It appears that if anything, there are fewer high predictions and a smaller proportion of 50% predictions for long range questions. I suspect this is down to the type of questions asked, I don’t really see any other plausible reason for it. This also explains the lower overconfidence scores over longer time horizons - if people frequently predicted things wouldn’t happen, and things happened even less often than predicted, that would lower overconfidence scores.
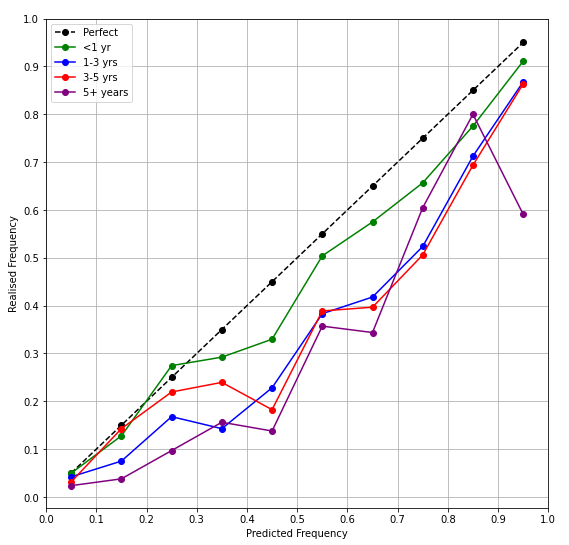
How did this vary by predictor?
For >1 year:

See appendix for sample sizes. Note there were very small samples for <5 and 5-10 in the 40-60% range.
Here I grouped those with 4 or fewer predictions together as the samples were quite small. It seems these predictors with 4 or fewer predictions were particularly bad at predicting >60% on >1 year time horizons, but all groups still made the same error.
Can we do much with this information? Is there a nice transform we could apply to a long range prediction such that we could yield well calibrated predictions from these?
I split the data in half, keeping only those forecasters with 25+ forecasts for prediction quality reasons, and fit a linear transform on each time range group. I applied this to the predictions of the other half and got the following calibration graph:

Note that the transform never made high predictions at long ranges due to negative intercepts.
The models were:
<1y: 0.9400*Prediction - 0.0154
1-3y: 0.9122*Prediction - 0.1066
3-5y: 0.8927*Prediction - 0.0837
5+y: 0.8587*Prediction - 0.1089
The intercepts clustering around -10% on longer term questions is a little curious, as are the monotonic decreases in the slopes as time to resolution gets longer, but I think these should be taken with a pinch of salt, as besides the <1 year group they don’t look super well calibrated to me. I think this is just a rough quantification of what direction predictors were wrong in, and don’t have new concrete takeaways from this.
Did practice make perfect?
I wanted to look into whether forecasters appeared to get better over time. For this, I took those forecasters with >100 predictions, and compared their performance on their first 50 predictions to their last 50.
The answer appeared to be "maybe". There was no improvement in Brier scores or over confidence, but it is possible that they may have tried to predict more difficult questions in their later questions
First 50 |
|
| Last 50 |
|
|
μBrier | μE[Brier] | OverConf | μBrier | μE[Brier] | OverConf |
| 0.153 | 0.137 | 7.0% | 0.156 | 0.135 | 7.9% |
To test the “more difficult questions” hypothesis, I tried to compare frequent predictors to all other predictors on both sets of questions, and here it did look like their relative performance had improved notably. For all predictors on those same questions:
First 50 |
|
| Last 50 |
|
|
μBrier | μE[Brier] | OverConf | μBrier | μE[Brier] | OverConf |
| 0.147 | 0.126 | 9.5% | 0.156 | 0.124 | 13.4% |
They went from slightly worse Briers and slightly less underconfident, to identical Briers and much less overconfident. I am not sure how much credence to put in this difference.
One reviewer suggested that maybe 50 was too many, and that many of the most useful lessons of predicting could be learned within the first 10 predictions, and that perhaps this was masking any improvement. From this suggestion I took all users with at least 50 predictions, and compared their 11th-50th predictions to their first 10:
First 10 |
|
| 11th-50th |
|
|
μBrier | μE[Brier] | OverConf | μBrier | μE[Brier] | OverConf |
| 0.159 | 0.140 | 9.0% | 0.153 | 0.134 | 8.1% |
For all predictors on those same questions:
First 10 |
|
| 11th-50th |
|
|
μBrier | μE[Brier] | OverConf | μBrier | μE[Brier] | OverConf |
| 0.145 | 0.130 | 9.2% | 0.142 | 0.122 | 8.7% |
While they appeared to improve slightly more than the control here, it seems hard to say the improvement was definitely meaningful. I also have concerns about doing multiple comparisons here due to forking paths considerations.
As an aside, and possibly an explanation for these weak findings, it's likely that many of these predictors had some practice prior to PredictionBook and were not starting from scratch, and it is also the case that many of their first 50 predictions would not have been resolved by the time their last predictions were made.
Metaculus Analysis
For the Metaculus data I could glean less information, as there were fewer questions, and no user level data available. From the information available, I focused on comparing performance across different time horizons rather than also comparing different groups of users. I used the “community prediction”, which is a recency weighted median of individual user predictions.
Brier Scores
| μBrier | μE[Brier] | Overconfidence |
Time Horizon |
|
|
|
<1 year | 0.151 | 0.172 | -0.285 |
2-4 | 0.167 | 0.193 | -0.330 |
5-10 | 0.169 | 0.192 | -0.310 |
A surprising result perhaps - the aggregate of Metaculus users was actually quite underconfident. As we can see from the E[Brier] values, there were fewer extreme predictions over long time horizons. Let’s look at calibrations:
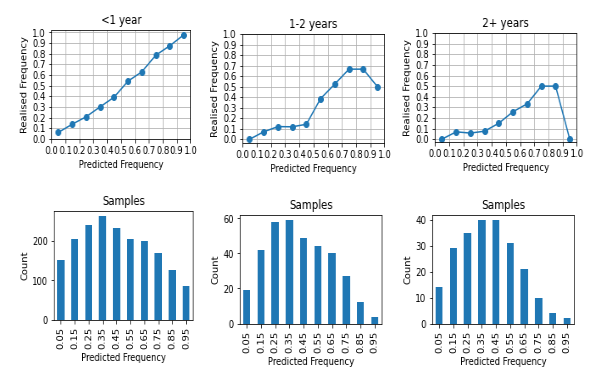
Calibrations
We see a very well calibrated graph for predictions with <1 year time horizons, before the graph starts to sag as horizons get longer, and as with PredictionBook, things just don’t seem to happen as often as predictors imagine. Note that the samples for various bins here add up to far more than the number of questions - this is because many questions spent time in several of these bins at one point or another throughout their lifetimes A question was included in a bin if it spent any time in it after there were at least 3 predictions on the question. The top bins in the 1-2 year and 2+ year sets also have quite a low sample, so I would hesitate to draw too much from them. In the 2+ year set both questions in the 90% bucket were at 90% plus very early in their question lifetime, but only very briefly.
This also means that the bins are not independent samples either, and due to the nature of the community prediction a prediction would typically have to spend some time in intermediate bins en route from one bin to another.
These graphs provide an explanation for the overconfidence data - more predictions than not were on the lower end of the 0-100% range, and therefore predicted things were mostly expected not to happen, and even fewer things actually happened than expected.
Future Work
A key takeaway I think is that there is not a lot of data out there about the performance of predictors over longer time horizons.
Metaculus has quite a lot of questions with longer time horizons up now, but the more such data there is, the more likely it is we will be in a better position to study these questions a few years down the line.
Attempting to control for the difficulty of questions seems particularly useful. In practice, the difficulty of a question is not easily established before the fact, but making sets of questions that are on common topics or otherwise similar might be a good starting point here.
I have a question [EA · GW] soliciting long term questions people are interested in seeing predictions on up now on the EA Forum. I expect to take some of these and post them to Metaculus.
In a few years it should be possible to have more long term data on these and existing questions from Metaculus. If others are able to identify any other promising sources of data these could potentially be worth exploring too.
The user level data on Prediction Book could potentially yield other useful insights if investigated further.
Appendix
Data sources I looked into but did not find useful
I looked into using data from multiple sources in addition to PredictionBook and Metaculus, including Good Judgement Open, Hypermind, PredictIt and Polymarket. Of these other sources, PredictIt was the only source with numerous long term questions, but I decided they were unlikely to be useful, as the majority of questions with >1 year duration were of the form “Will [Person X] run for president in [Year]?”, many of which had quite low probabilities which I thought were heavily subject to market distortion.
I could not find an easy way to get question metadata from Hypermind or GJO, but looking through their questions manually there seemed to be few questions with longer durations.
PredictionBook and Metaculus data extraction
I used a variation on the code from Range and Forecasting Accuracy [LW · GW] by niplav to extract the PredictionBook data, and the ergo python package for the Metaculus API to extract the Metaculus data. Metaculus data is in the form of a json with multiple time series within it - I used the 'prediction_timeseries' time series which appeared to be evenly spaced over the question duration, but I am not sure what the differences between the various time series’ are.
Metaculus, in addition to the binary questions I looked at here, also has several hundred resolved continuous forecasts. I didn’t use those here as I was mainly focused on comparing the Metaculus to PredictionBook data and focusing on binary questions made this easier.
Python notebooks containing the code I used for this piece can be found here. Please feel free to contact me if you want any further information on this.
Samples for PredictionBook calibration plots
Fig. 4
| P | 0.05 | 0.15 | 0.25 | 0.35 | 0.45 | 0.55 | 0.65 | 0.75 | 0.85 | 0.95 |
| NPreds | ||||||||||
| 1 | 64 | 19 | 26 | 24 | 6 | 9 | 25 | 53 | 41 | 69 |
| 2-4’ | 186 | 46 | 77 | 36 | 17 | 26 | 69 | 79 | 54 | 116 |
| 5-10 | 255 | 48 | 104 | 40 | 18 | 31 | 61 | 100 | 71 | 156 |
| 11-25 | 502 | 102 | 242 | 78 | 59 | 74 | 132 | 184 | 115 | 242 |
| 26-100 | 1455 | 398 | 555 | 230 | 192 | 303 | 336 | 389 | 278 | 608 |
| >100 | 5590 | 1974 | 2386 | 1128 | 1455 | 1792 | 1415 | 1078 | 973 | 1789 |
Fig. 5
| P | 0.05 | 0.15 | 0.25 | 0.35 | 0.45 | 0.55 | 0.65 | 0.75 | 0.85 | 0.95 |
| Duration | ||||||||||
| >1y | 5683 | 1948 | 2593 | 1170 | 1316 | 1760 | 1562 | 1503 | 1219 | 2435 |
| 1-3y | 1303 | 413 | 530 | 238 | 276 | 321 | 323 | 254 | 226 | 340 |
| 3-5y | 729 | 147 | 164 | 96 | 126 | 126 | 121 | 83 | 62 | 139 |
| 5+y | 337 | 79 | 103 | 32 | 29 | 28 | 32 | 43 | 25 | 66 |
Fig. 7
| P | 0.05 | 0.15 | 0.25 | 0.35 | 0.45 | 0.55 | 0.65 | 0.75 | 0.85 | 0.95 |
| NPreds | ||||||||||
| <5 | 65 | 15 | 25 | 10 | 5 | 7 | 18 | 29 | 19 | 40 |
| 5-10 | 79 | 10 | 36 | 14 | 3 | 3 | 13 | 21 | 10 | 30 |
| 11-25 | 186 | 38 | 68 | 20 | 14 | 16 | 28 | 50 | 27 | 44 |
| 26-100 | 527 | 116 | 151 | 60 | 57 | 69 | 67 | 74 | 59 | 134 |
| >100 | 1512 | 460 | 517 | 262 | 352 | 380 | 350 | 206 | 198 | 297 |
Fig. 8
| P | 0.05 | 0.15 | 0.25 | 0.35 | 0.45 | 0.55 | 0.65 | 0.75 | 0.85 | 0.95 |
| Duration | ||||||||||
| >1y | 2490 | 940 | 1111 | 517 | 619 | 843 | 668 | 612 | 520 | 997 |
| 1-3y | 551 | 192 | 216 | 111 | 119 | 148 | 130 | 93 | 96 | 132 |
| 3-5y | 324 | 73 | 74 | 39 | 57 | 57 | 60 | 34 | 31 | 60 |
| 5+y | 155 | 31 | 49 | 17 | 14 | 13 | 16 | 17 | 8 | 28 |
Credits
This essay is a project of Rethink Priorities.
It was written by Charles Dillon, a volunteer for Rethink Priorities. Thanks to Linch Zhang, Peter Hurford, Michael Aird, David Rhys Bernard, Sylvain, Ozzie Gooen and Nuño Sempere for advice and feedback on this post. If you like our work, please consider subscribing to our newsletter. You can see all our work to date here.
0 comments
Comments sorted by top scores.