Forecasting Frontier Language Model Agent Capabilities
post by Govind Pimpale (govind-pimpale), Axel Højmark (hojmax), Jérémy Scheurer (JerrySch), Marius Hobbhahn (marius-hobbhahn) · 2025-02-24T16:51:32.022Z · LW · GW · 0 commentsThis is a link post for https://www.apolloresearch.ai/blog/forecasting-frontier-language-model-agent-capabilities
Contents
  Executive summary
  Motivation
    Forecasting LM agent capabilities is important
    Previous approaches have some limitations
  Methodology
  Predictions
    Results
  Limitations
  Conclusion
None
No comments
This work was done as part of the MATS Program - Summer 2024 Cohort.
Paper: link
Website (with interactive version of Figure 1): link
Executive summary
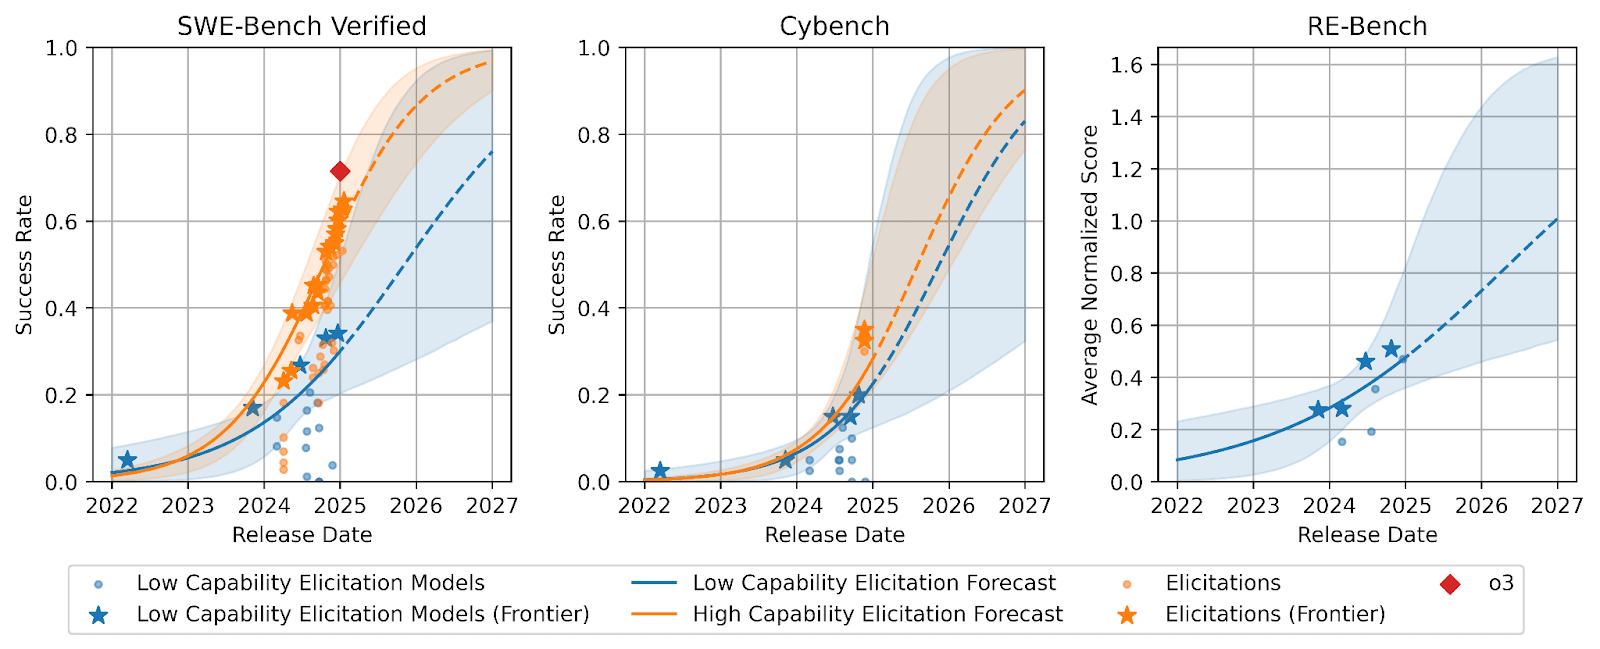
Figure 1: Low-Elicitation and High-Elicitation forecasts for LM agent performance on SWE-Bench, Cybench, and RE-Bench. Elicitation level refers to performance improvements from optimizing agent scaffolds, tools, and prompts to achieve better results. Forecasts are generated by predicting Chatbot Arena Elo-scores from release date and then benchmark score from Elo. The low-elicitation (blue) forecasts serve as a conservative estimate, as the agent has not been optimized and does not leverage additional inference compute. The high-elicitation (orange) forecasts use the highest publicly reported performance scores. Because RE-Bench has no public high-elicitation data, it is excluded from these forecasts.
- We want to forecast frontier LM agent capabilities, i.e., the best-performing agent at any given point in time.
- We compare six forecasting approaches that predict downstream capabilities of LM agents.
- We use “one-step” approaches that predict benchmark scores from an input variable like compute or model release date and “two-step” approaches that first predict an intermediate capability metric like Observational Scaling Laws' PC-1 or Chatbot Arena Elo.
- We evaluate our forecasting methods by backtesting them on a dataset of 38 LMs from the OpenLLM v2 leaderboard.
- We then use a competitive two-step approach (Release Date→Elo→Benchmark) to predict LM agent performance for frontier models on three benchmarks: SWE-Bench Verified (software development), Cybench (cybersecurity assessment), and RE-Bench (ML research engineering).
- Our forecast predicts that by the beginning of 2026, non-specialized LM agents with low capability elicitation will reach a success rate of 54% on SWE-Bench Verified, while state-of-the-art LM agents will reach an 87% success rate.
- Important limitation: Our approach does not account for recent advances in inference-compute scaling. Thus, some of the authors think our estimates are too conservative.
Motivation
Forecasting LM agent capabilities is important
Language Model (LM) agents combine large language models with software (often called scaffolding) to execute tool calls and help the LLM operate autonomously over multiple steps without direct human intervention. As these agents become increasingly capable of operating independently in the real world, forecasting their capabilities becomes crucial for understanding and preparing for their societal and economic impact.
Previous approaches have some limitations
Good prior work on LM forecasting exists, e.g., Observational Scaling Laws and SLOTH. However, previous approaches have two limitations that we try to improve on with this paper.
- They don’t focus on the frontier. Other approaches often predict the average performance of future models. We aim to predict the frontier, i.e., the best LM agent performance at any given point in time.
- Data availability. Previous approaches often rely on specific information about the model being available, e.g., training compute or benchmark performance with comparable prompting. We compare multiple approaches, some of which use release date and Chatbot Arena Elo, which are often publicly available for frontier models.
Methodology
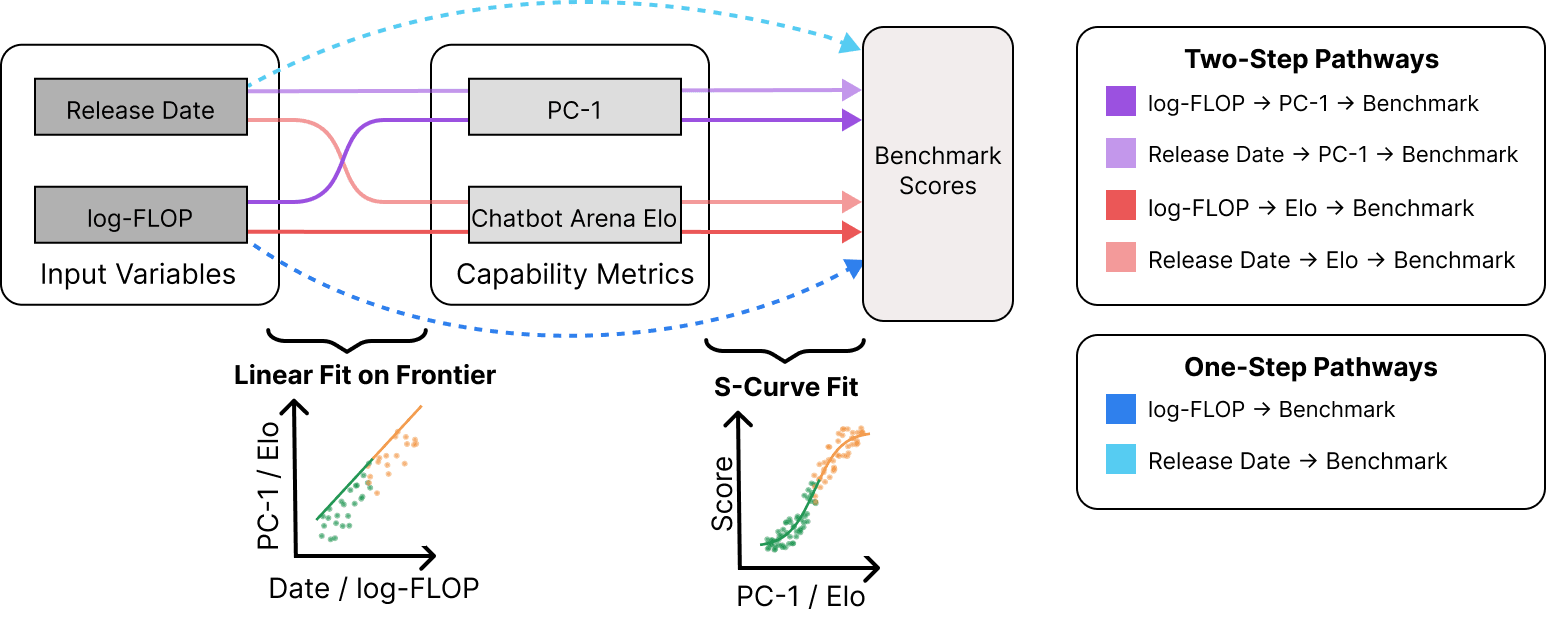
Figure 2: Six approaches for predicting frontier LM capabilities. Two direct methods (blue pathways) model benchmark performance as a sigmoid function of either release date or compute (log-FLOP). Four two-step methods (red and purple pathways) first use a linear function to predict intermediate capability metrics (PC-1 or Chatbot Arena Elo) from input variables, then map these metrics to benchmark scores using a sigmoid function
Our forecasting methodology distinguishes between three types of variables:
- Input variables: These are broad and general quantities that we expect to have predictive power for downstream performance. In the paper we use
- log-FLOP: The compute used for the pre-training of the model.
- Release date: The date that the model was released for public use.
- Intermediate capabilities: These metrics aim to capture the model's latent capabilities. In this paper we consider two intermediate capability variables:
- PC-1: Observational Scaling Laws show that the first principal component of a PCA on benchmarks explains around 80% of the variance in benchmark scores. The PCA is applied to a model × benchmark table. PC-1 can be used as a measure of general capabilities and is predictive across a wide variety of tasks.
- Elo: Chatbot Arena is a platform that assigns Elo ratings (similar to chess rankings) to LLMs based on human evaluations. Users compare responses from two models and indicate which they prefer, with these preferences used to calculate each model's relative rating score.
- Target benchmarks: These are measures of downstream performance, i.e., of the benchmarks we ultimately care about. In this paper, we use SWE-Bench Verified (software development), Cybench (cybersecurity assessment), and RE-Bench (ML research engineering).
Using these variables, we evaluate six different forecasting approaches (Figure 2):
- Two "one-step" approaches that directly predict benchmark performance as a sigmoid function from input variables.
- Four "two-step" approaches that first predict intermediate capabilities (with a linear function from input variables) and then use those to forecast target benchmark performance from the intermediate capabilities using a sigmoid function.
Predictions
To identify the most effective forecasting approach, we systematically evaluated six methods through backtesting on the Open LLM Leaderboard v2 dataset, using 38 models on six benchmarks.
These backtesting results combined with data availability informed our choice to use the Date→Elo→Benchmark approach for our main forecasts.
Results
Our forecasts extend to early 2027, as shown in Figure 1. For SWE-Bench, we leverage the results of 17 models tested with our simple scaffold and additional results from public leaderboards showing high-elicitation performance. By January 2026, we forecast that models using basic scaffolding will achieve a 54% success rate on SWE-Bench, while models with optimized scaffolding may reach 87%. However, these predictions are conservative, as they don't account for potential improvements through increased test-time compute scaling.
Our forecast suggests that Cybench scores will be 55% and 66% in January 2026 for low and high-elicitation efforts, respectively. Cybench shows a narrower gap between elicitation levels, which likely reflects the limited attention given to optimizing Cybench's performance thus far.
For RE-Bench, we forecast a score of 0.73 by January 2026 under low elicitation. Given METR's acknowledgment of minimal elicitation efforts in their testing, we focus only on low-elicitation predictions for this benchmark.
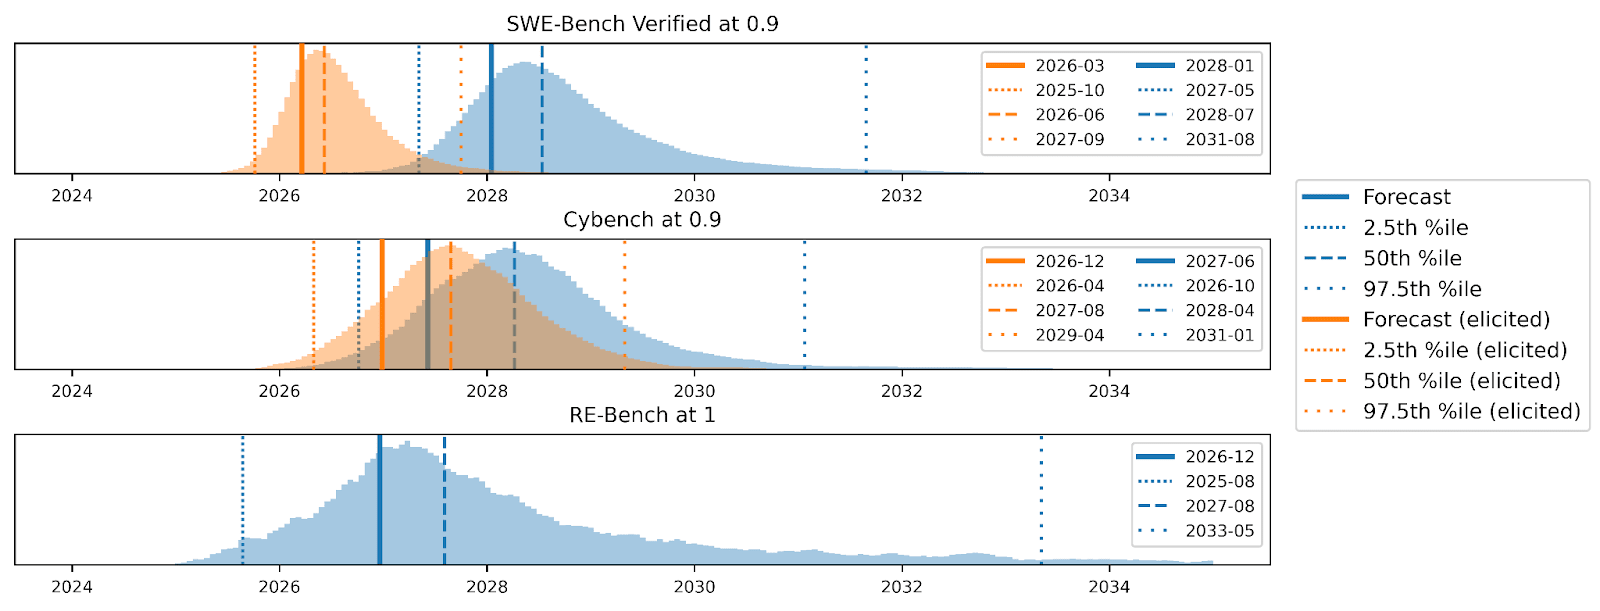
Figure 3: Predictions for a 0.9 success rate on SWE-Bench Verified and Cybench and a score of 1 on RE-Bench for low and high elicitation, respectively. We compute the distribution using bootstrapping with 10,000 samples. Note that these histograms' medians (50th percentile) do not necessarily equal the forecasts made with all data points in Figure 1.
To better understand when models might reach significant capability thresholds, we analyze the time required to reach specific benchmark scores (Figure 3, Figure 5 in paper). For SWE-Bench and Cybench, we chose 90% as an indicator of strong performance, while for RE-Bench we define a score of 1.0, matching the expert-level performance baseline. With high elicitation, we expect SWE-Bench to reach the 90% threshold around March 2026 (with a 95% confidence interval spanning from October 2025 to September 2027), while basic scaffolding pushes this milestone to January 2028. For Cybench, high-elicitation scaffolds are predicted to reach 90% by December 2026 (95% CI: April 2026 to April 2029), with standard elicitation following in June 2027.
The RE-Bench forecast suggests models will reach expert-level performance (score of 1.0) around December 2026, though with substantially higher uncertainty (our 95% confidence interval spans over eight years, from August 2025 to May 2033).
Limitations
We identify four important limitations of our approach
- Paradigm changes: While this paper does not make any explicit assumptions about the training paradigm of any particular model, we fit almost all predictions on models that were trained with the “pre-training scaling” paradigm, where the primary driver for downstream performance was improvements in pre-training. While we do include a scaffold that uses o1 as a high elicitation datapoint, all other models do not use inference time computing. With the new “inference scaling” paradigm where more resources are spent on "post-training scaling" (e.g. with Reinforcement Learning on agentic tasks), models can use their increased inference compute more effectively. This plausibly means even our high-elicitation predictions are too conservative.
- Under-elicitation: We didn’t put a lot of effort into agent elicitation. Therefore, we added the high-elicitation forecast based on publicly available efforts. However, we expect that there are many plausible improvements in elicitation (see Measuring Automated Kernel Engineering).
- Small sample size: Unfortunately, almost by definition, there are only a small number of frontier models. Therefore, our predictions have a small sample size. This is partially mitigated by using the two-step methodology and independently predicting the intermediate capability variable. However, we think the small sample size should imply large uncertainty about our forecasts.
- Limited scope of evaluations: The benchmarks we consider focus primarily on software engineering, cyber capabilities, and machine learning engineering. Noteworthy other agent benchmarks include GAIA and OS-World for browsing and tool use, as well as MLE-Bench for additional machine learning capabilities and SWE-Lancer for more realistic software engineering tasks (with assigned monetary values).
Conclusion
There are three primary novel contributions from our paper:
- We focus on predicting frontier performance instead of average performance.
- We use data that is different from previous work, e.g., Elo as an intermediate variable and release date as an input. Compared to using compute, this allows us to use publicly available information about frontier models to make forecasts.
- We focus on benchmarks specifically designed for LM agents, while previous work has often focused on QA benchmarks.
We think this is one of many steps in a much larger effort to predict future performance of critical frontier agents accurately. We’re excited to see more work in this direction.
0 comments
Comments sorted by top scores.