Quantifying SAE Quality with Feature Steerability Metrics
post by phenomanon (ekg) · 2025-04-08T20:55:05.291Z · LW · GW · 0 commentsContents
  Introducing the Steerability Metric
    Steering CLIP's Vision Transformer with Sparse Autoencoders
    What is Steerability?
    What is the Steerability Metric?
    Why not a mono-semanticity metric?
    Polysemanticity Metric
  Features as Functions
    Decoder feature understanding
    Features as pushing operations in clip steering space
  Misc
None
No comments
Introducing the Steerability Metric
Steering CLIP's Vision Transformer with Sparse Autoencoders
The Steerability metric came about during the writing of Steering CLIP's Vision Transformer with Sparse Autoencoders, the general focus of which is leveraging CLIP’s preexisting image-text capabilities to provide automated interpretability for vision models. Throughout training, as is the case for many attempting to use SAEs, we lacked a clear manner by which to judge the quality of the SAEs we trained - L0, explained variance and MSE loss are useful from a convergence perspective, but provide little insight into how well realized the ideal utility of the resulting SAEs is - which is of course the degree to which it separates the indistinguishable concepts of the model's internal representation, into interpretable, singular, conceptual features. As an attempt to allow understanding of an SAE's quality during training, I developed this metric, which measures the steering ability the features of an SAE in CLIP's concept space, ideally as a close proxy to feature interpretability.
What is Steerability?
Steerability is how well specific SAE features control the outputs of their host neural network. In Steering CLIP's Vision Transformer, we specifically focus on how effective specific features are at changing CLIP text labelings of images input to the network's vision transformer, and what proportion of an SAE's features are effective at such a task. For sake of simplicity, I'll consider steerability in the context of a vision transformer, though it's easy to see how this could be applied to any other transformer or architectures beyond.
To put things more concretely, steering is the act of hooking a transformer with an SAE, and increasing the strength (replacing the "natural" activation with a different scalar, higher or lower) of one of the features (this is similar to the idea of steering scalars) to elicit a response in the corresponding layer's neuron basis, which then will of course in some manner affect the network's residual stream, and ultimately the model's output embedding. We consider this, the movement of output embeddings for a given input via feature steering, to be the primary task we're concerned with measuring.
What is the Steerability Metric?
Given an interest in seeing how strongly SAE features can affect the output of a network, a natural next question is how best to understand and visualize this. In CLIP's scenario, steering will result in ViT's image embedding moving to a different area of concept space, potentially changing the cosine similarity between it and other embeddings in the space. I chose this change, in cosine similarities between a given image and a pre-defined set of text embeddings, to be the operative quantity for the metric, as it automatically describes in a human-comprehensible manner not only how much a feature affects a model's output, but also what the feature is concerned with (the original goal of an SAE on vision models).
To create the metric, we do the following:
We create vocabulary V, consisting of some set of text labels. This vocabulary is fed through CLIP once, resulting in |V| embeddings against which to compare the change in image embedding.
We pick a feature of interest f. We set this feature to different strengths (e.g. set to 0, .5, 1, 5, 10, 100...), and run a batch of images through CLIP's Vision Transformer. This yields us a sequence of embeddings, each of which has a stronger contribution of the chosen feature to the network's output. For each embedding for a given strength, , chosen, we compute the dot product between it and each term in the vocabulary, and perform a softmax[1]. This yields us a |V| length vector of adherences between the steered image embeddings (at each strength) and each element of the vocabulary. This sequence of vectors gives us a bunch of information: (Discuss Power, Steerability, SAE-Level Metrics):
The power of a feature f at strength s over images I is the average difference between the steered vectors and the un-steered vector . This is more loquaciously known as the "aggregate probability difference" (this can also be done without the softmax operation, yielding the "aggregate logit difference").
The steerability of a feature f at strength s over images I is the average square difference between the steered vectors and the un-steered vector . I chose to square power to give the metric a nice property:
For a steered feature with its aggregate probability difference uniformly distributed among its top concepts with probability , the metric has the property:
This formulation ensures that features with approximately uniform distributions will have the desirable property that a feature with top concepts always scores higher than one with top concepts.
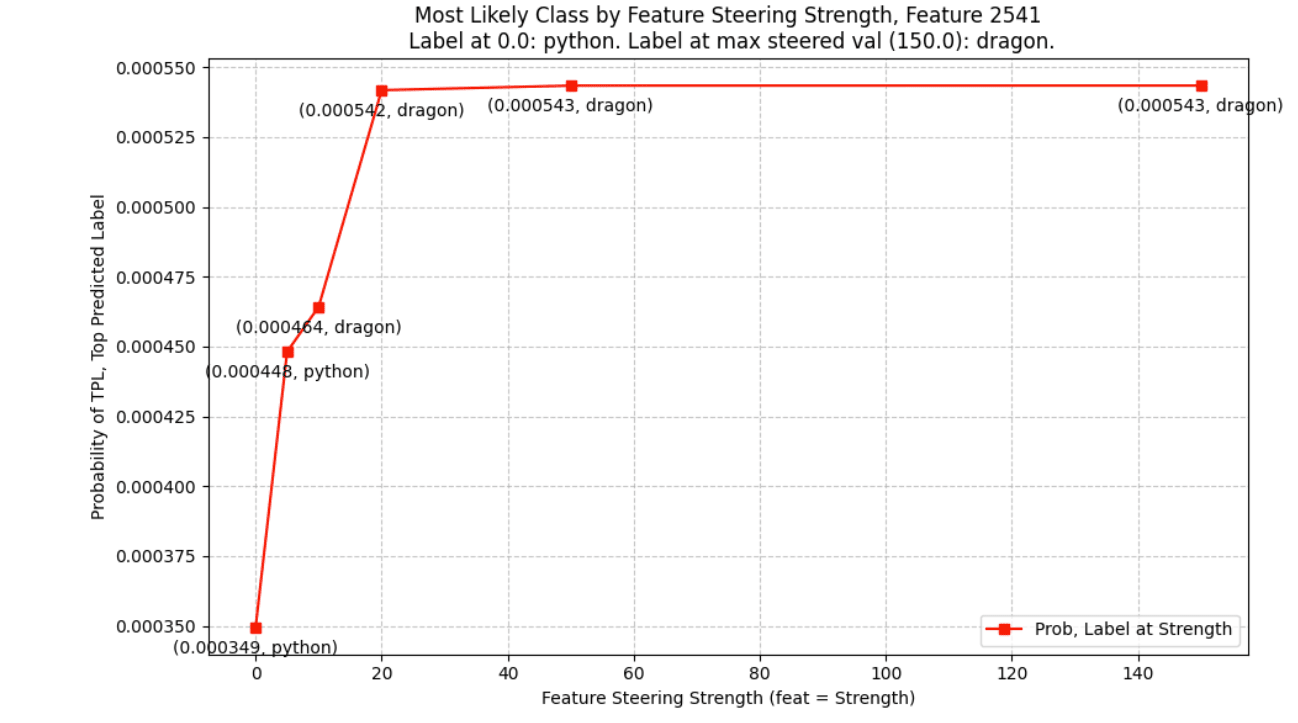
To help visualize, here is a plot of the steerability of a particularly steerable feature, along with its top promoted concept ("dragon") - the steering strengths are between 0 and 150 (fix this chart in figma):
Why not a mono-semanticity metric?
The question may have arisen in the reader's mind, "why 'steerability'? Why not focus on monosemanticity? Isn't that the whole point of SAEs?". The reason I haven't entitled it a monosemanticity metric is because it isn't one - this method, though it takes into account the number of specific concepts, does not take into account whether or not the promoted concepts are semantically similar. To address this, I've drafted a polysemanticity metric.
Polysemanticity Metric
Sphere
Features as Functions
One concept that arose during the development of this metric is that of "features as functions". This takes the view that a feature is a map between the SAE's encoder space and Decoder space, and more broadly a map between the input-focused encoder of the SAE, and the output-focused decoder of the SAE.
Decoder feature understanding
There are many papers that use responsiveness to input space (for ViTs, input images) as a manner of calculating feature monosemanticity. Looking at decoder space..
Features as pushing operations in clip steering space
Related to Flows
Misc
There are many flaws to this metric.
Steerability, broadly, is a family of metrics intended to describe how effective both entire SAEs and specific SAE features are at controlling the outputs of neural networks
- ^
In Steering CLIP's Vision Transformer, we chose to softmax this, as it sharpens the logit vector's distribution and results in a vector that adds to one, but one could also do this process in logit space.
0 comments
Comments sorted by top scores.