Research Taxonomy Generator and Visualizer
post by Myles H (zarsou9) · 2025-04-26T16:14:27.772Z · LW · GW · 0 commentsContents
  TRecursive
  Methodology
    Additional implementation details
  Related Work
  Feedback, Future Work, and Contributing
None
No comments
I recently built a tool which orchestrates LLMs to generate a hierarchical taxonomy from a corpus of research papers (taxonomy-generator), and a nice UI to visualize the generated map (TRecursive). To test the system, I ran it on a corpus of over 3000 AI safety related papers published on ArXiv, and the generated taxonomy is displayed on trecursive.com/ai-safety-taxonomy. My hope is that it makes academic research more navigable, aiming to provide researchers with a bird's-eye view of the field, help them understand how their work fits into the broader landscape, uncover connections, and provide structure to large, fast-paced fields like AI safety. I'm writing this post in pursuit of feedback, help, and to get the word out! 🚀🙂
TRecursive
I'll start by briefly talking about the UI, as I think it provides some grounding as to what the end goal is before getting into the nitty gritty methodology. I recommend checking it out yourself, but if you're on mobile (it works on mobile, but I recommend it on desktop), or cut for time, here's a gist.
The map UI is an infinite canvas app with two views, a titles and default mode, with the titles mode intended for bird's-eye view exploration, and the default mode for diving into particular topics (e.g. to see the papers sorted under a category).
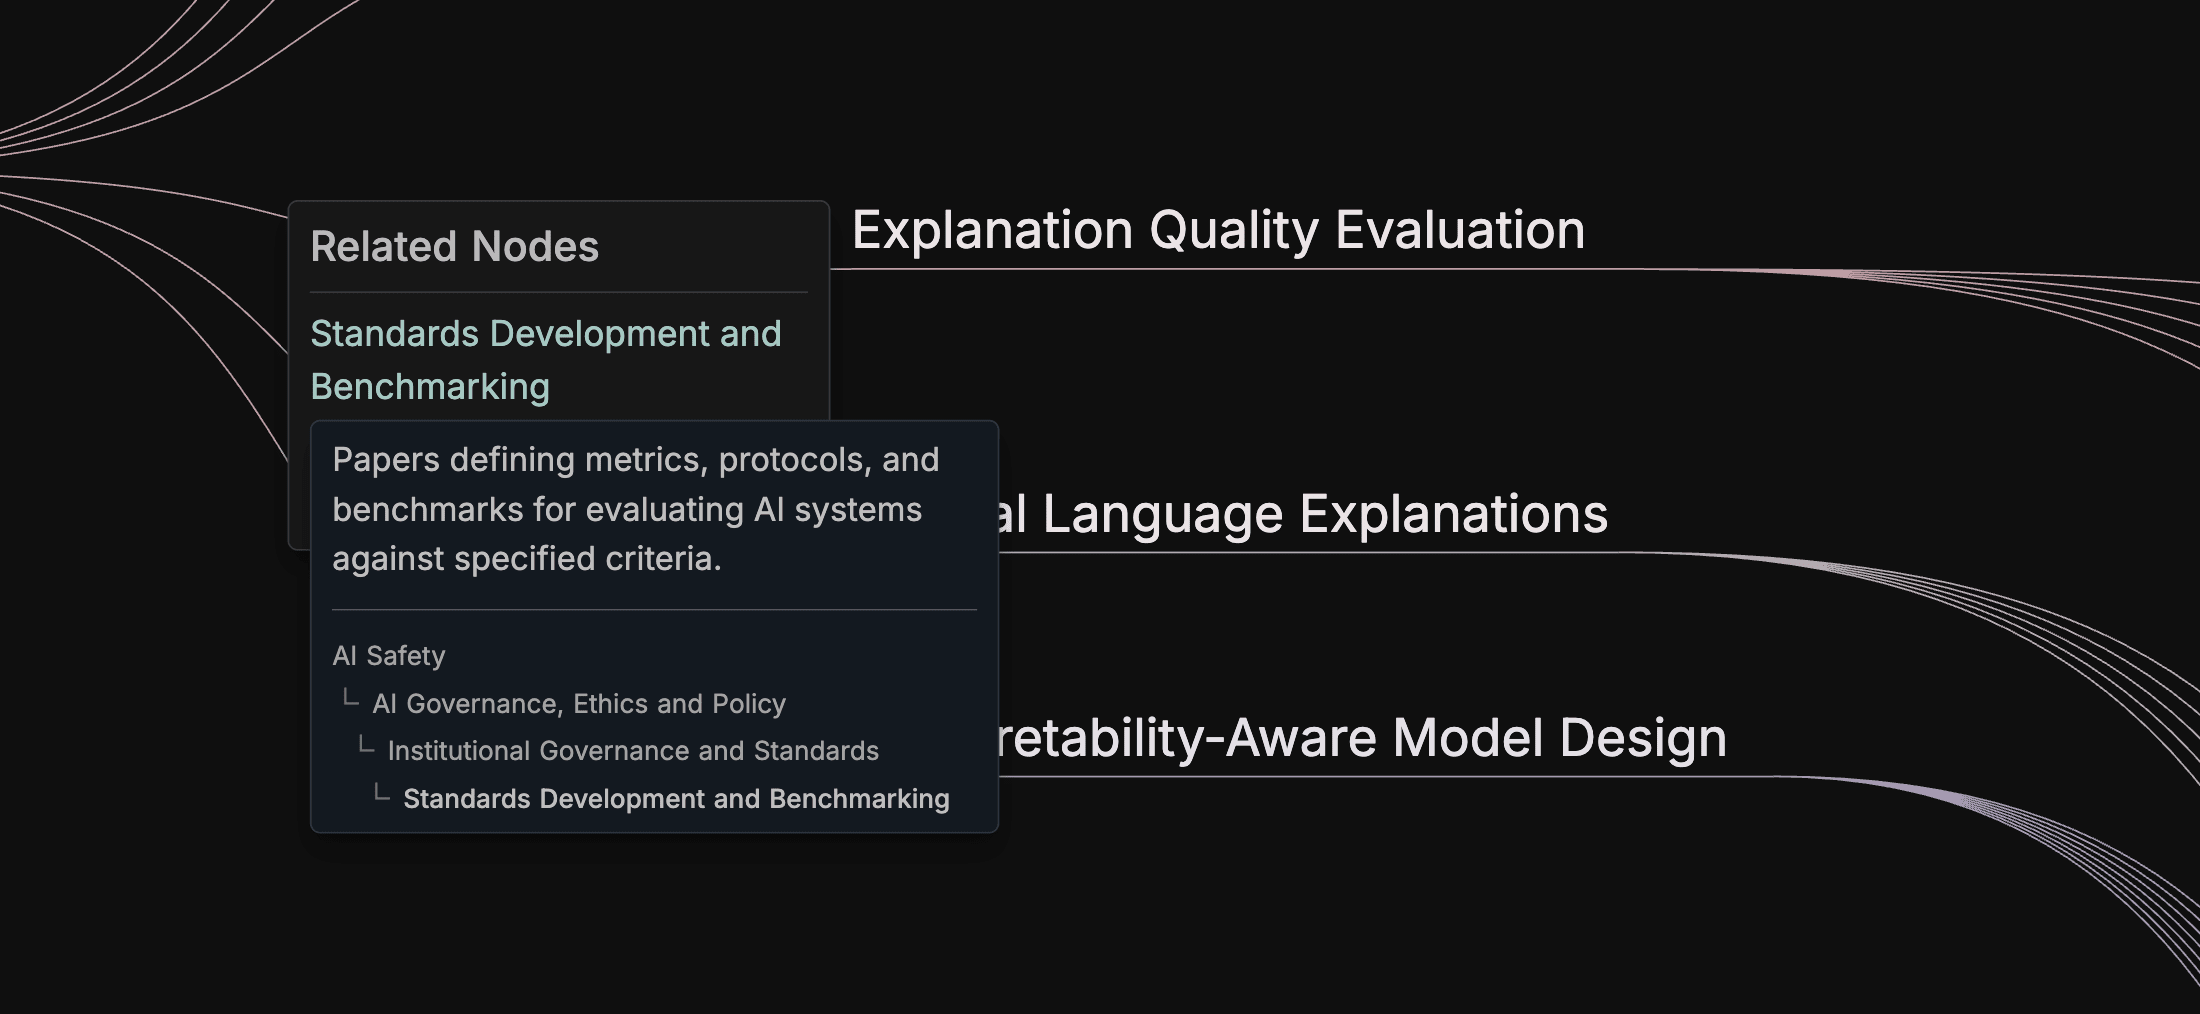
In the titles mode, hovering over titles will show a sentence description, and (occasionally) related topics.
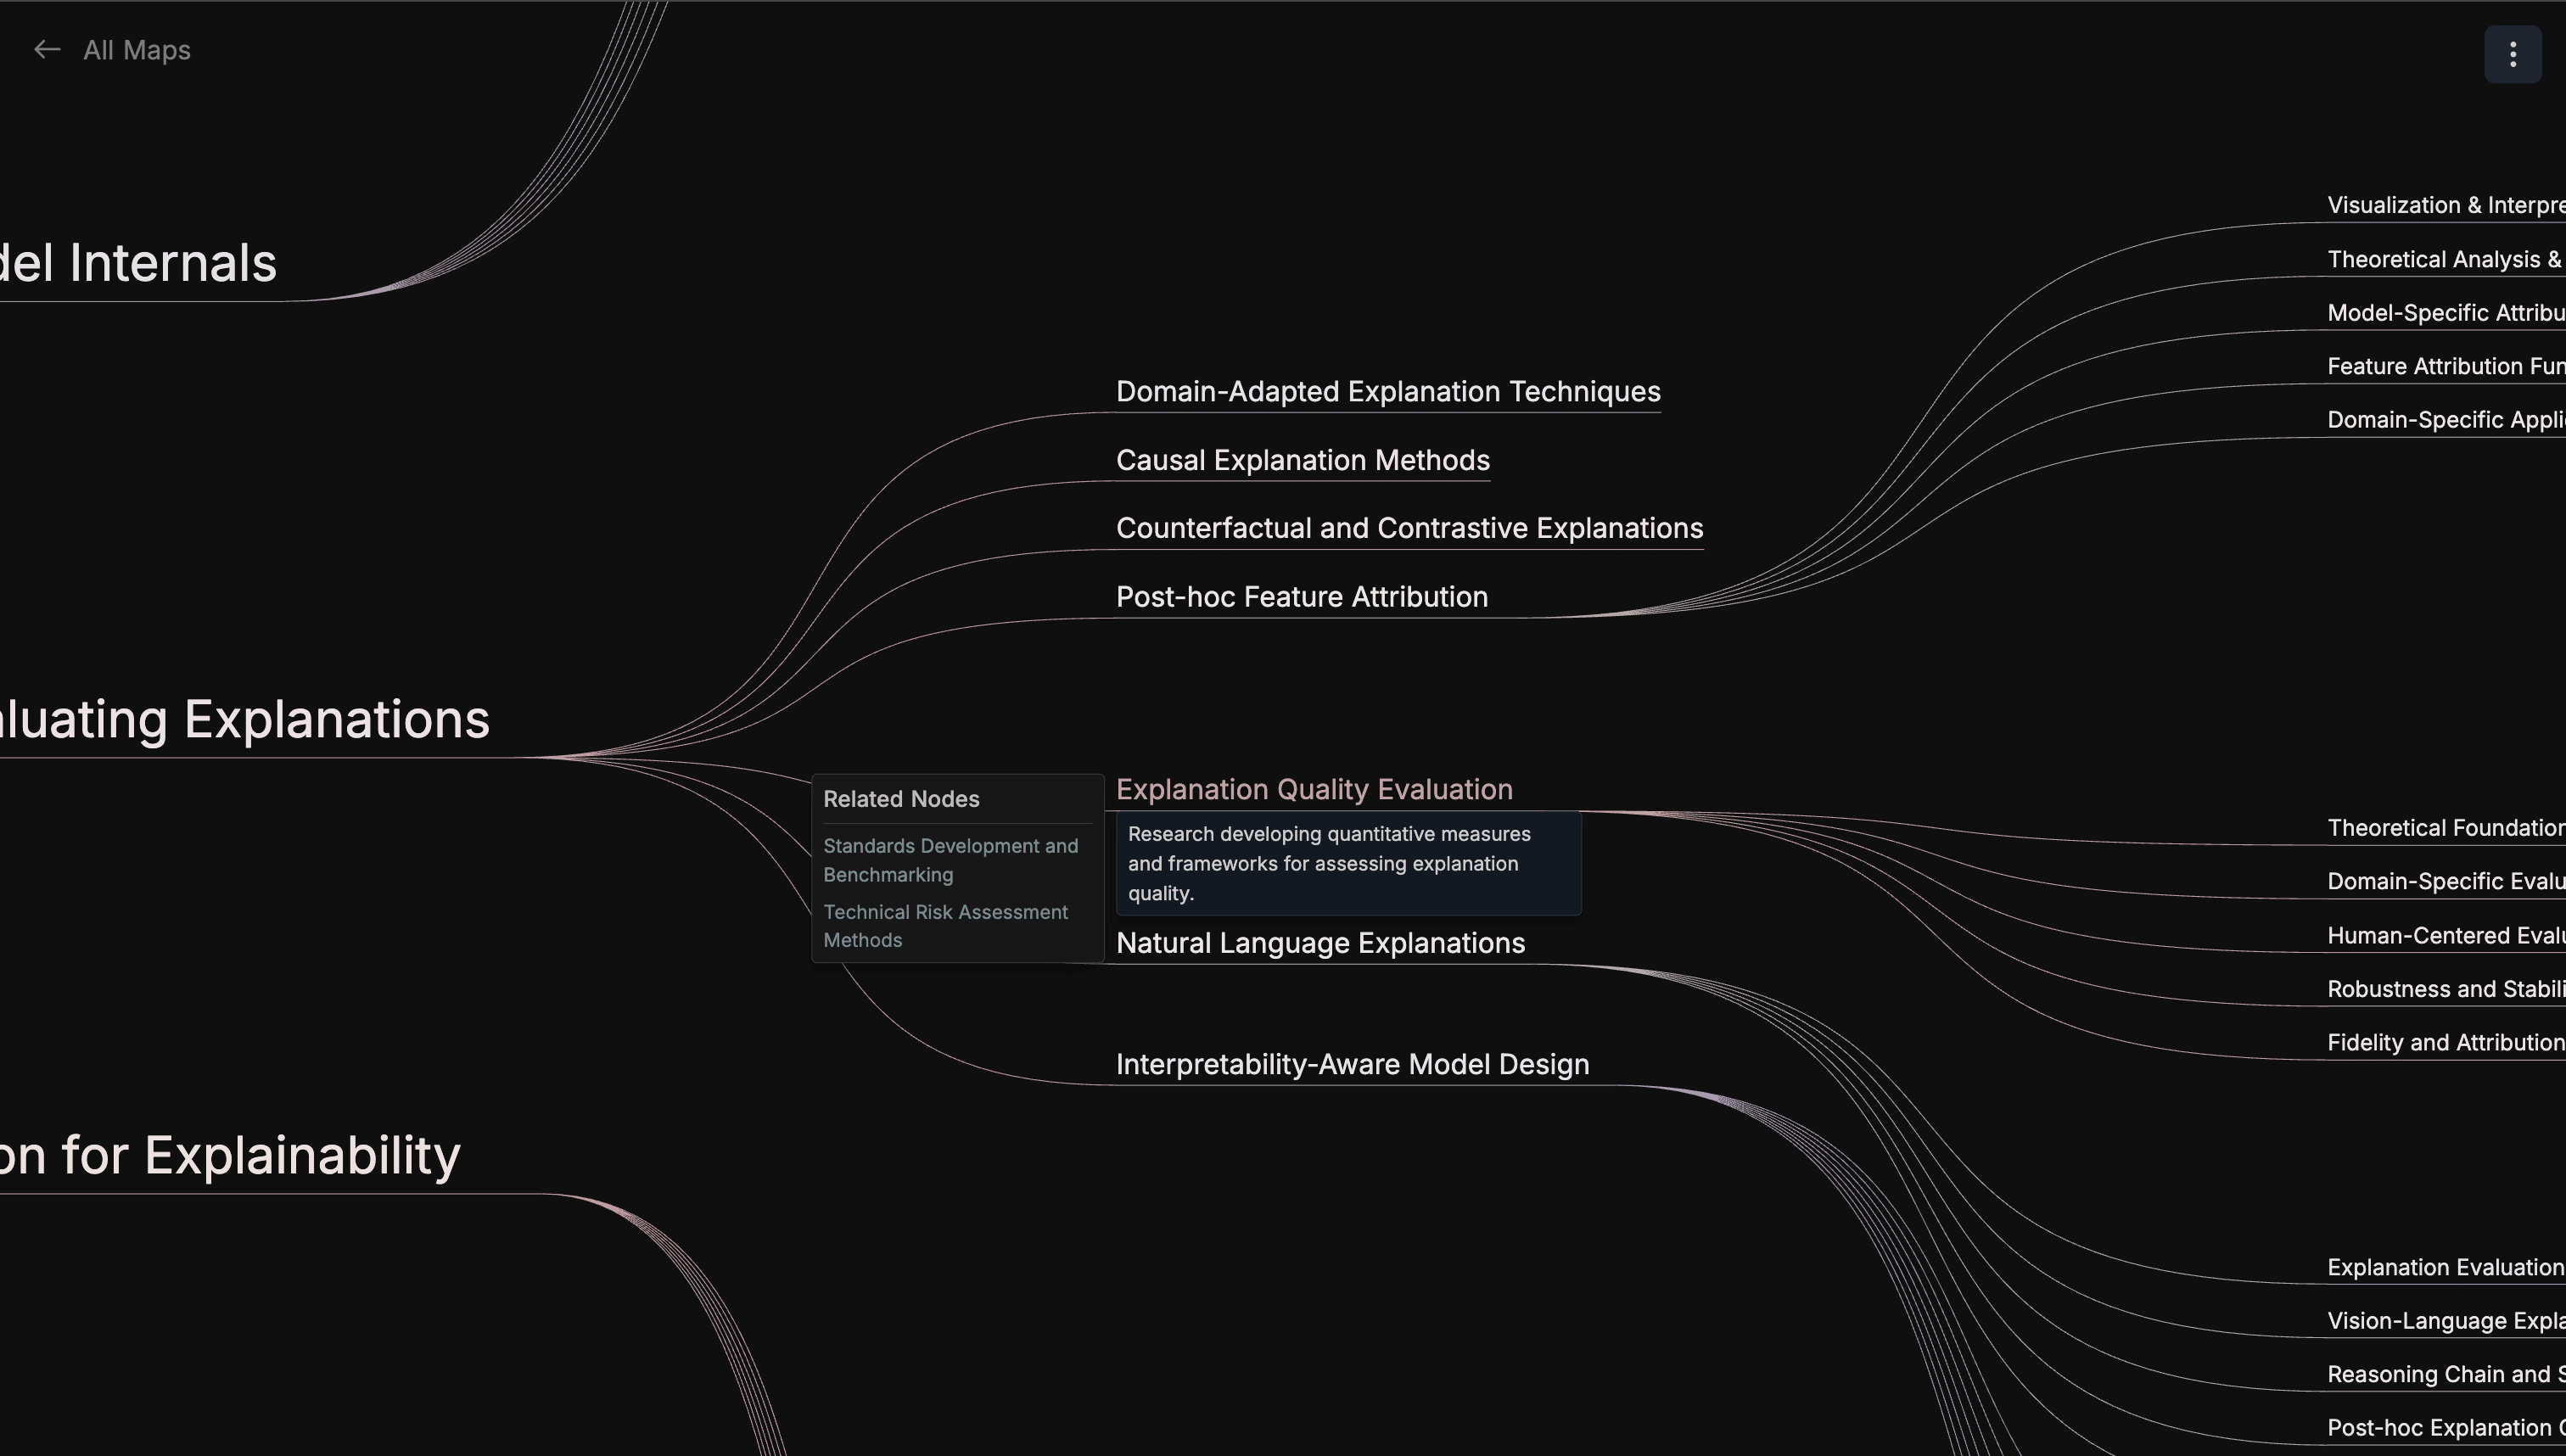
Hovering over related topics will also show its location in the tree.
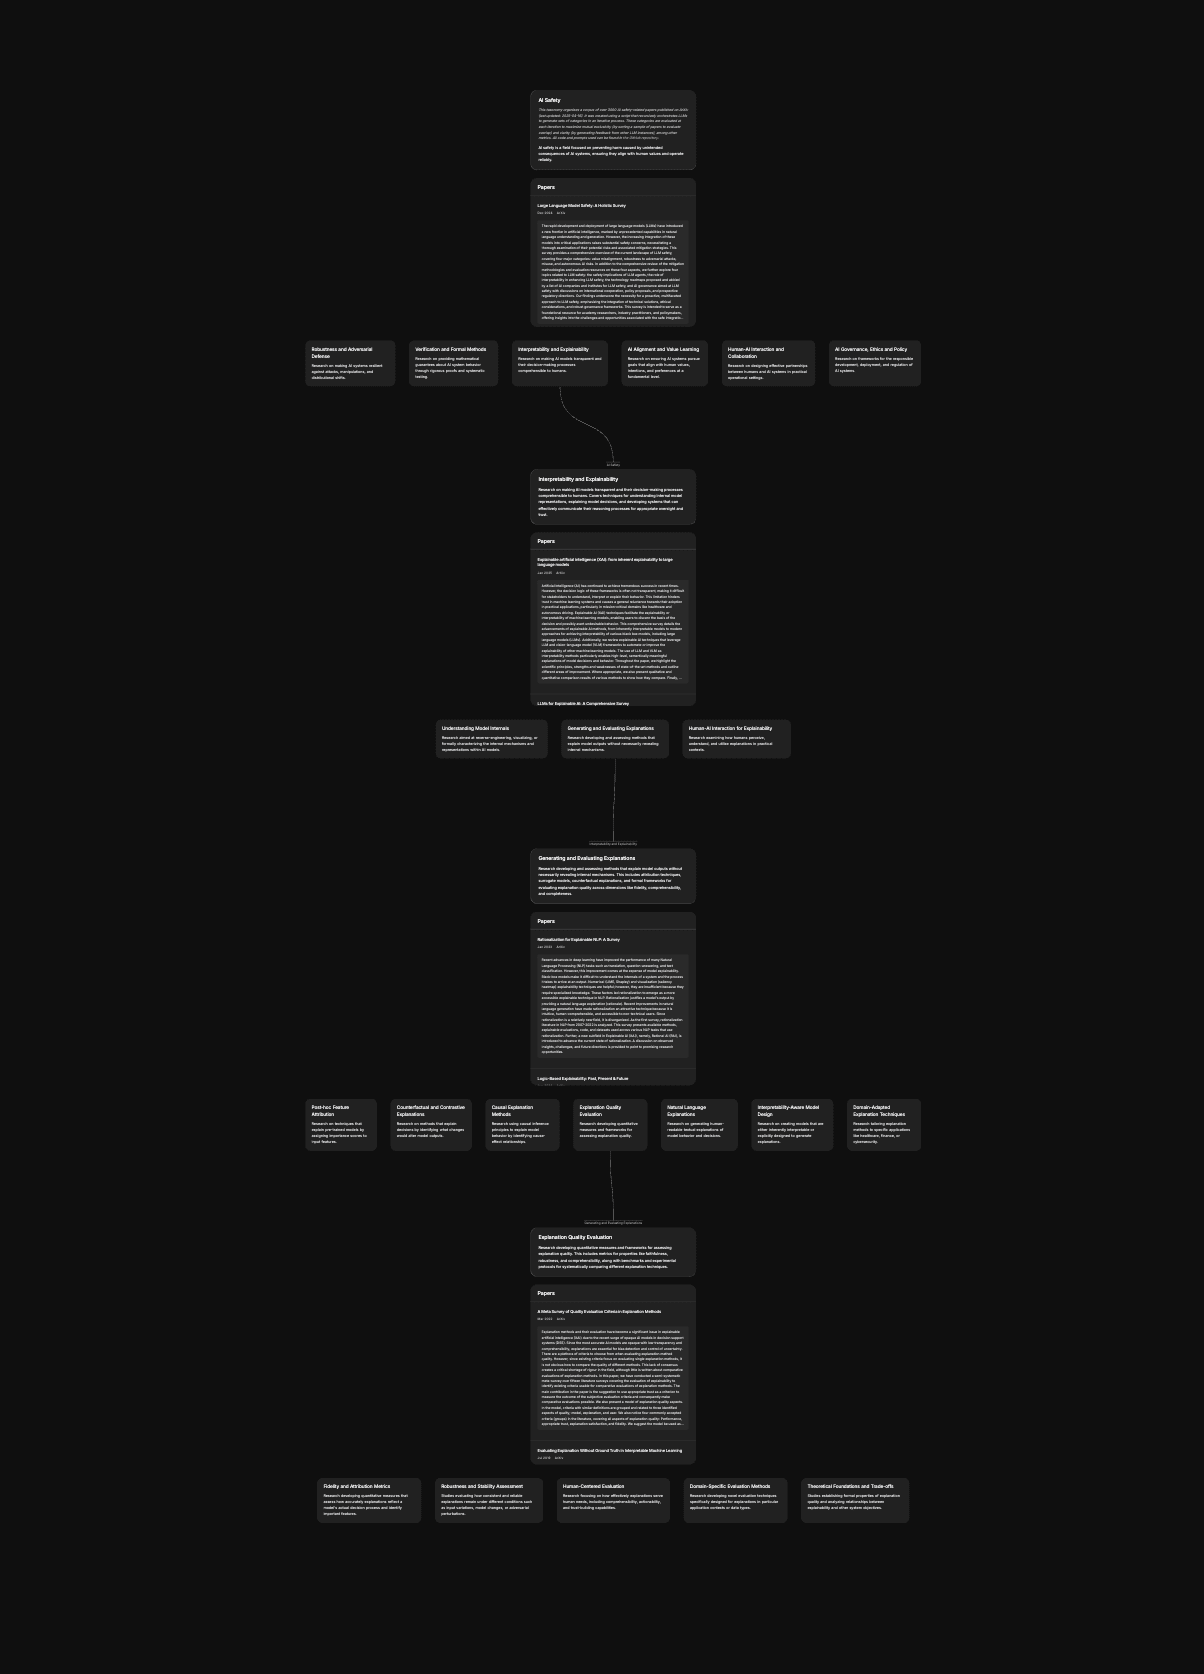
And clicking on a title takes you to the respective topic in the default mode, where you can read all papers sorted into that topic.
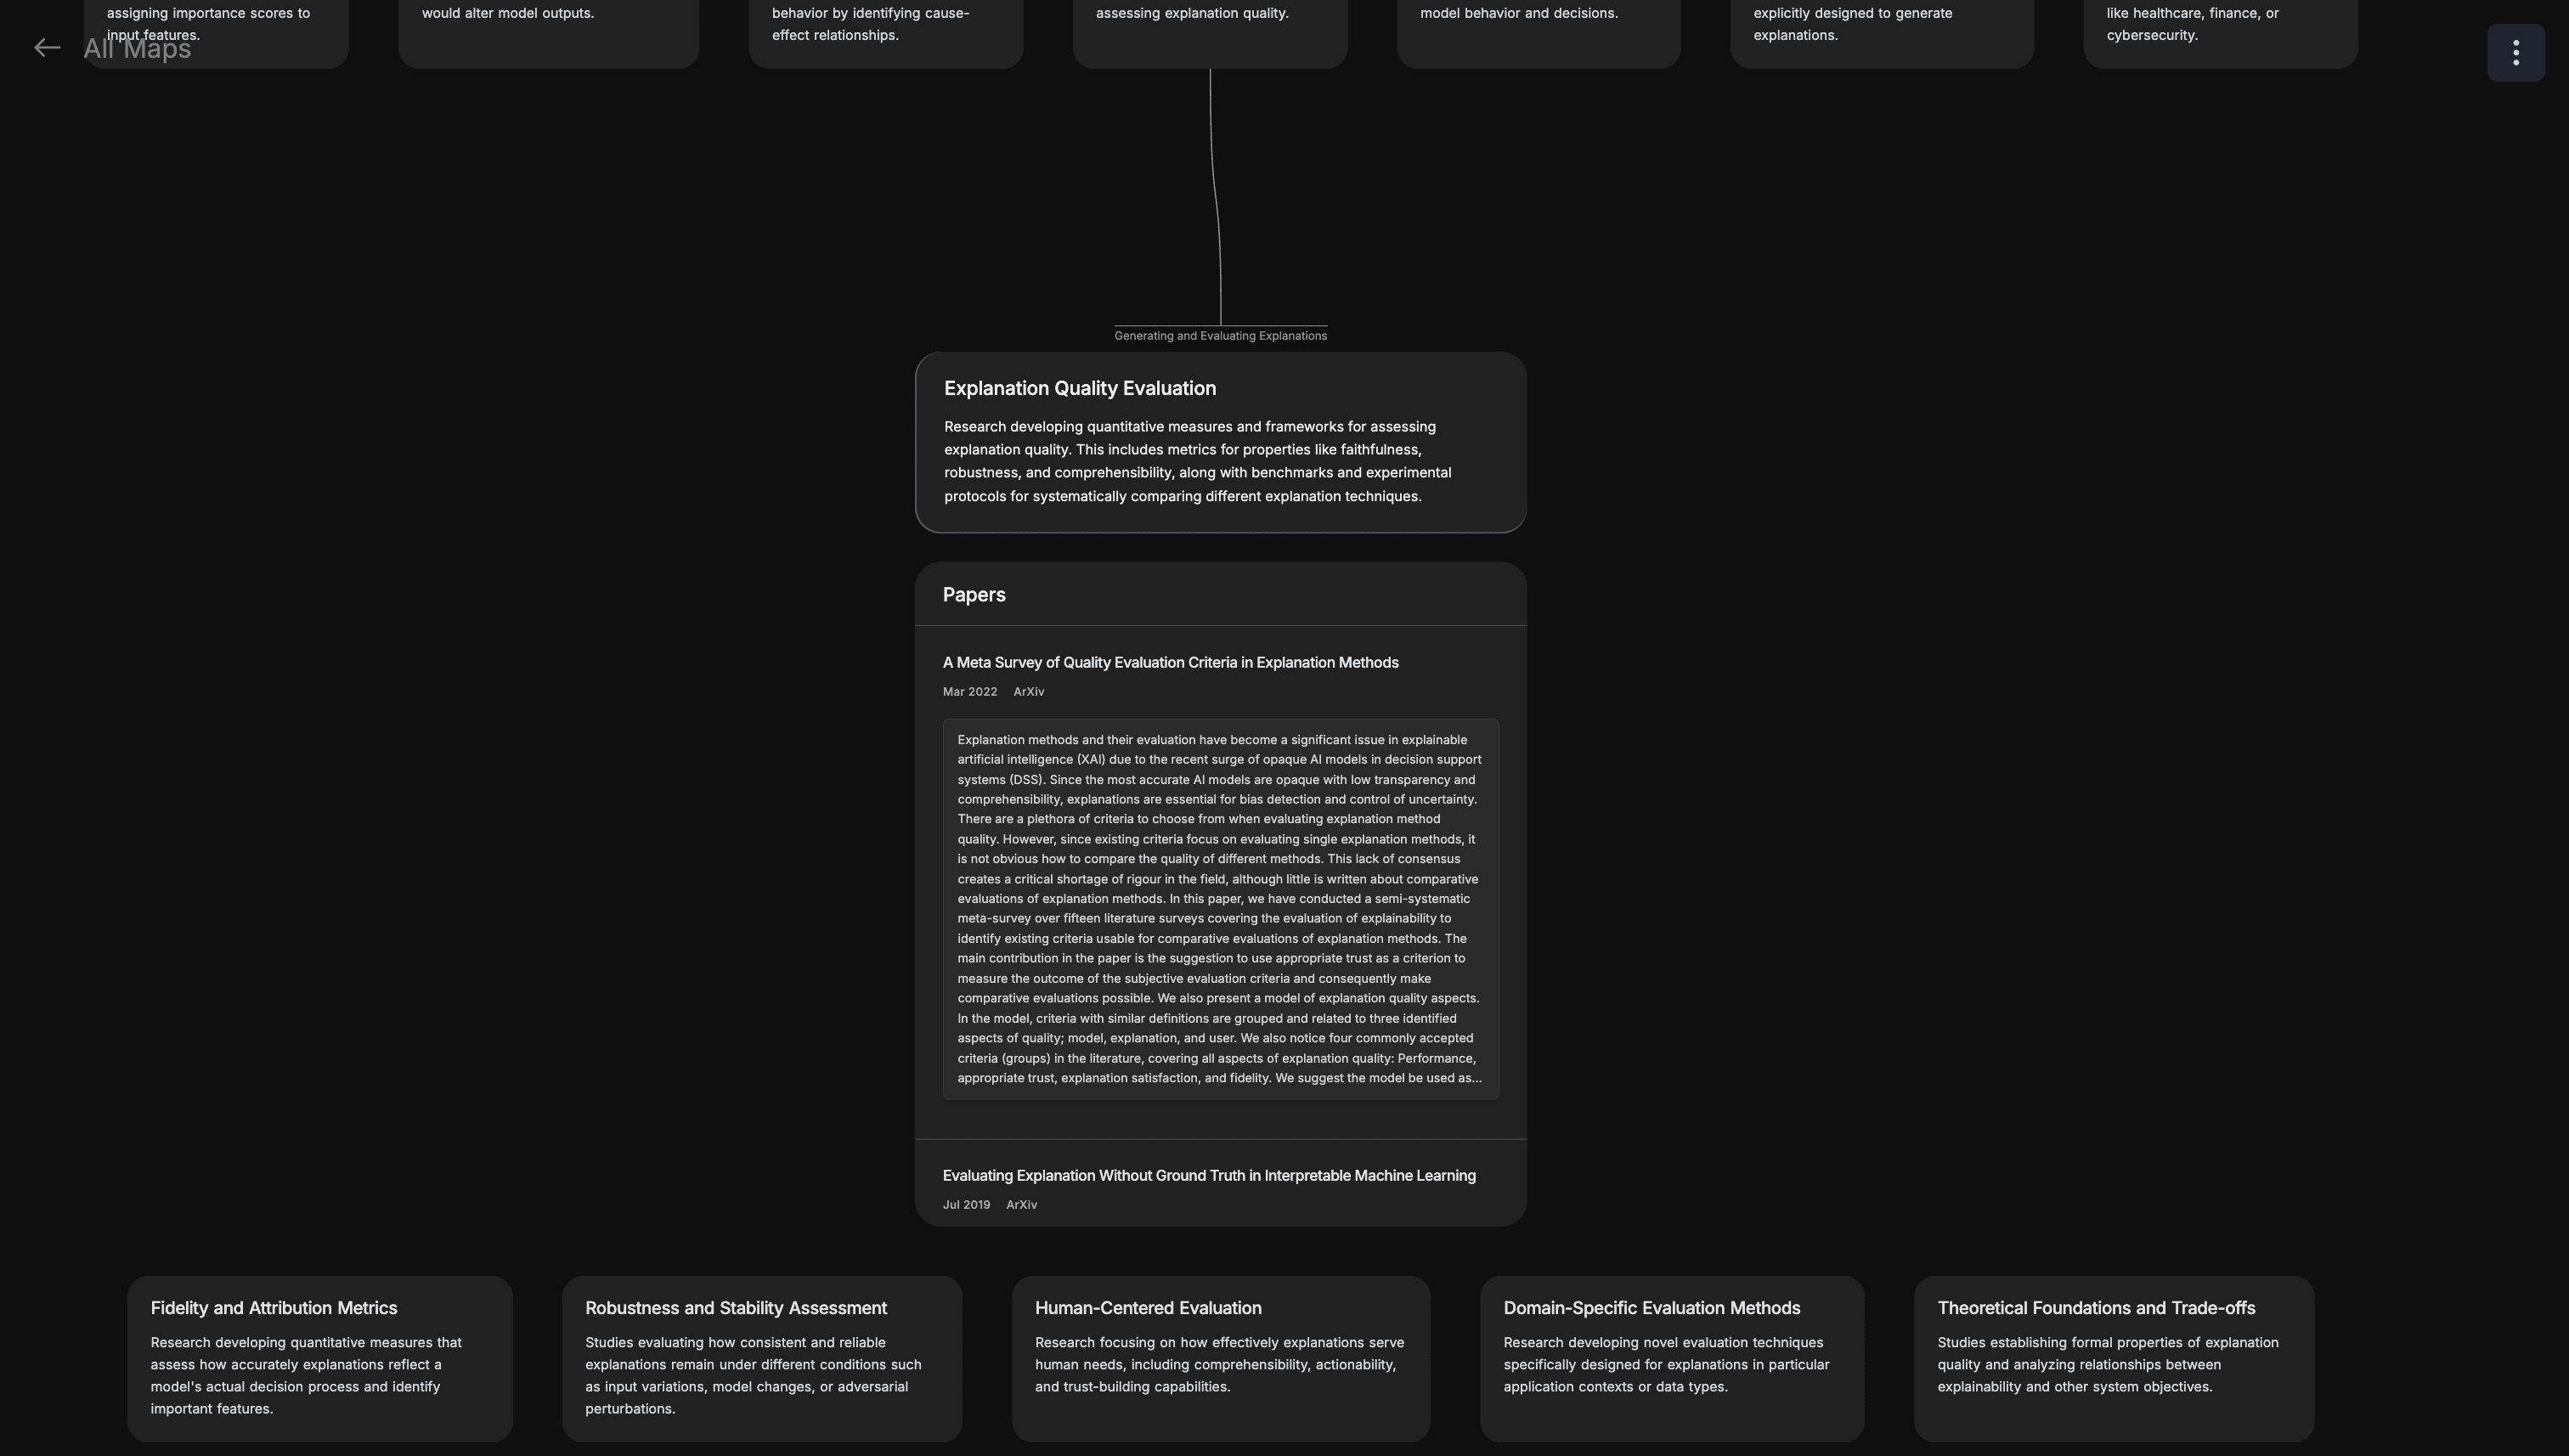
In the default mode, you can use arrow keys to navigate the tree, and can always zoom out to look back on your footsteps.
Methodology
At a high level, the main script starts with the main topic or research field (e.g., AI safety), and has an LLM generate a set of categories to sort each of the papers into. After proposing this category set, another LLM sorts a sample of the corpus into the categories, and the results of which (among some other metrics) are passed back to the main LLM, so it can iterate on its breakdown. The evaluation system outputs an overall score for each breakdown, so after a few iterations, the program selects the breakdown with the highest score.
After this breakdown is selected, all papers from the corpus are sorted into each of the categories with two exceptions: (1) if a paper doesn't fit into any of the categories, it's removed from the corpus, and (2) if the paper provides a broad overview or literature review of the main field or topic, it's kept in that topic (hence why not all papers are sorted into the leaf nodes).
This process recursively repeats for each category until leaf categories have below a specified number of papers. For the AI safety taxonomy, with ~3200 papers, this produced 515 topics.
You can read the chat history from one of these iterations here, and I recommend reading through the main prompts file which holds all prompts used.
As mentioned, each proposed breakdown is evaluated to produce an overall score. This overall score is a summation of the following five metrics (ordered by importance).
- Percent Single - Percent of papers sorted into only one category. (the sample sorting prompt allows the LLM to choose all applicable categories, but the official sorting prompt forces the LLM to choose)
- Percent Placed - Percent of papers sorted into at least one category.
- Feedback Scores - 4 LLMs with different system prompts (to emulate different user groups) are asked to provide a helpfulness score. This is the mean of those scores.
- Overview Papers - For each topic, the script searches for an associated overview or literature review paper. This scores higher for all topics it could find at least one overview paper. (this metric is disabled for topics past a certain depth)
- Deviation Score - This scores higher when papers are distributed evenly across categories.
The first two metrics reflect the MECE principle (mutually exclusive and collectively exhaustive). The third metric is used to ensure the breakdown is clear and practically helpful.
A breakdown is considered invalid if any of the categories received no papers sorted into them.
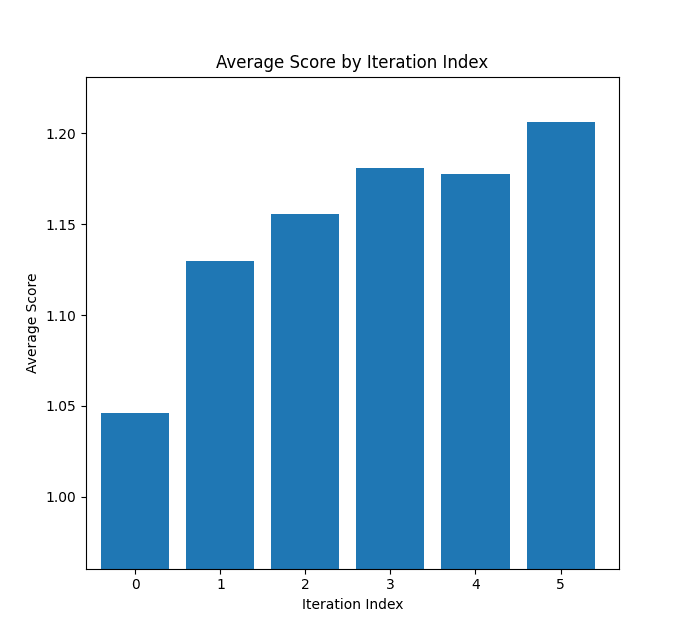
To demonstrate the effectiveness of this iterative approach, I analyzed data from 83 different topics (from the AI safety run), tracking how scores changed across iterations. This first graph shows the average score for each iteration across all runs:
This next graph shows how frequently each iteration produced the winning breakdown (the one with the highest overall score):
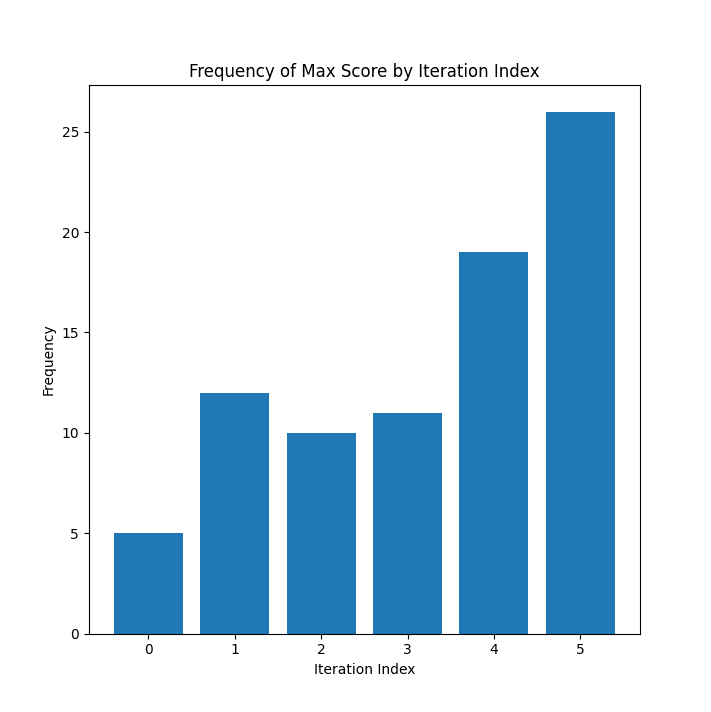
The scores go up! I limited the process to 6 iterations (for most topics, all past the second depth) to manage costs, but I'm curious how far the trend continues with more iterations.
After all the topics are generated and the papers sorted, there are two more steps to complete the taxonomy. First, an LLM is used on each topic to order its papers by relevance. And second, related nodes are found to identify connections between topics in different parts of the tree.
To do this, I embedded all topic descriptions using an embedding service, and for each topic I used cosine similarity to find its most semantically related topics (above some similarity cutoff). I then filtered out those already nearby in the tree (like parents or siblings), and assigned the resulting list as related nodes to the given topic. In the AI safety map, about 30% of topics have at least one related node.
Additional implementation details
The corpus for the AI safety taxonomy was compiled by combining ArXiv keyword searches (based on AI safety subtopics) with additional results from querying the Exa search engine. I then used an LLM to filter out any non AI safety related papers from the corpus. The corpus is by no means comprehensive, and likely suffers from selection bias from the keywords chosen for search. This is a key area for future work.
These are all the models I used:
- Claude 3.7 Sonnet (thinking) for the main breakdown generator
- Gemini 1.5 Pro for generating feedback
- Gemini 2.0 Flash for sorting and ranking papers, filtering the corpus, and identifying survey papers
- gemini-embedding-exp-03-07 for the embeddings
Related Work
A particularly relevant recent work that I found is HiReview: Hierarchical Taxonomy-Driven Automatic Literature Review Generation. HiReview similarly constructs hierarchical taxonomies to organize research papers, but with significant methodological differences. HiReview leverages citation networks as its primary organizing principle, employing graph neural networks for hierarchical clustering. It then passes the created taxonomy to an LLM to generate a complete literature review. The biggest difference is that HiReview doesn't use LLMs for generating the taxonomy itself, and its focus is on generating literature reviews from specified queries. Early on, I decided to avoid using citation graphs as I knew there already existed many citation graph visualization tools (e.g., Connected Papers, Litmaps, Research Rabbit, or Inciteful), but after seeing this paper, I realized there is a lot of opportunity for leveraging citation data (discussed more in Future Work).
I started by mentioning that paper as it's uniquely different from most work which came up in my search. Most related work was actually under an established field of research known as Ontology Learning (see also: Automatic Taxonomy Construction). It dates back to at least 1992, with the seminal Automatic Acquisition of Hyponyms from Large Text Corpora paper, which introduced what became known as the "Hearst patterns" - a set of lexico-syntactic patterns that could be used to automatically extract hyponym (is-a) relationships from text.
More recently however, LLMs have been used to enhance ontology learning (see: A Short Review for Ontology Learning: Stride to Large Language Models Trend).
After reviewing many of the papers in this field, I noticed a core difference between what I've done and what seems to be a standard in the field. The existing literature formally defines node relationships (primarily hyponym relations), whereas my method gives the LLM freedom to determine how topics should relate to one another. On my map, the way in which sub-topics relate to their parent topic is unknown. The focus is simply on effectively categorizing the documents by any semantically useful means.
It makes perfect sense why this approach is uncommon. Most use cases for ontologies require formally defined relationships between nodes to function properly. I am able to take this different approach, because I'm considering the ontology itself as the end product rather than a means to an end.
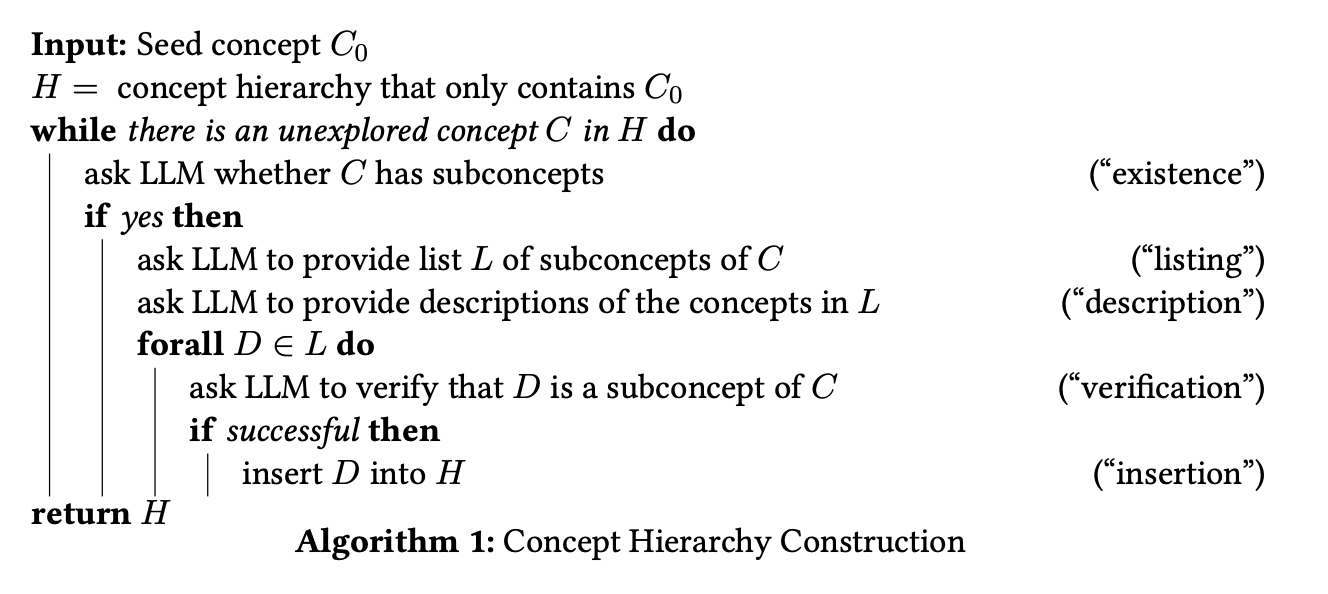
From the papers I found in this field, Towards Ontology Construction with Language Models uses the closest approach to mine. It's focused, however, on generating is-a relations between simple concepts from the LLM's memory, and isn't evaluated by classifying documents. I did something similar with trecursive.com/llm-ai-safety-map, where sub-topics were generated without iteration (with related papers searched for, and appended after the fact). They have a nice visual in the paper showing the recursive algorithm they use:
Chain-of-Layer: Iteratively Prompting Large Language Models for Taxonomy Induction from Limited Examples is a more recent paper doing something similar.
End-to-End Ontology Learning with Large Language Models takes a different approach that I found fascinating. It has an LLM predict the full path to a document (e.g., for "apple" it might generate "Things -> Food -> Fruits"), then builds the ontology by aggregating all connections from these paths. The frequency of a connection determines its weight in the final ontology.
I also found a website with a nice UI, which can generate a taxonomy in realtime from any list of documents. There's a button to sort the documents into the generated sub-nodes, and you can choose which sub-nodes to breakdown further. The code is open sourced here. The prompt they use to generate the taxonomy is quite simple however, which makes sense, as it's designed for real time generation from any arbitrary set of documents.
Feedback, Future Work, and Contributing
I would love to hear people's feedback, questions, or comments on both the UI and taxonomy generator script. You can put them in the comments or feel free to DM me directly.
In terms of future work, there are many things in the backlog I want to improve and experiment with. As mentioned, one thing I've really neglected to take advantage of thus far is citation graphs, which could be useful at almost every stage of the process. From corpus compilation, to a new evaluation metric (rewarding categories with more citation links), for ranking papers within topics (considering both relevance and citation centrality), and identifying related nodes.
I'm also planning to update TRecursive so that anyone can easily create and share maps (if there's demand, please reach out if you're interested). Running this script on other fields/corpora is an obvious next step. My plan is to continue iterating on the AI safety taxonomy before diving into this however.
Code contributions are very welcome (see the contributing section of the README). I'd also love to formalize this blog post into a paper, so please reach out if you'd be interested to help turn this into a paper (I don't speak academia 🙂).
0 comments
Comments sorted by top scores.