Safety tax functions
post by owencb · 2024-10-20T14:08:38.099Z · LW · GW · 0 commentsThis is a link post for https://strangecities.substack.com/p/safety-tax-functions
Contents
  Paradigm cases
    Once-and-done problems
    Ongoing problems
  Safety tax functions
    (Re)parametrizing
    Safety tax contours
  Possible extensions to the model
None
No comments
In thinking about the future of AI safety, it sometimes seems helpful to think in terms of “finding a solution to the alignment problem”. At other times, it seems helpful to think in terms of “paying a safety tax”. On the face of it, these two concepts seem hard to reconcile: one of them is about the moment where we have a solution and can stop investing resources into safety; the other presumes something like a constant fraction of resources going into safety, forever.
This is a post for concept geeks. I’ll explain that by allowing safety tax to vary with capability level for a hypothetical dangerous technology, we can represent both of the above dynamics as special cases of a more general class of functions. While I don’t think I’ve got to the point of having these concepts fully crisp, they seem sharp enough that I’ve been finding them helpful.
In a follow-up post, I’ll look more specifically at my picture of the safety tax landscape for AI — arguing that it’s unusually dynamic (in the sense that specific advances in AI might change the available tradeoffs), and that the peak safety tax requirements probably come in the period when AI is mildly- to moderately-superintelligent.
Paradigm cases
Suppose we have a potentially dangerous technology. The danger accrues as the technology gets more powerful; it needs sufficient investment in safety to keep it safe. How much? It depends on the nature of the technology and the potential problem.
Once-and-done problems
Some technological problems have “solutions”, in a pretty clean sense. After you’ve identified a solution, you’re basically good to keep on applying that solution whenever the problem comes up, and the cost of applying it is trivial compared to the total cost of the technology. You can solve the problem of lossy signals with error-correcting codes. You can solve the problem of buildings burning down by constructing things out of fire-resistant materials, even for much larger buildings than you originally thought of. Let’s call these once-and-done problems.
Ongoing problems
In contrast, some problems scale as the fundamentals of the underlying technology change, and you need to keep up with that, rather than having a single clean solution. Think computer security, where further advances in the underlying infrastructure open up more vectors for attack, so defence is a moving target. Let’s call these ongoing problems.
Safety tax functions
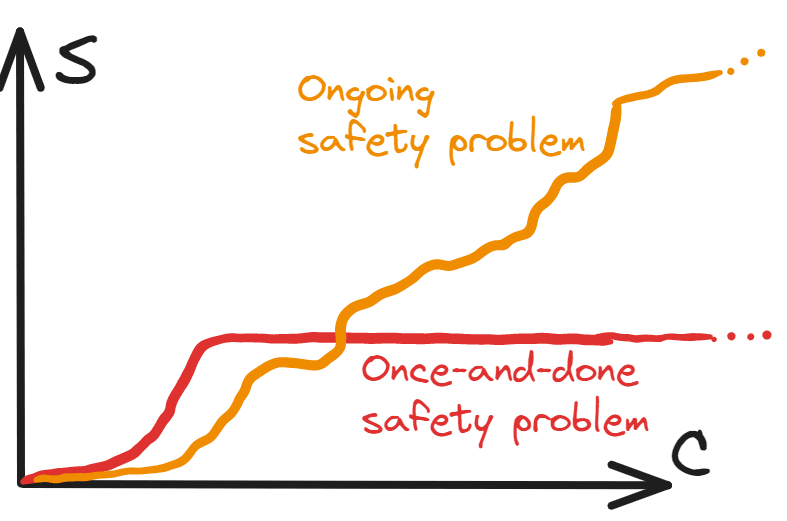
We can represent these cases diagrammatically. Suppose that for a given capability level C of a potentially-dangerous technology, we need a safety level S to avert the risk (these could be thought of as tracking the total investments made in capabilities and safety). Then when we graph S as a function of C, in the case of a once-and-done problem, at some point (i.e. after the solution is found) it plateaus, whereas in the case of an ongoing safety problem it keeps climbing forever:
However, this binary distinction is pretty simplistic. What about the case where a major problem is solved, but there’s a smaller ongoing investment needed forever?
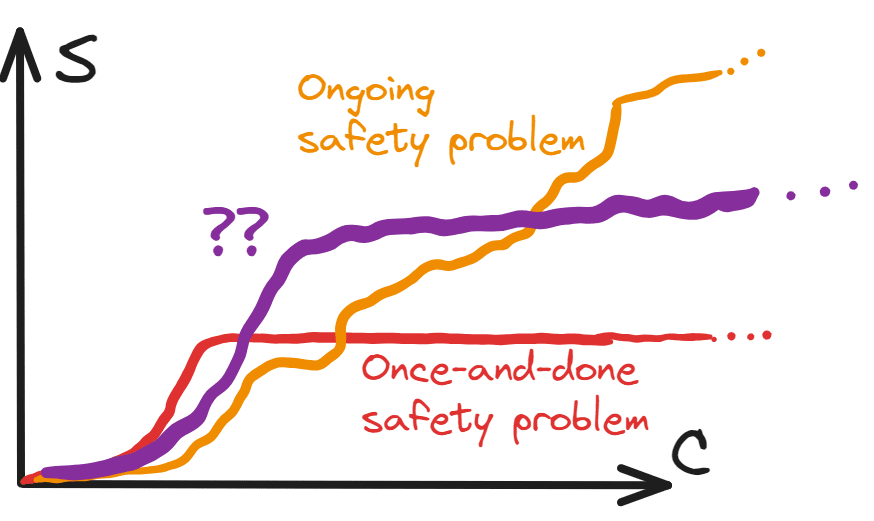
This has features of both a once-and-done safety problem and of an ongoing safety problem. And it’s not some obscure possibility — this kind of behaviour seems pretty generic. Indeed, even the examples we used for the paradigm cases have something of this behaviour!
- Using error-correcting codes imposes a small extra efficiency cost forever
- Although computer security keeps throwing up new vulnerabilities, particular vulnerabilities often have clean solutions
(Re)parametrizing
So far, we’ve been vague about how C and S are measured. While there might be something like “natural” metrics for C and S, we could also measure them by inputs — i.e. the capability/safety level that you’d expect to achieve with a certain amount of work on improving capability/safety levels.
This has the advantage that both dimensions can be measured in units of a common resource of inputs (e.g. dollars, or researcher-months).[1] So now we can talk about the idea of a “constant safety tax”, meaning a constant ratio between the two:
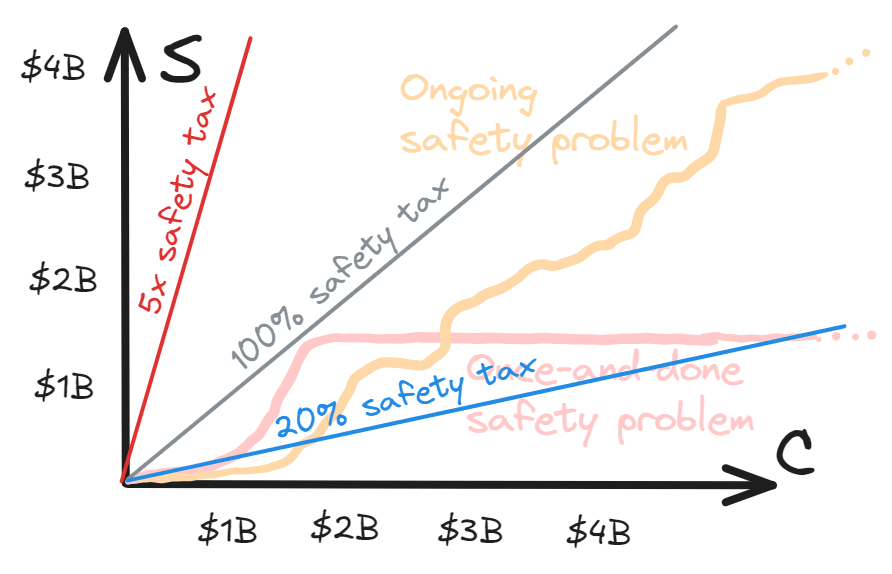
Technically, at this point the diagram has all the information we will need. But I have some niggles with it:
- It’s been drawn in a way that suggests safety taxes in the vicinity of 100% will be appropriate
- But I don’t think we should necessarily assume that
- It makes it hard to simultaneously think about multiple different eras of a technology, when investment may have differed by orders of magnitude
So, let’s transform to log-log axes:
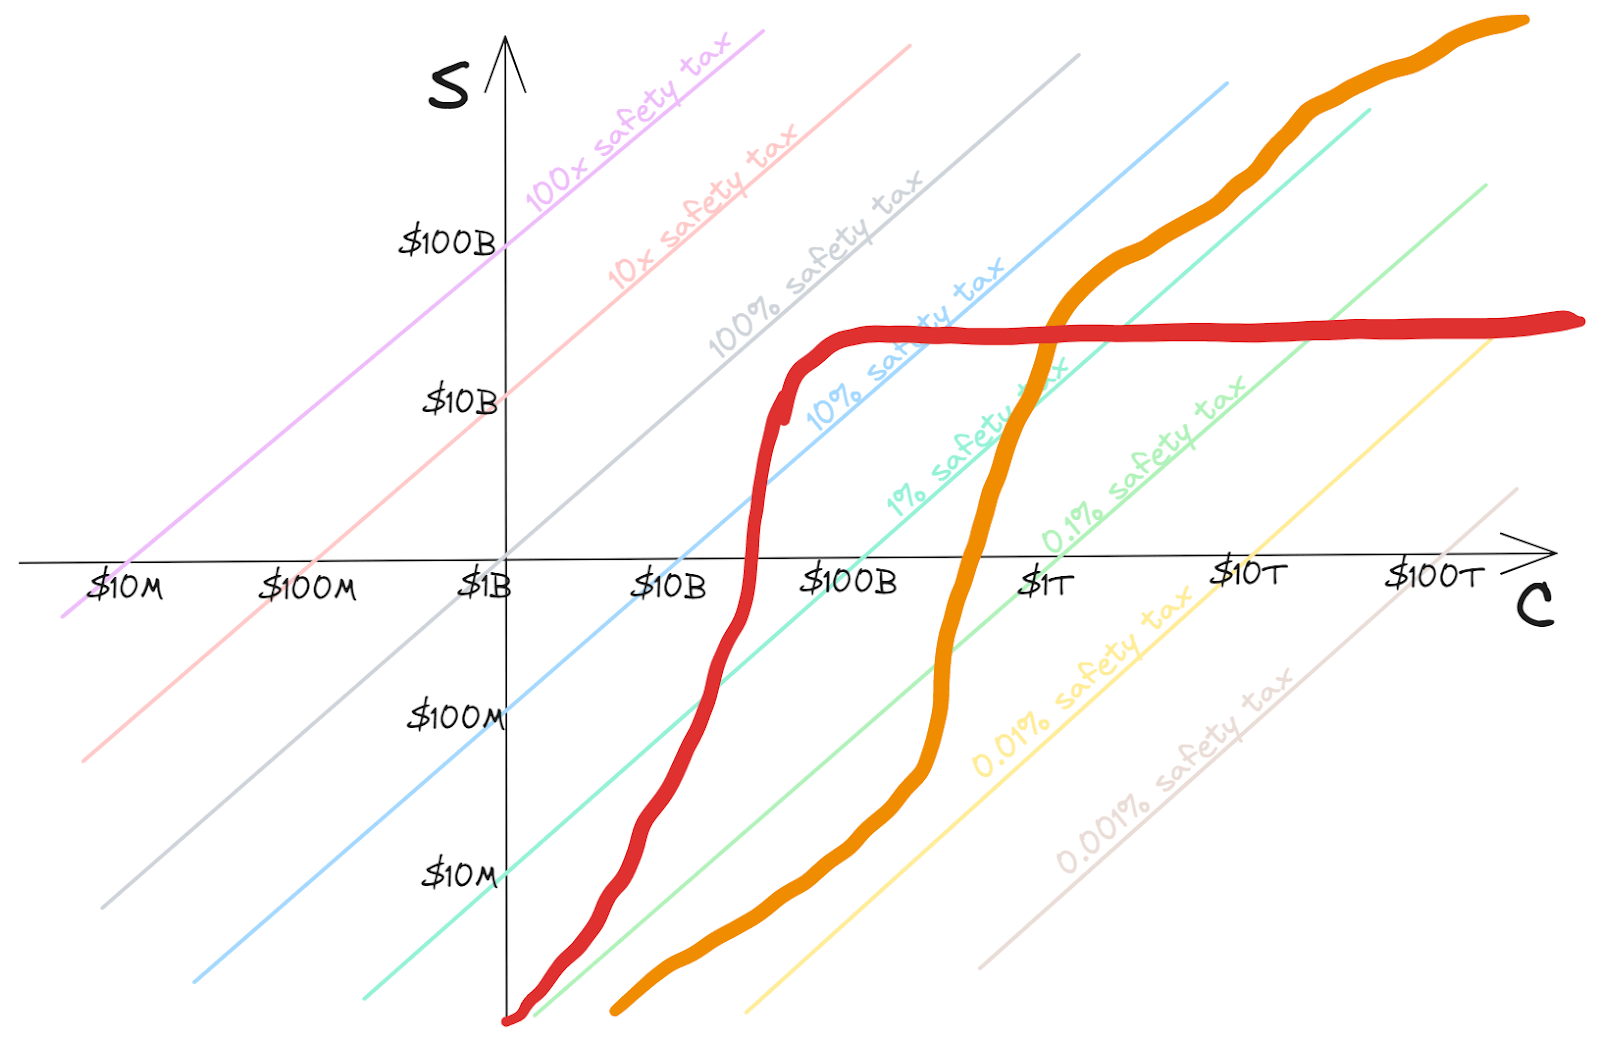
Now the lines of constant safety tax have become 45-degree diagonals with different offsets. While these could be understood as lines representing the safety tax function for a hypothetical technology, they’re more naturally understood as policy-guiding: e.g. staying below the “10% safety tax” line means that consistently “paying a safety tax” of 10% (i.e. spending 10% of the expenditure on C on S) would be enough to ensure safety.
Given that these lines seem policy-guiding, we’ll make one more adjustment to the graph, by using the safety tax level directly as our vertical axis (so that this is a skewed version of the previous axes; although it’s a new illustrative curve):
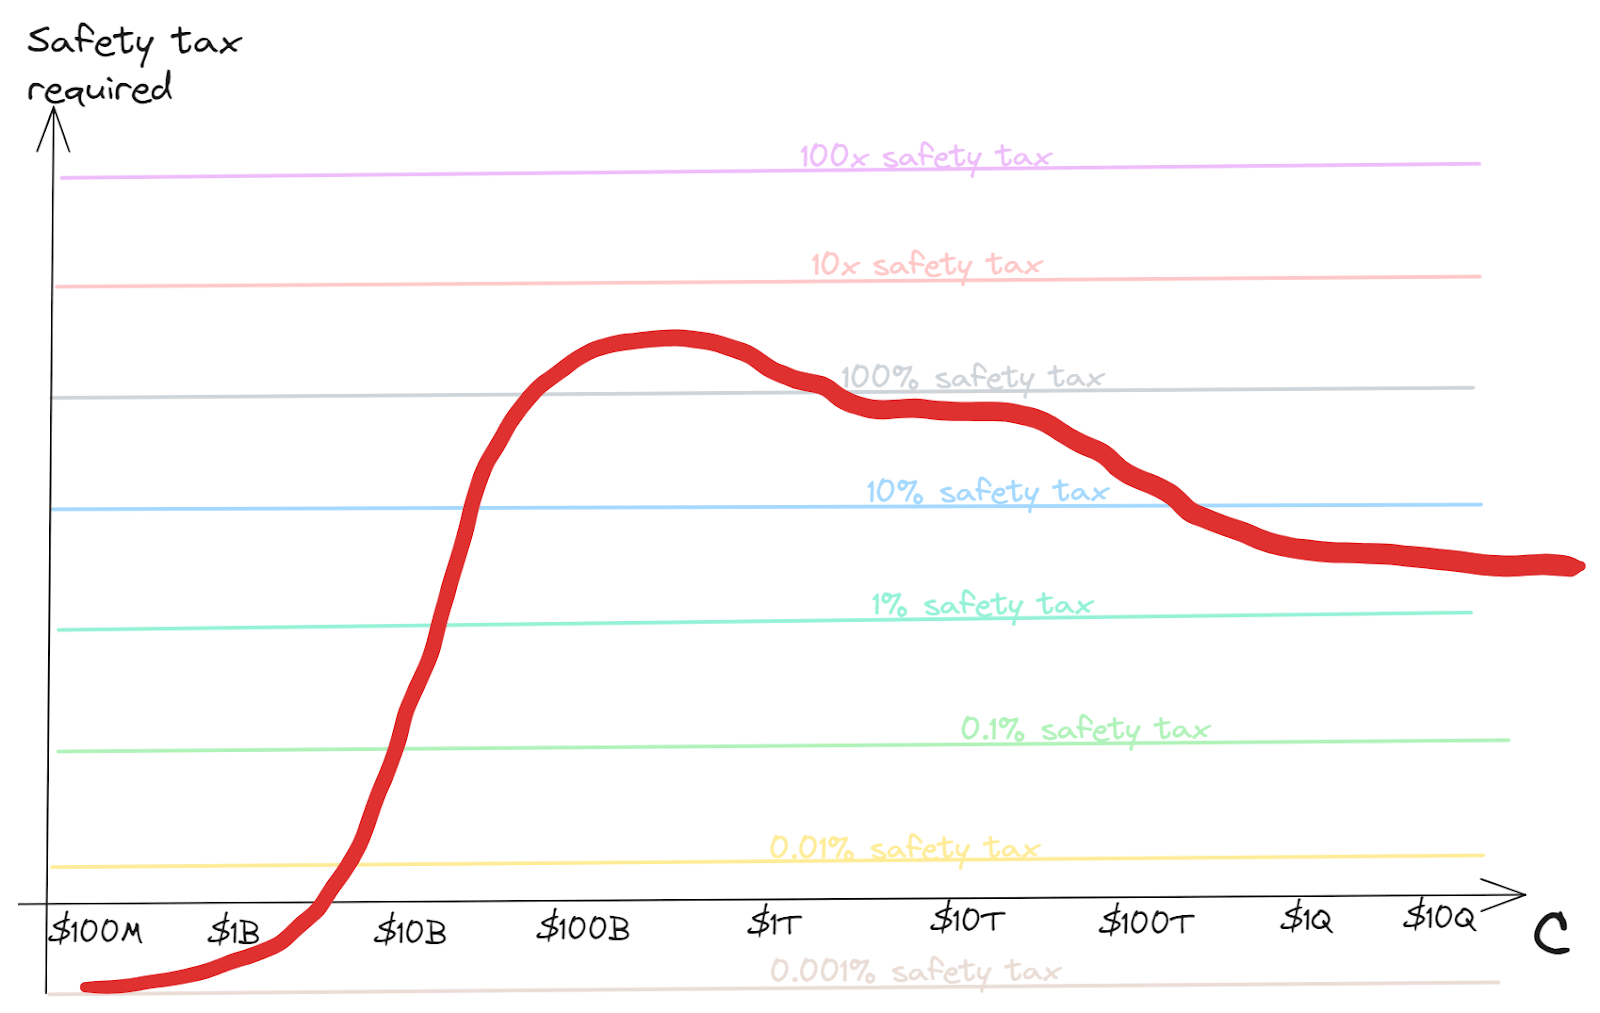
How hard is it to coordinate to always keep sufficient investment in safety? Of course it depends in various ways on the difficulty of the safety problem. The main components, in order I guess from most to least important, might be:
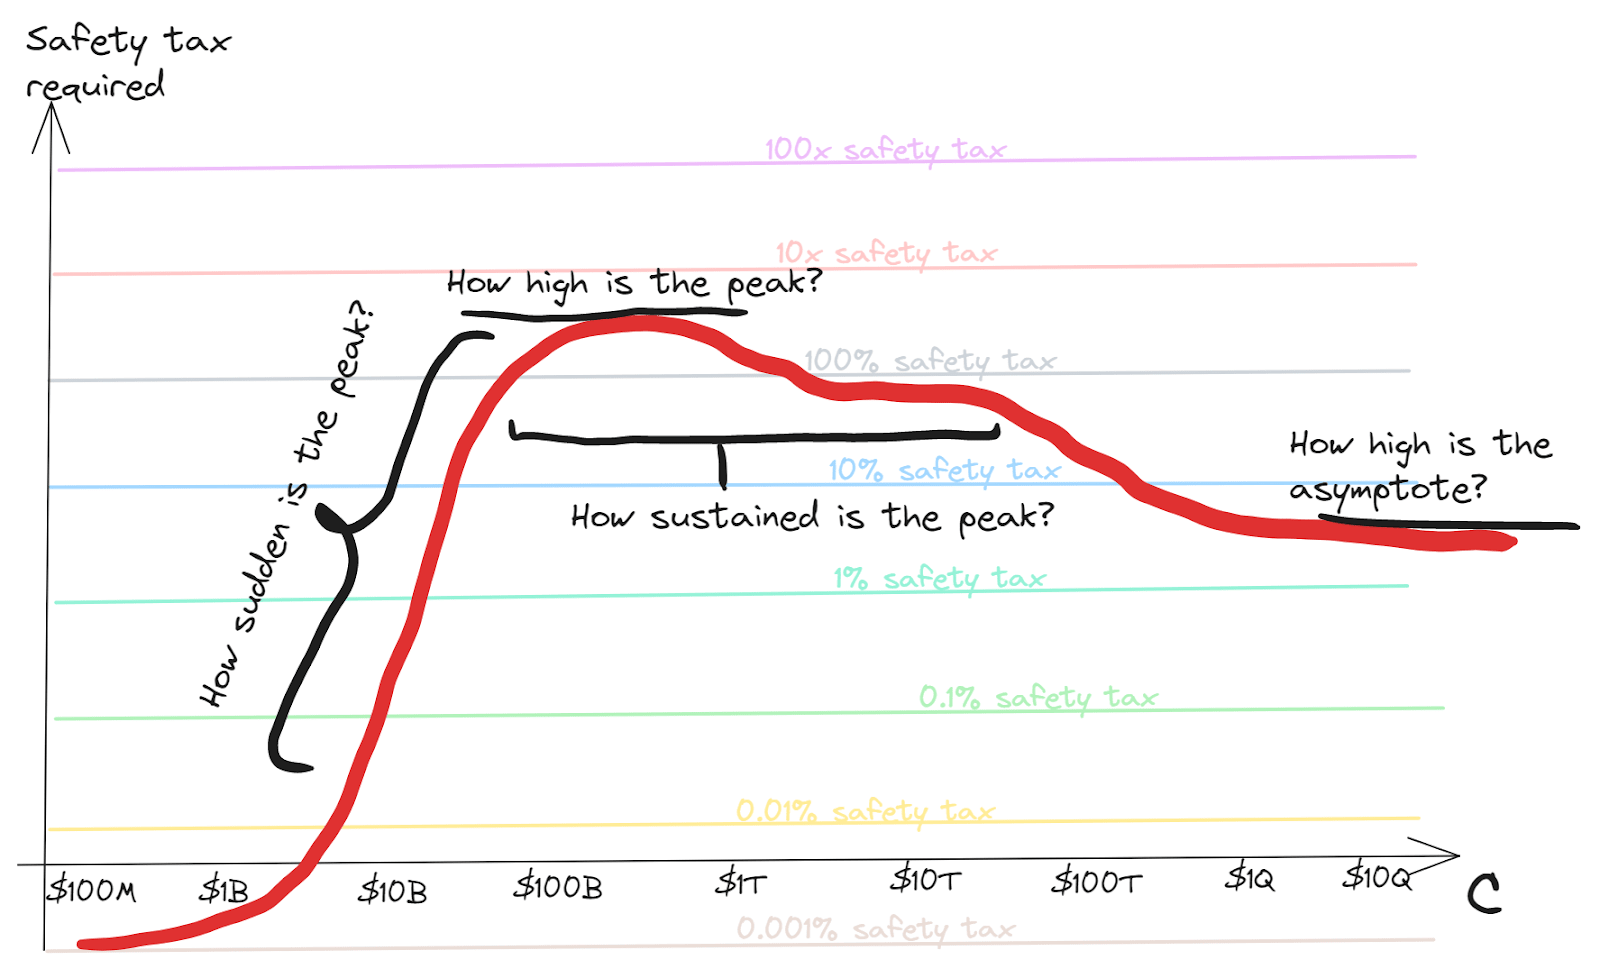
- How high is the peak safety tax requirement?
- The higher the total ratio of investment in safety:capabilities ever needs to get, the harder this seems. If we never have to pay more than 0.1% safety tax, we should have a relatively easy time of it; if we have have to pay 1000x we’re going to need some very serious coordination
- How sudden is the peak?
- A sharp rise in the required safety tax may be harder to coordinate to meet than a gradual increase
- Especially if capability boosts come in large jumps, then there may be a point just after getting one of these jumps where you need almost all marginal work to be safety for a little while
- A sharp rise in the required safety tax may be harder to coordinate to meet than a gradual increase
- How sustained is the peak?
- There may be more appetite for safety investment if it’s relatively a one-off
- How high is the asymptotic safety tax requirement?
- Eventually we might expect competitive dynamics to have time to assert themselves, so we’d like to know what the costs that are needed in a long-term way look like
And here is a visual representation of those questions:
I’ve talked here about “the peak”, and “the asymptote”. Here are some reasons to think these will exist:
- At technological maturity, there won’t be further important general information to discover about how to build better capabilities; nor about how to make things safer
- So the safety tax will be constant then, representing the work that’s needed to make things safe under optimal deployment of the technology
- This represents the asymptote
- At some point before then, not all of the research to find out how to do things safely has been done
- So the effective tax may be higher to cover this research as well as the eventual steady-state safety measures
- Since the safety requirements start small for powerless technologies, there should be a peak somewhere in the middle
Of course, there could be multiple peaks as the technology passes through different regimes. It’s also possible to have no peak higher than the asymptote (most likely if the safety research was all completed before efficiency research). But I think the typical case will have a highest peak that needs to be surmounted.
Safety tax contours
Of course, in all of these graphs so far we’ve been using an abstraction of “safe” vs “unsafe”. But safety isn’t a binary. There's always some risk, but further investment in safety can drive the risk down. This could mean that rather than a single curve, the underlying landscape has safety contours, something like this:
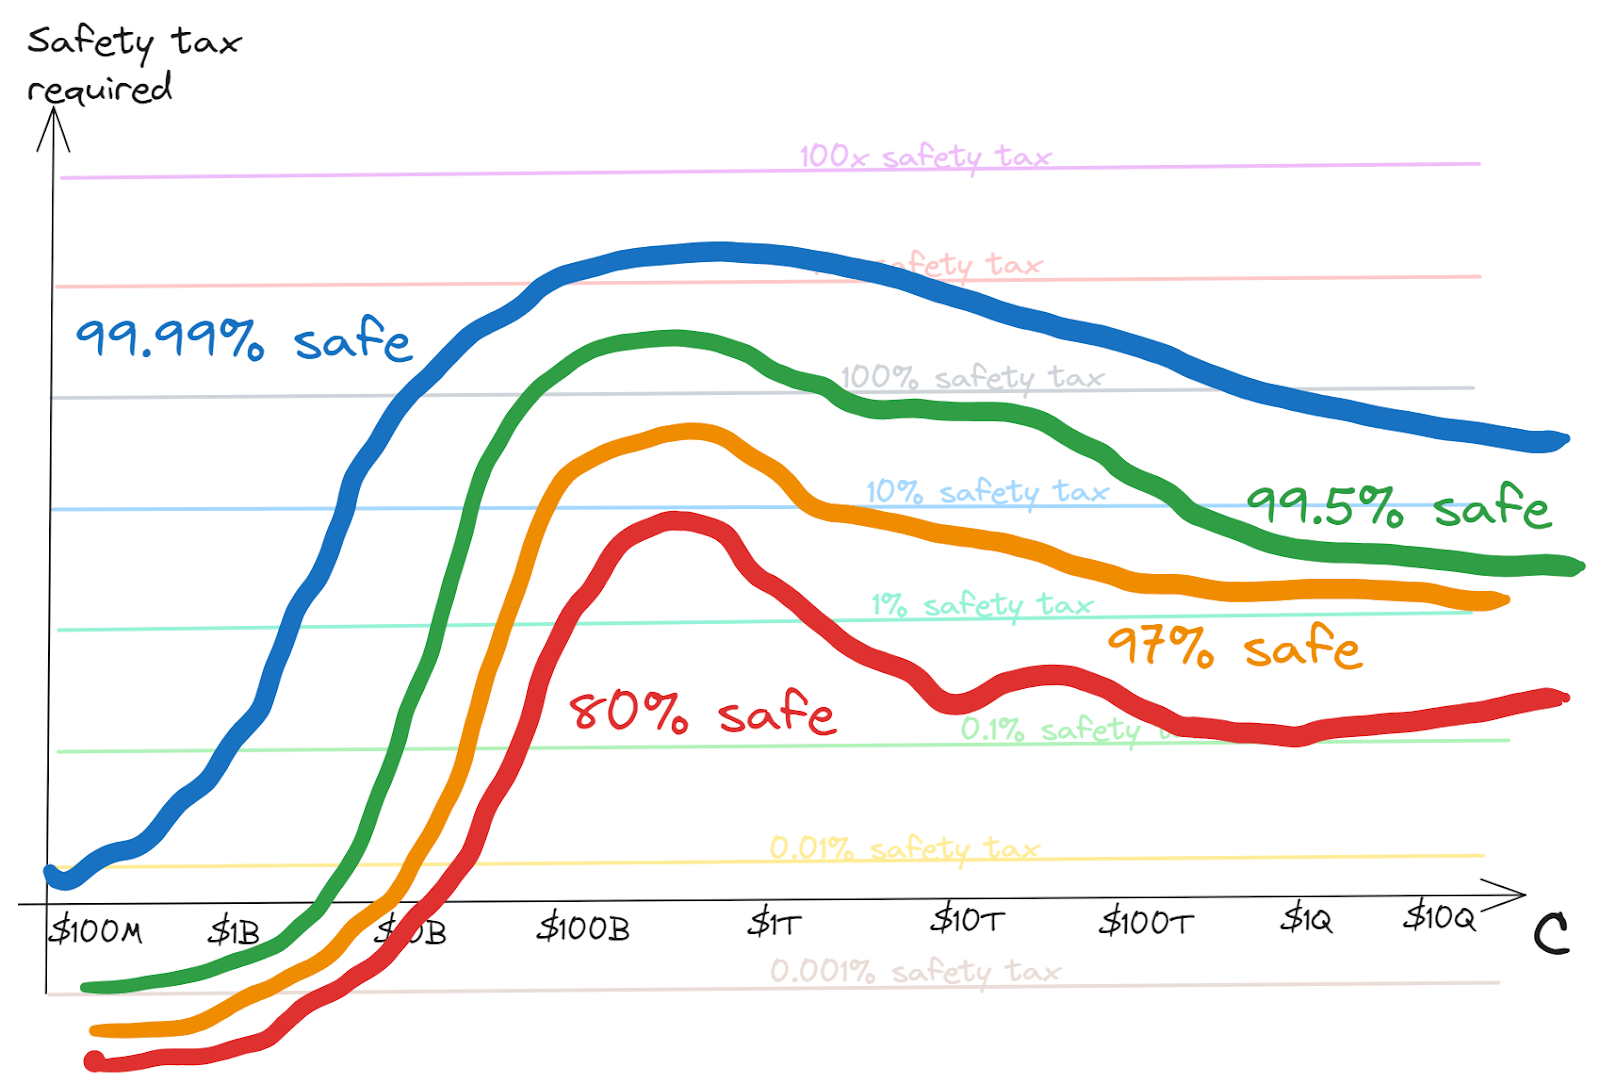
On this picture, each contour represents a fixed risk tolerance — i.e. it shows the safety investment required to stay within that tolerance level as capabilities scale.[2] Vice-versa, if you expect the world to coordinate to pay a given level of safety tax, you can read across to see which contours it intersects to infer the risk it would imply.
Sometimes we understand a problem pretty well, and being safer is just about having redundancy to accidents. In this case I think typically the contours will run relatively close to each other.
In other cases — such as, perhaps, AI safety — we may have little idea how hard the problem is. In this case our contours would be fairly spread out. Depending on the nature of our uncertainty, and our ability to recognise whether we’ve dealt with the problem at least after making the investments, the contours may narrow as we see how things go; or may stay spread out, if we aren’t getting the information to resolve ambiguities.
Possible extensions to the model
Of course there are a number of other ways in which the details of how things play out may deviate from the simple model I’ve presented here, including:
- The safety standards required in world-leading systems may differ from the minimum safety standards that everyone needs to follow
- We could maybe try to capture this with two different safety tax graphs …
- … but really it’s a continuum — the danger may be greater (or smaller) if world-leading system is miles ahead of the competition versus just barely ahead
- Capabilities and safety aren’t really scalars
- Different aspects of C and S may matter differently, or may matter at different times (e.g. if capabilities move from being driven by one paradigm to being driven by another, maybe the earlier investment ends up less relevant)
- I’ve represented both capabilities and tax as continuous variables, but it’s unclear how appropriate this is
- Coordinating to pause capabilities work to let safety catch up might look relatively different in worlds where these variables are quite continuous, versus ones where they are not
- Sequencing and serial time could matter
- Maybe there are some types of safety work that you can only meaningfully start after achieving a certain capabilities level
- Maybe there are things it takes time to learn to use, or to need to think through
A deeper dive into the topic might want to look for ways to capture these additional dynamics. Nonetheless, my hope is that this zoomed out conceptual picture may be helpful getting an intuitive grasp of the basic strategic dynamics.
Acknowledgements: Thanks to Raymond Douglas and Tom Davidson for helpful comments.
- ^
It’s still a bit messy — since we’re measuring the total cumulative investment in capabilities and safety, this includes both upfront research cost and marginal implementation cost; but that means that technically the graph depends on how much of each of these we do. For practical economic purposes, the two are probably fairly linked, so I won’t worry about this too much.
- ^
I’m being vague about what a particular risk level means. This is a high-level analysis which should apply to any particular operationalization.
0 comments
Comments sorted by top scores.