Contra StatNews: How Long to Herd Immunity?
post by AppliedDivinityStudies (kohaku-none) · 2021-01-20T22:06:43.817Z · LW · GW · 0 commentsContents
  1)  Dr. Nayer Misrepresents the Evidence  on Monthly Infection Rates
  2) What is the Actual Monthly Infection Rate?
  3)  Conclusion: How Long to Herd Immunity?
  Sources
  Appendix: Details on Parameter Values and Questionable Assumptions
  Frequently Asked Questions
  Footnotes
None
No comments
Cross post from applieddivinitystudies.com/stat-immunity Warning: Speculative armchair epidemiology. All emphasis mine. See also Youyang Gu's projection.
Summary: In an article for Stat, Dr. Zach Nayer misrepresents research, makes indefensibly flawed assumptions, and fumbles basic arithmetic. Per CDC, actual US Covid cases are 4.6x higher than reported, and currently around 2.4x higher. Using improved parameters, our toy model finds that herd immunity may occur in less than 4 months, although neither estimate should be taken too seriously. It all depends on the transmissibility of the new strain, as well as our ability to ramp up vaccine production, distribution and acceptance.
1) Dr. Nayer Misrepresents the Evidence on Monthly Infection Rates
Last month, Dr. Zach Nayer [1] at Stat published an estimate of time to herd immunity, suggesting that without vaccines it may take as long as 55 months.
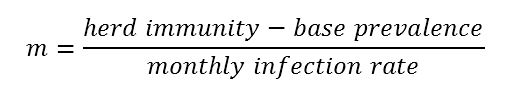
The model itself is straightforward. Assume we need to hit 75% immunity, then figure out when we'll get there based on existing prevalence and monthly infection rate:
Unfortunately, Nayer's parameters are totally off. Citing a study which found antibody prevalence of 9.3%, Nayer writes:
In late September, a Stanford study estimated that 9.3% of Americans have antibodies against SARS-CoV-2.... If the base prevalence at the end of September --- eight months from the onset of the epidemic in the United States on January 21, 2020 --- was 9.3%, the coronavirus has an infection rate of approximately 1.2% of the population per month.
But take a closer look. Although the study was published in September, it was based on data collected in July. As the authors make explicit:
Our goal was to provide a nationwide estimate of exposure to SARS-CoV-2 during the first wave of COVID-19 in the USA, up to July, 2020
Instead of dividing 9.3% by an eight month range, Nayer should have used the 6 months from January through July. This yields an estimated monthly infection rate of 1.6% rather than 1.2%.
To his credit, Nayer attempts to confirm this result against another source of data, but fumbles the arithmetic. He writes:
one study [estimates] 52.9 million infections in the U.S. from February 27 to September 30, or an infection rate of 1.3% per month.
52.9 million infections is 16% of the US population. Over a 7 month time period, that's a monthly infection rate of 2.3% per month, nearly double Nayer's result.
Of course, the biggest problem with Nayer's parameters is not even that he's misinterpreted historical studies, it's that he naively projects them into the future.
Nayer's prediction isn't based on linear growth or exponential growth, it's based on 0 growth. He assumes that historical cases will be a good proxy for future cases, including the February base rate of 17 total confirmed monthly cases, and then uncritically takes this base rate as a future projection.
2) What is the Actual Monthly Infection Rate?
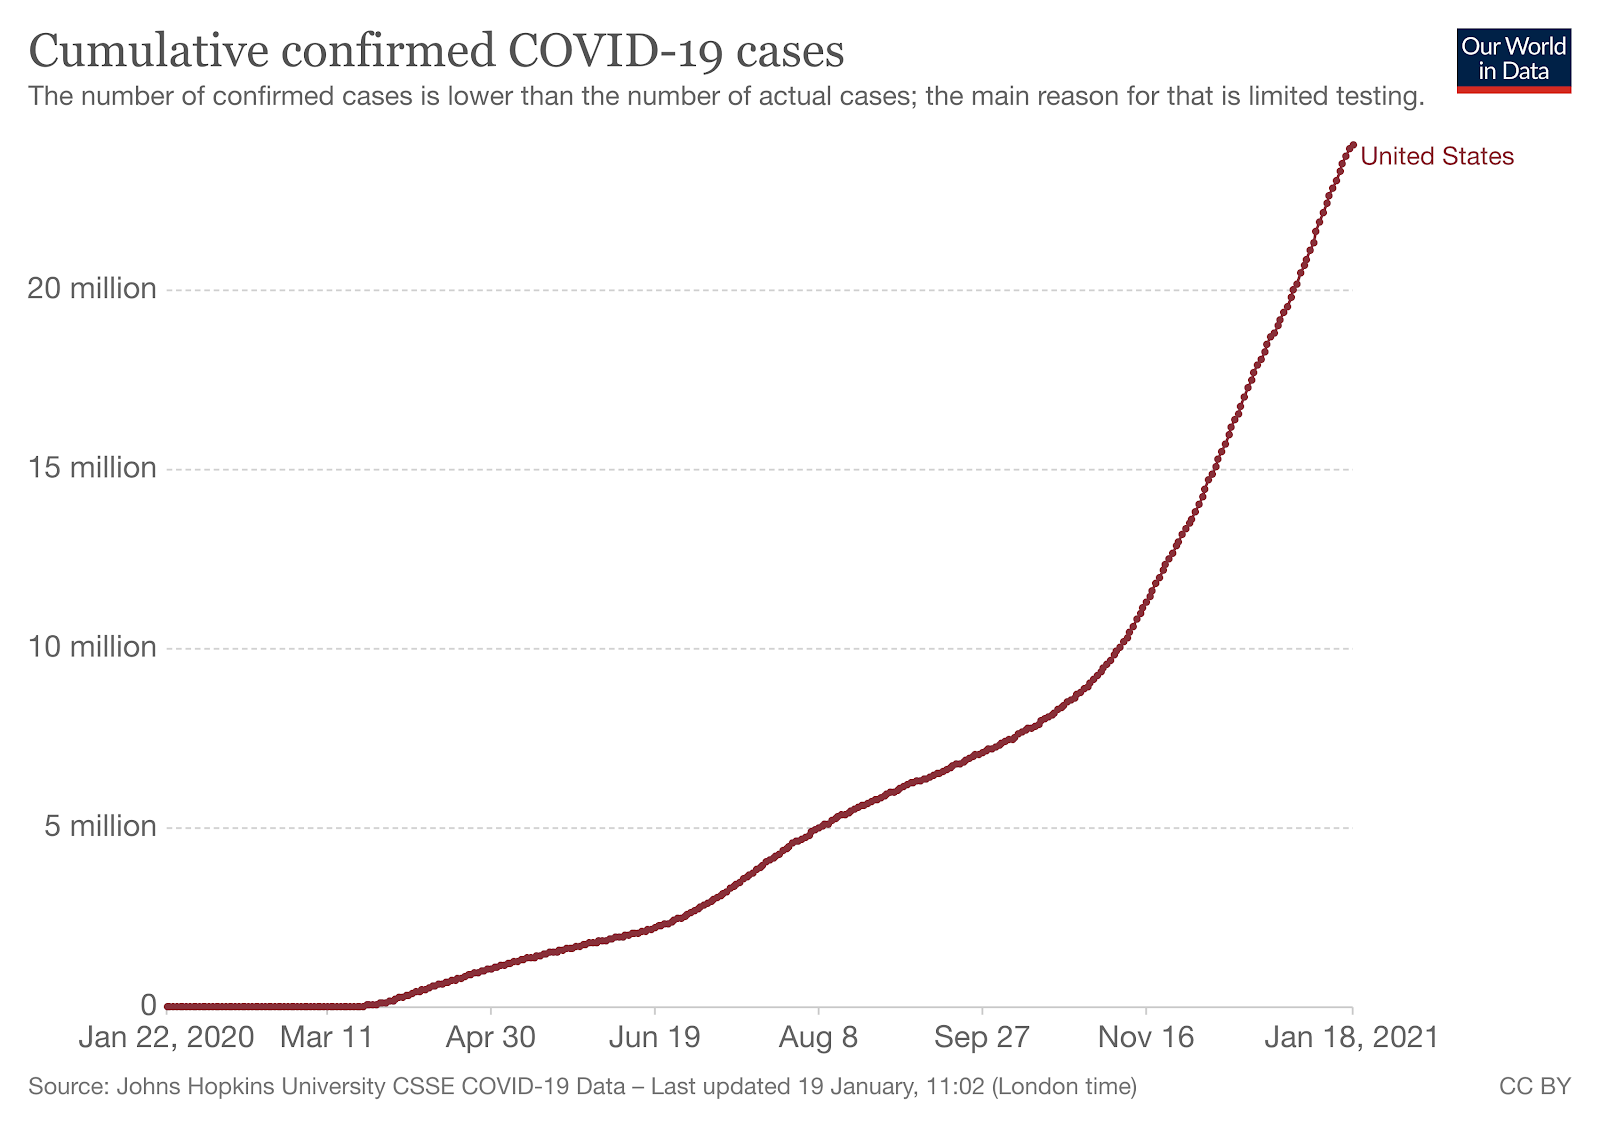
Rather than start in January, we can consider the monthly infection rate for December, the month Nayer's article was published. That month, cumulative confirmed cases rose from 13.8 million, up to 20 million, for 6.2 million new cases, or a monthly infection rate of 1.9%.
But remember, confirmed cases are not a good proxy for actual infections. Nayer's cited research reported 9.3% antibody prevalence in July, equivalent to 31 million total cases. Meanwhile, only 4.56 million cases had actually been confirmed by July 31st, suggesting a confirmed-to-actual multiple of 6.8x. Using this multiple, December's 6.2 million confirmed cases represent 42.16 million actual cases, for a 12.8% monthly infection rate.
But again, that data is from July, and testing may have improved since such that a greater number of actual cases are correctly reported.
In late November, CDC researchers set out to estimate cumulative incidence by correcting for undercounting. They report 52.9 million total infections through the end of September, even though only " 6.9 million laboratory-confirmed cases of domestically acquired infections were detected and reported". That implies a multiple of 7.67x, or as the authors write:
This indicates that 1 in 7.7, or 13% of total infections were identified and reported.... Our preliminary estimates indicate approximately 1 in 8, or 13%, of total SARS-CoV-2 infections were recognized and reported through the end of September
If this multiple held true in December, it would imply 47.7 million new infections, or 14.5% of the population.
Most recently, the CDC reports 83.1 million total infections through December. Since there were 20 million confirmed cases, that's a multiple of 4.2x, and an actual monthly infection rate for December of 7.8%. [2] They also report a 4.6x multiple for total COVID--19 infections reported.
Having said that, if we were undercounting by 7.7x through September, and by 4.2x overall, that implies we were undercounting by less than 4.2x after September. With 52.9 million actual cumulative cases as of 9/30 and 83.1 as of 12/31, we can infer 30.2 million actual new cases in between. By comparison, confirmed cumulative cases rose from 7.27 million to 20.03 million in the same period, for 12.76 million confirmed new cases. Using this estimate, the confirmed-to-actual multiple since September is 2.4x.
Here's a table of monthly infection rates, depending on how you measure it. Full table and sources in the original post:
Estimate | Monthly Infection Rate (% of US Population) Dr. Nayer's Stat Article | 1.3% Anand et al. January - July | 1.6% Reese et al. February – September | 2.3% December, confirmed cases | 1.9% December, 6.8x multiple | 12.8% December, 7.7x multiple | 14.5% December, 4.6x multiple | 8.7% December, 2.4x multiple | 4.6%
Of these, I think 4.6% is the best estimate, though note that there is a lot of uncertainty as to which multiple applies best for December, as well as underlying uncertainty in the original studies. [3]
In any case, Nayer's 1.3% estimate was substantially off. It was the result of flawed arithmetic, a misreading of his cited study, and the incredibly naive assumption that the January - July average would project into the future with no growth.
3) Conclusion: How Long to Herd Immunity?
Using the CDC's estimate of 25% base prevalence, a monthly infection rate of 4.6% and Nayer's original model, we'll achieve 70% immunity in 8 months.
Incorporating further information about vaccinations, antibody loss and a more pessimistic 80% threshold, my best guess is herd immunity by July 3rd. You can find detailed explanations for these parameters in the appendix.
You should not interpret these estimate too seriously.
Here's an abbreviated table of results based on vaccine acceleration rate (how many more vaccinations today than yesterday), and herd immunity threshold. Formatted table in the original post:
Threshold | 10k | 30k | 50k
70% immune | 6/4 | 4/27 | 4/9
80% immune | 6/27 | 5/11 | 4/21
90% immune | 7/19 | 5/24 | 5/1
Edit: After talking to Alvaro again, I am less confident about antibody loss. See footnote 6 for a revised table.
I hope this is of interest, but do not let the table of results fool you into thinking this is a rigorous model with well tested assumptions. It assumes, in decreasing order of certainty:
- Vaccines last several years
- Antibodies last 8 months [6]
- One administered dose is "worth" 50% as much as a full infection
- There is a 2.4x multiple between December's confirmed cases and actual infections
- No one who already has antibodies receives a vaccine
- We administer 50,000 more vaccines each day than the day before [7]
- Confirmed cases remain at 200,000 / day
In particular, the last two are totally up in the air.
There is a new strain, soon to be a new administration, and we can still do dramatically better than we have done so far. Predictions are helpful, but the important thing is to actually create the future we want.
Even stupid models can be useful. In this case, I hope the findings illustrate how sensitive our timeline is to an accelerated vaccination schedule, and highlight the urgency of ramping up distribution.
Sources
Original Article Models in Google Sheets Data from Our World in Data on cases and vaccines Multiples:
- 6.8x: Anand et al.
- 7.7x: Reese et al.
- 4.6x: CDC
- 4.2x: CDC, computed based on 83 million actual vs 20 confirmed
- 2.4x: Computed, "With 52.9 million actual cumulative cases as of 9/30 and 83.1 as of 12/31, we can infer 30.2 million actual new cases in between. By comparison, confirmed cumulative cases rose from 7.27 million to 20.03 million in the same period, for 12.76 million confirmed new cases. Using this estimate, the confirmed-to-actual multiple since September is 2.4x." The 52.9 is from Reese et al, 83.1 from CDC. Confirmed cases from Our World in Data.
Appendix: Details on Parameter Values and Questionable Assumptions
So far, out model has relied on a number of untenable assumptions:
- Cases will remain at December levels
- Antibodies last indefinitely
- There are no vaccinations
Forecasting cases Cumulative cases have been rising exponentially at a fairly consistent rate since April, so it might feel easy to project into the future.
Having said that, I am not very confident that the trend will hold. Given that we are ramping up vaccine distribution, facing a more transmisible strain, and launching a new administration, there is much more uncertainty to come. [4]
I'll continue to use December's estimated rate of 4.6%, and accept that I am making the same mistake as Nayer in assuming no growth, with the hope that I am at least doing so with better reason. Let this be an additional warning that this model is purely for illustrative purposes, and should not be taken too literally.
Antibodies With regards to antibodies, there appears to be some ongoing controversy. A recent study from Science Immunology found "infection generates long-lasting B cell memory up to 8 months post-infection"; however, another second study suggests it might be shorter. Discussion of the conflict here.
In 8 months, we will start to see more and more re-infections as time goes on. There were 1.5 million confirmed cases 8 months ago, which is 11.6 million using the 7.7x multiple. It is possible all of their antibodies have now "expired".
If we have to wait another 6.2 months, everyone infected until November 25th could lose their antibodies as well. That's 12.9 million confirmed cases, or 59.3 million actual cases using the CDC's 4.6x multiple.
As a first approximation, that's another 5 month delay, but note that it cascades. As we wait to "make up" for the 59.3 million lost antibodies, more and more people's antibodies will "expire".
At a monthly infection rate of 4.6% and 8 month "shelf-life" for antibodies", we will never be able to hit more than 36.8% immunity at any time. Under this model, we never achieve herd immunity at current infection rates, even for conservative estimates.
In absolute numbers, 70% herd immunity would mean 231 million people with antibodies simultaneously. If antibodies last 8 months, that means we would need to hit 29 million cases per month, and sustain that continuously for 8 months. That's all assuming that everything immediately clears up on the day we achieve herd immunity.
Given out current growth rate, and the increased transmissibility of a new strain, those numbers might be more achievable than they sound. Our recent high of 0.25 million cases in a single day (7-day rolling average) extrapolates to 7.6 million cases per month. With the 2.4x multiple, that's 18.2 million cases.
Although I say "achievable", this would not actually be a good thing. We would defeat the virus, but only through immense human sacrifice.
Vaccines Okay, so it's looking quite bad, can vaccines save us? You may have heard that vaccines are 90% or 95% effective, but that's for preventing symptoms, not preventing transmission through asymptomatic infection.
A Moderna report to the FDA writes:
Amongst baseline negative participants, 14 in the vaccine group and 38 in the placebo group had evidence of SARS-CoV-2 infection at the second dose without evidence of COVID-19 symptoms. There were approximately 2/3 fewer swabs that were positive in the vaccine group as compared to the placebo group at the pre-dose 2 timepoint, suggesting that some asymptomatic infections start to be prevented after the first dose.
More recently, Tyler Cowen cites this article claiming that Pfizer vaccine is very effective in preventing transmission. The author writes "Data from 102 subjects shows 98% of them developed significant presence of antibodies; survey's editor says participants most likely won't spread the disease further" I am not sure what "most likely" means, but I'll take it at face value.
Okay, so we have data on sterilizing immunity and vaccine administration, the problem is we don't know how much of the latter is first vs. second doses. I also don't know if being "66% immune" is worth 66% as much as full immunity. So a few simplifying assumptions:
- Each vaccine dose is "worth" 50% of full immunity
- No one who already has antibodies receives a vaccination
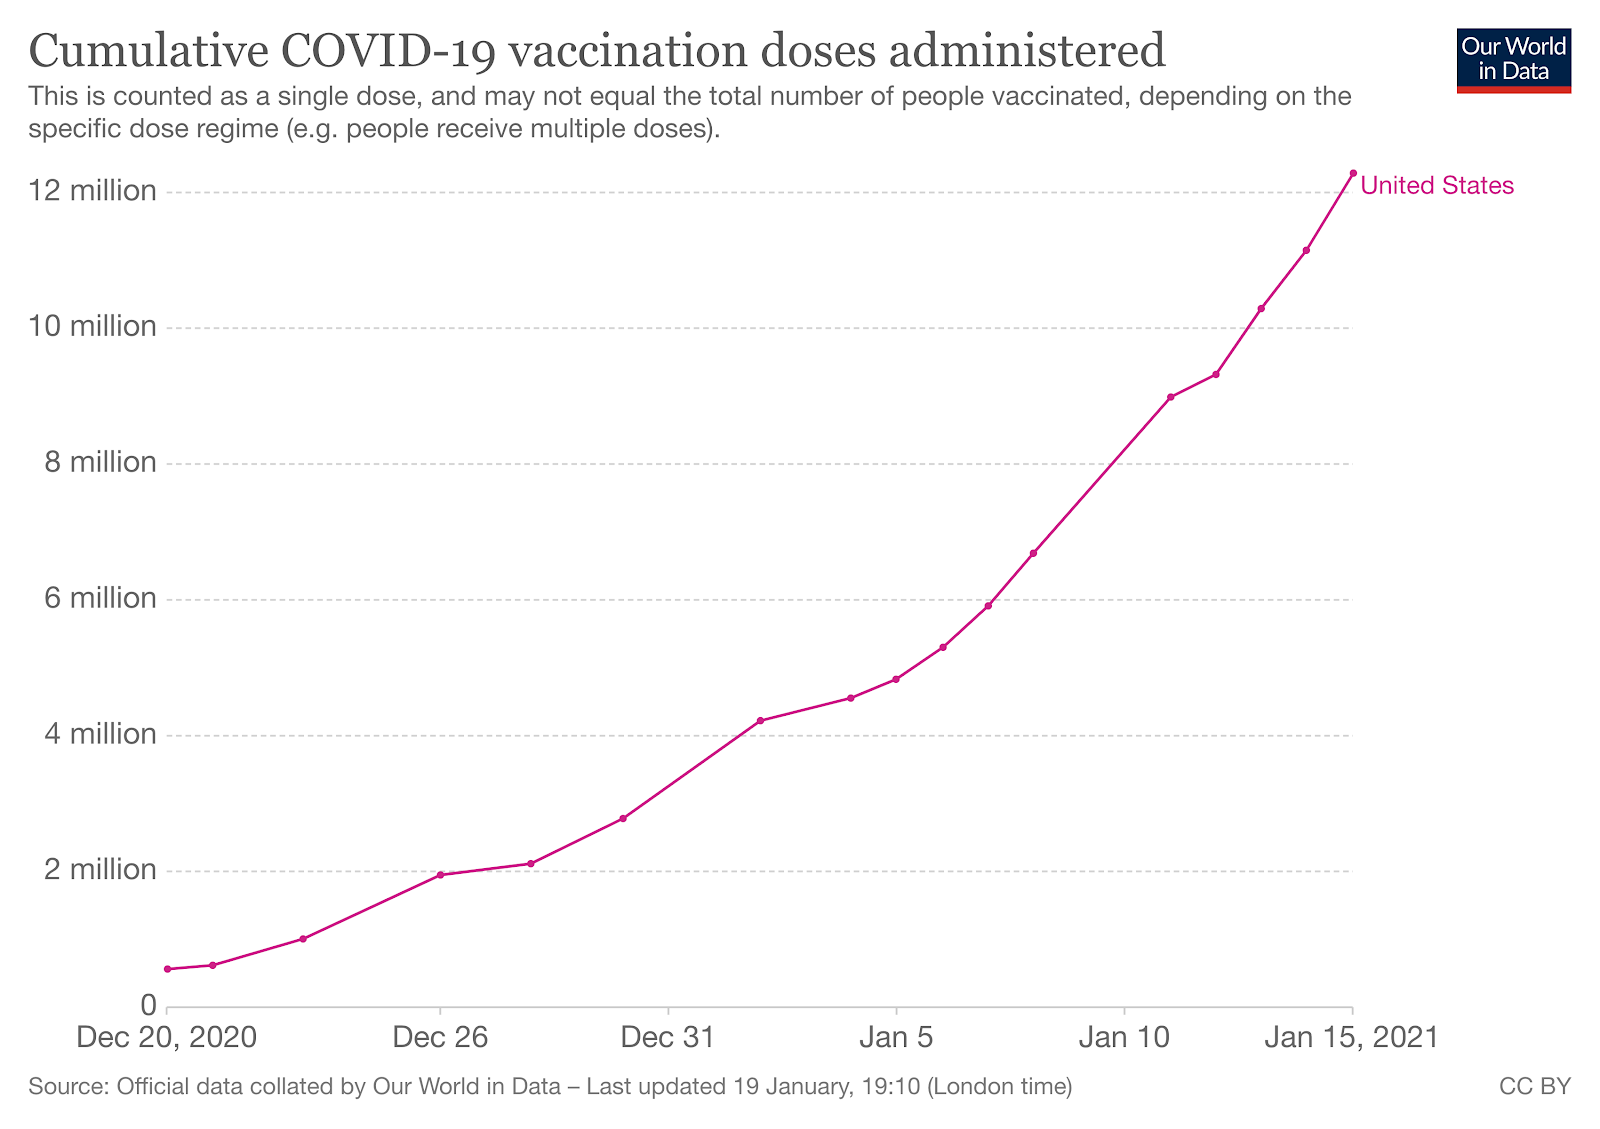
- We administer 50,000 more vaccines each day than the day before [5]
Using this model (available here), I estimate 70% immunity on April 2nd, and 90% immunity on April 24th.
With sufficiently high vaccination, it turns out lost antibodies are just not that big a deal. 8 months before April 24th was August 24th, at which point we had 5.73 million confirmed cases. Using the CDC's 7.7 multiple, that's 44.1 million actual.
But even if 27 million people lose their antibodies, our model has vaccinations at nearly 6 million / day by April 24th, so the delay isn't that costly. Incorporating antibody loss, we only get pushed back to April 17th for 70% immunity, and May 6th for 90%.
There is also a cascading loss of antibodies between April 24th and May 6th, but this only pushes out estimates by another day or so.
What if 50,000 more vaccines per day is too optimistic? Alvaro mentions this Metaculus estimate giving 82.5 million by May 13th. Note that the 82.5 million refers not to administered doses, but to people who have completed both vaccinations, so this is 165 million doses total. That's consistent with around 10,000 more vaccines per day, rather than the 50,000 I suggest.
Frequently Asked Questions
Why do you care? Stat isn't an academic publication and it's not peer reviewed. No, but they are widely acclaimed, and often cited on Marginal Revolution. Until now, I would have felt confident taking their word at face value.
How poorly does this reflect on Stat? To Stat's credit, Dr. Nayer is not a regular contributor. His forecast was also not presented as a serious prediction, but was mostly intended to illustrate the importance of vaccines. Even there, it is bad that he made these basic errors, and it is bad that Stat did not fact check his writing.
Anyone can make mistakes. If you're emboldened by my findings, you should go and run checks against more articles and try to find additional errors. Perhaps this is a one-off mistake, or perhaps there is a more systematic problem.
Why do you use different multiples at different points? The CDC estimates a 4.6x multiple overall, but previously reported a 7.7x multiple for data up to September. Based on those numbers, I inferred a 2.4x multiple for data after September.
In section 4, I use a 7.7x multiple for cases before September to estimate antibody loss. I also use a but a 2.4x multiple for December's cases which I'm using as our monthly infection rate. I also use the overall 4.6x multiple in one paragraph referring to data across a broad range of time:
If we have to wait another 6.2 months, everyone infected until November 25th could lose their antibodies as well. That's 12.9 million confirmed, or 59.3 million actual using the CDC's 4.6x multiple.
Okay, but really, when can I go outside? I have no idea. If you put a gun to my head, I would say cases rise more than expected, and vaccinations go worse than expected, but I don't know how those factors balance out. Maybe early summer, but it is still in our collective power to do better.
This isn't a question, I just need a reason to feel optimistic. I have been using a flat rate of infections, but they have been growing quite rapidly historically. If this remains true, the timeline would be greatly accelerated. A new strain might increase infections as well. That's all bad news for America, but if you're a cautious introvert taking appropriate precautions, it might be good news for you.
There is also hope on the vaccine side. Biden claims the Trump administration is to blame for distribution delays. I don't know if this is true, but it could be, and it could mean improved distribution starting today! So far we have seen vaccines administered per day increase rapidly, but there may be a 2nd degree acceleration as well (i.e. the daily increase is itself increasing).
Also note that if you live in a hot spot, your region may achieve herd immunity before the nation as a whole.
Footnotes
[1] I am not an epidemiologist, but for the record, neither is he. As per his bio on StatNews: "Zach Nayer is a transitional year resident physician at Riverside Regional Medical Center in Newport News, Va., and an incoming ophthalmology resident at Harkness Eye Institute at Columbia University in New York City."
[2] 4.2 is the multiple I get by dividing 83.1 million by 20 million reported cases, but the CDC states a multiple of 4.6 for "total COVID--19 infections were reported". I don't know how to explain the discrepancy.
[3] The CDC's 95% UI for "total COVID--19 infections were reported" is a multiple of 4.0 -- 5.4. Anand et al. report 9.3% with a 95% CI of 8.8%--9.9%. Reese et al. does not provide a CI for the 7.7x, but gives an related 7.1x multiple a 95% UI of 5.8-9.0.
[4] If you're curious, you can look at Zvi's toy models.
[5] This is really just guesswork. 50,000 is based on the rate of increase from January 5th to January 15th. If you started counting 1/1 you would get 35,000, and if you started 12/21 you would get 30,000. Using 10,000 gets us consistent with the Metaculus estimate.
[6] I expressed confidence after seeing "8 months" cited in multiple reports, but this may be limited by the data we have available. It seems the studies may actually be saying "at least 8 months". From Dan et al.:
Overall, at 5 to 8 months PSO, almost all individuals were positive for SARS-CoV-2 Spike and RBD IgG.... Notably, memory B cells specific for the Spike protein or RBD were detected in almost all COVID-19 cases, with no apparent half-life at 5 to 8 months post-infection... These data suggest that T cell memory might reach a more stable plateau, or slower decay phase, beyond the first 8 months post-infection.
Thanks to Alvaro for pointing this out. Here's a revised table of results, removing antibody loss considerations from the model:
Threshold | 10k | 30k | 50k
70% immune | 5/15 | 4/16 | 4/2
80% immune | 6/6 | 4/30 | 4/13
90% immune | 6/26 | 5/13 | 4/24
[7] I do worry that there's some kind of logistical maximum rate of vaccinations, and it is not realistic to think we could ever be at 6 million / day. You may have heard that NYC alone did 400,000 vaccines / day in 1947, but that was a very different problem. Note also that this depends on vaccines actually being accepted! As I wrote in the appendix here, trust is still low, though it depends on who you ask, and may increase as more people get the vaccine.
0 comments
Comments sorted by top scores.