How should we compare neural network representations?
post by jsteinhardt · 2021-11-05T22:10:18.677Z · LW · GW · 0 commentsContents
No comments
Cross-posted from the BAIR Blog.
To understand neural networks, researchers often use similarity metrics to measure how similar or different two neural networks are to each other. For instance, they are used to compare vision transformers to convnets [1], to understand transfer learning [2], and to explain the success of standard training practices for deep models [3]. Below is an example visualization using similarity metrics; specifically we use the popular CKA similarity metric (introduced in [4]) to compare two transformer models across different layers:
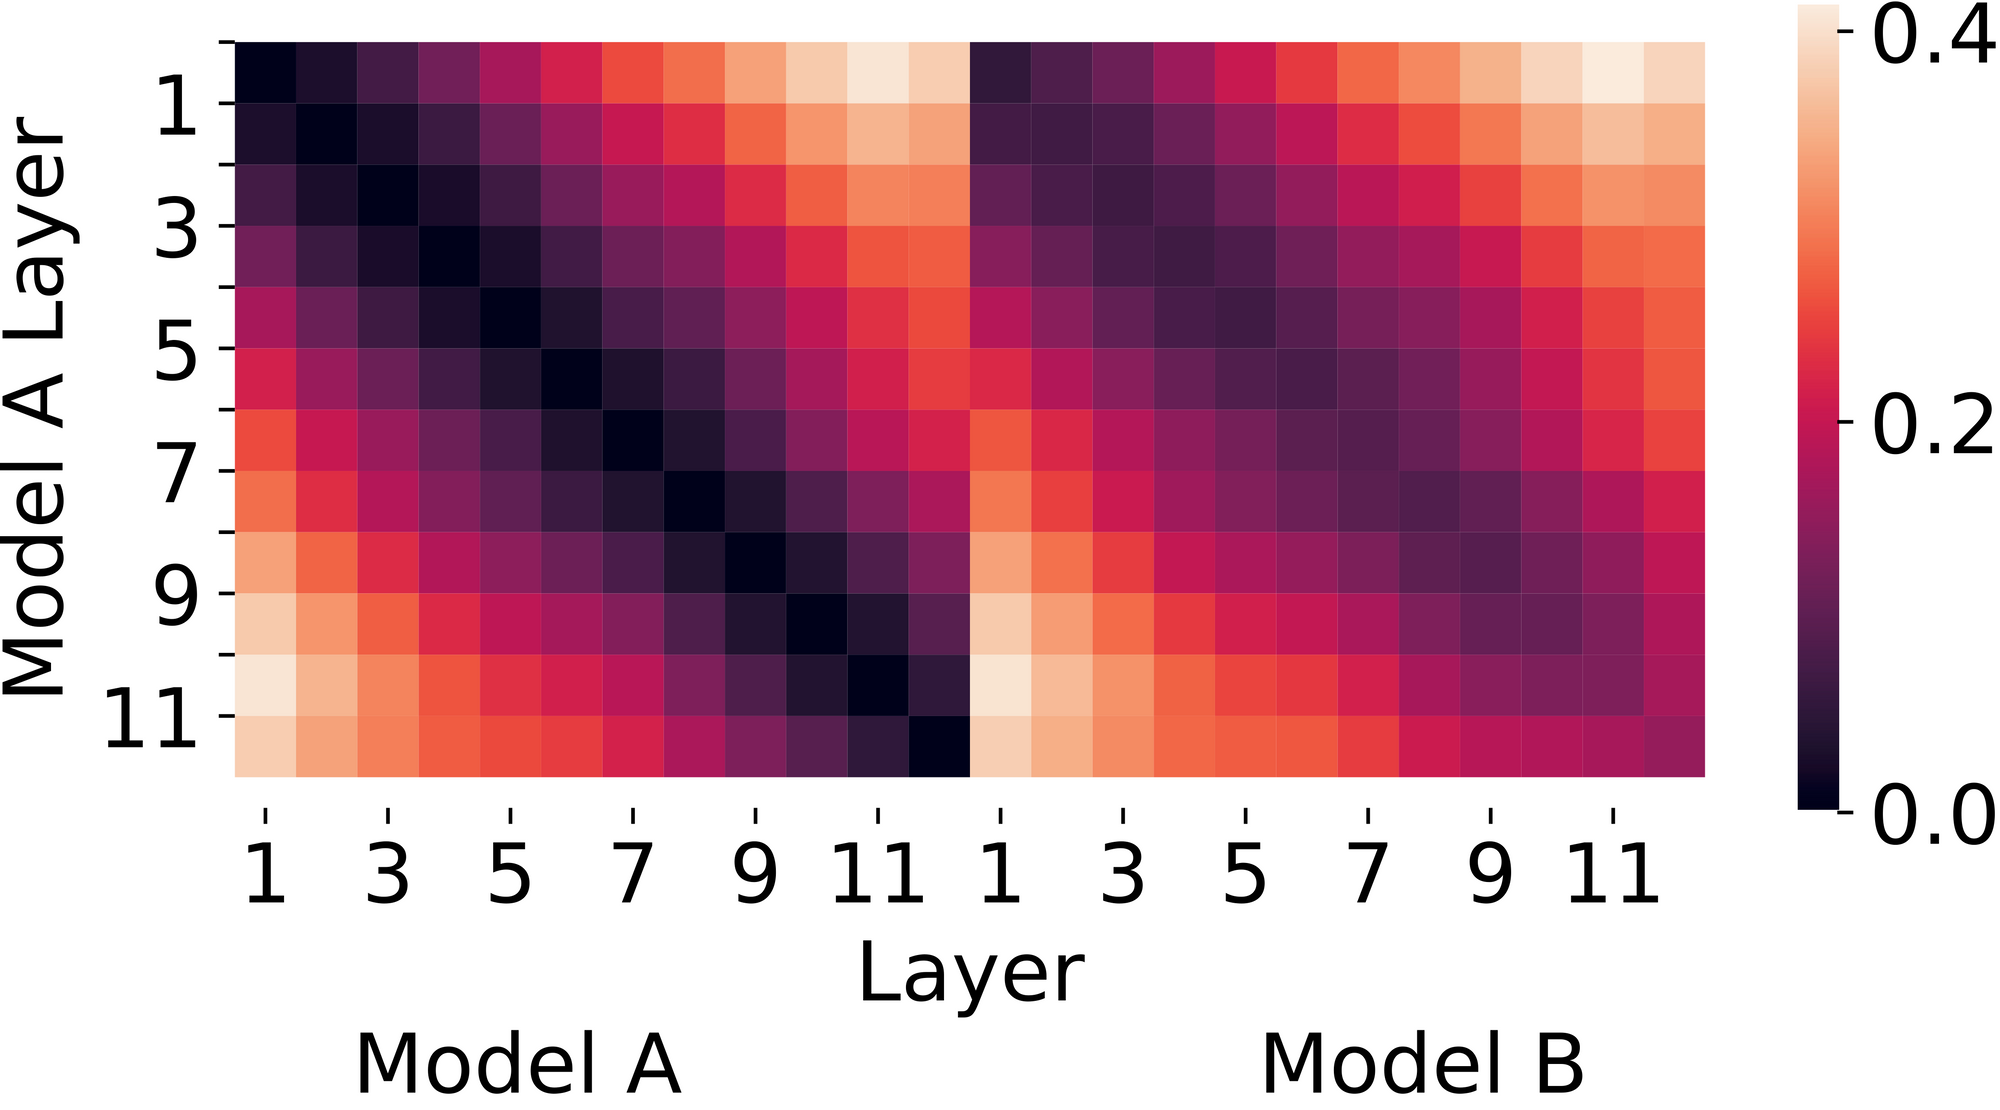
Figure 1. CKA (Centered Kernel Alignment) similarity between two networks trained identically except for random initialization. Lower values (darker colors) are more similar. CKA suggests that the two networks have similar representations.
Unfortunately, there isn't much agreement on which particular similarity metric to use. Here's the exact same figure, but produced using the Canonical Correlation Analysis (CCA) metric instead of CKA:
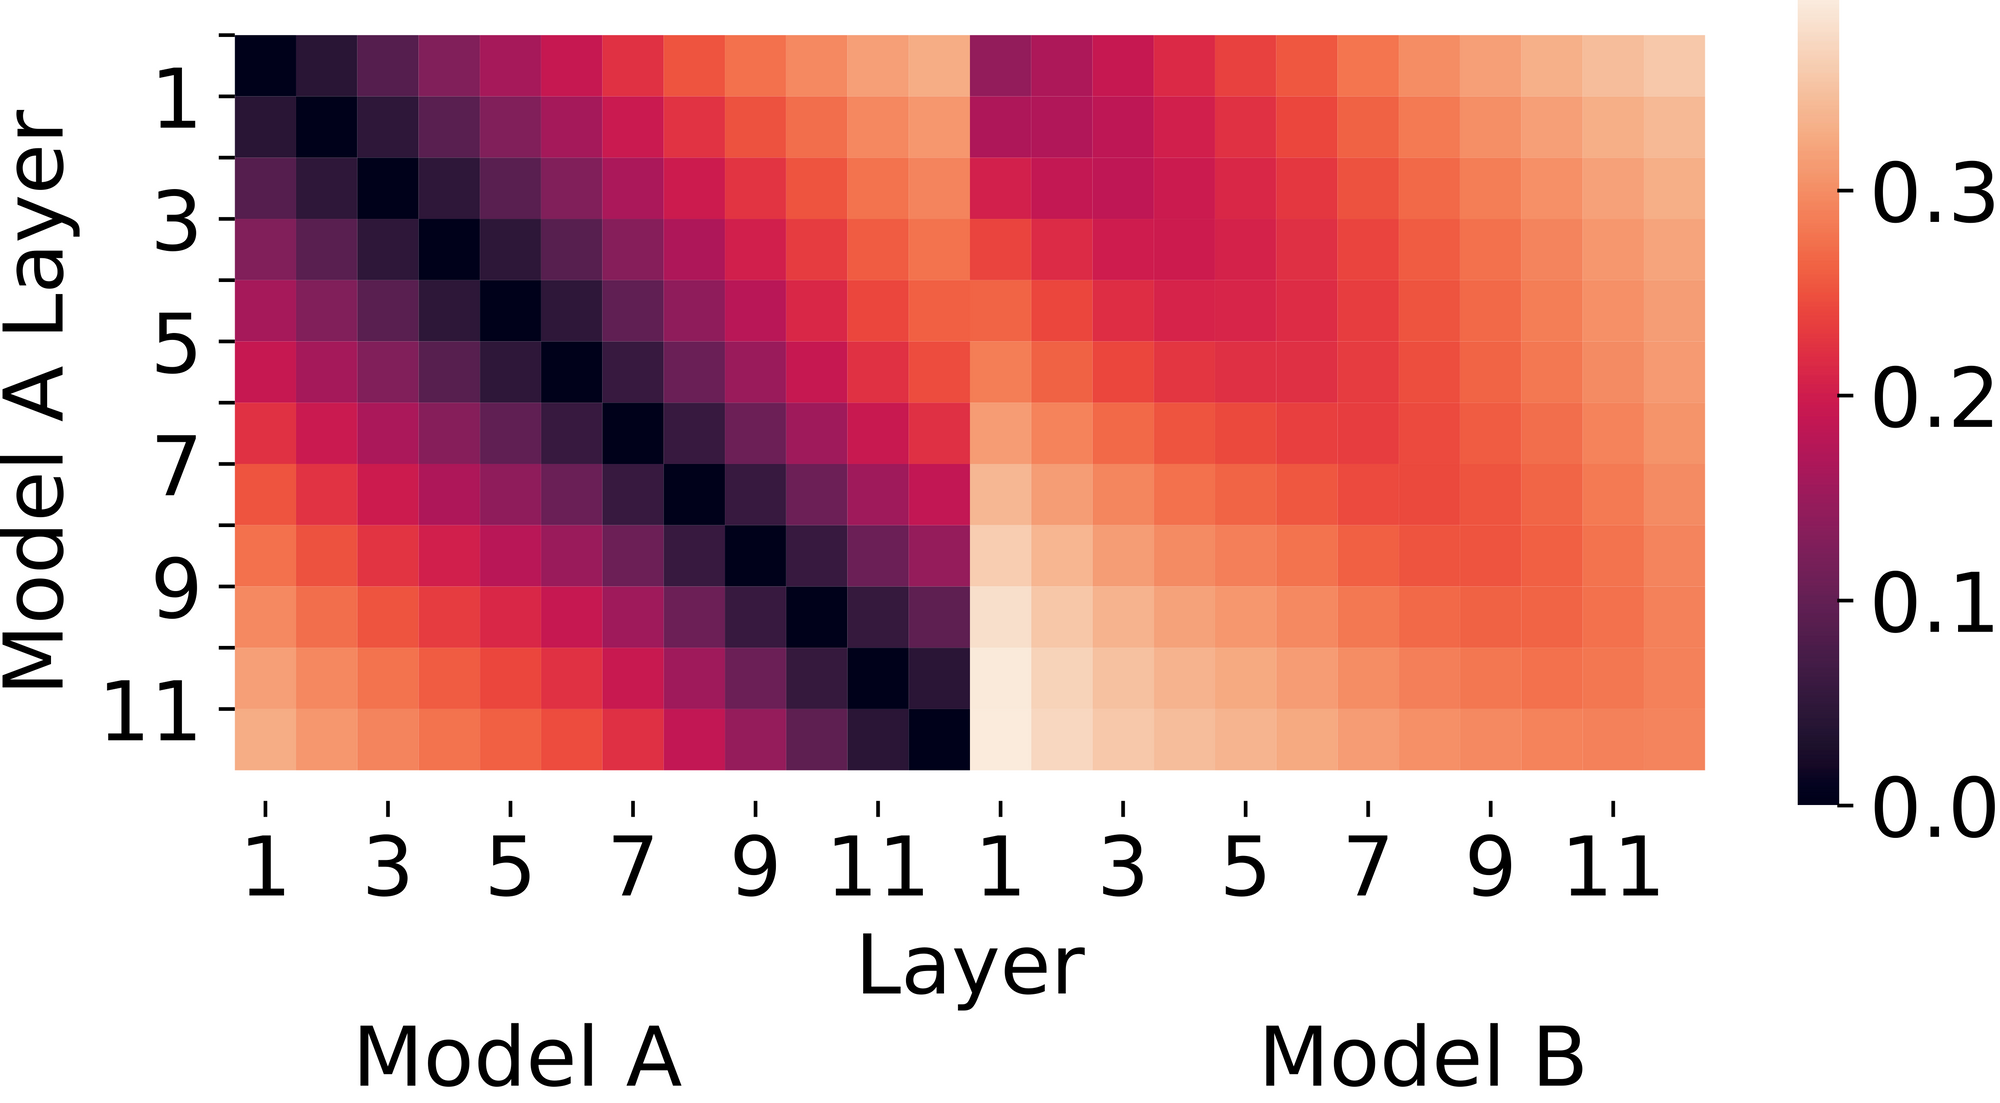
Figure 2. CCA (Canonical Correlation Analysis) similarity between the same two networks. CCA distances suggest that the two networks learn somewhat different representations, especially at later layerss.
In the literature, researchers often propose new metrics and justify them based on intuitive desiderata that were missing from previous metrics. For example, Morcos et al. motivate CCA by arguing that similarity metrics should be invariant to invertible linear transformations [5]. Kornblith et al. disagree about which invariances a similarity metric should have, and instead argue that metrics should pass an intuitive test - given two trained networks with the same architecture but different initialization, layers at the same depth should be most similar to each other - and their proposed metric, CKA, performs the best on their test [4].
Our paper, Grounding Representation Similarity with Statistical Testing, argues against this practice. To start, we show that by choosing different intuitive tests, we can make any method look good. CKA does well on a "specificity test" similar to the one proposed by Kornblith et al., but it does poorly on a "sensitivity test" that CCA shines on.
To move beyond intuitive tests, our paper provides a carefully-designed quantitative benchmark for evaluting similarity metrics. The basic idea is that a good similarity metric should correlate with the actual functionality of a neural network, which we operationalize as accuracy on a task. Why? Accuracy differences between models are a signal that the models are processing data differently, so intermediate representations must be different, and similarity metrics should notice this.
Thus, for a given pair of neural network representations, we measure both their (dis)similarity and the difference between their accuracies on some task. If these are well-correlated across many pairs of representations, we have a good similarity metric. Of course, a perfect correlation with accuracy on a particular task also isn’t what we’re hoping for, since metrics should capture many important differences between models, not just one. A good similarity metric is one that gets generally high correlations across a couple of functionalities.
We assess functionality with a range of tasks. For a concrete example, one subtask in our benchmark builds off the observation that BERT language models finetuned with different random seeds will have nearly identical in-distribution accuracy, but widely varying out-of-distribution accuracy (for example, ranging from 0 to 60% on the HANS dataset [6]). Given two robust models, a similarity metric should rate them as similar, and given one robust and one non-robust model, a metric should rate them as dissimilar. Thus we take 100 such BERT models and evaluate whether (dis)similarity between each pair of model representations correlates with their difference in OOD accuracy.
Our benchmark is composed of many of these subtasks, where we collect model representations that vary along axes such as training seeds or layer depth, and evaluate the models' functionalities. We include the following subtasks:
- Varying seeds and layer depths, and assessing functionality through linear probes (linear classifiers trained on top of a frozen model's intermediate layer)
- Varying seeds, layer depths, and principal component deletion, and assessing functionality through linear probes
- Varying finetuning seeds and assessing functionality through OOD test sets (described above)
- Varying pretraining and finetuning seeds and assessing functionality through OOD test sets
You can find the code for our benchmarks here.
The table below shows our results with BERT language models (vision model results can be found in the paper). In addition to the popular CKA and (PW)CCA metrics, we considered a classical baseline called the Procrustes distance. Both CKA and PWCCA dominate certain benchmarks and fall behind on others, while Procrustes is more consistent and often close to the leader. In addition, our last subtask is challenging, with no similarity measure achieving high correlation. We present it as a challenge task to motivate further progress for similarity metrics.
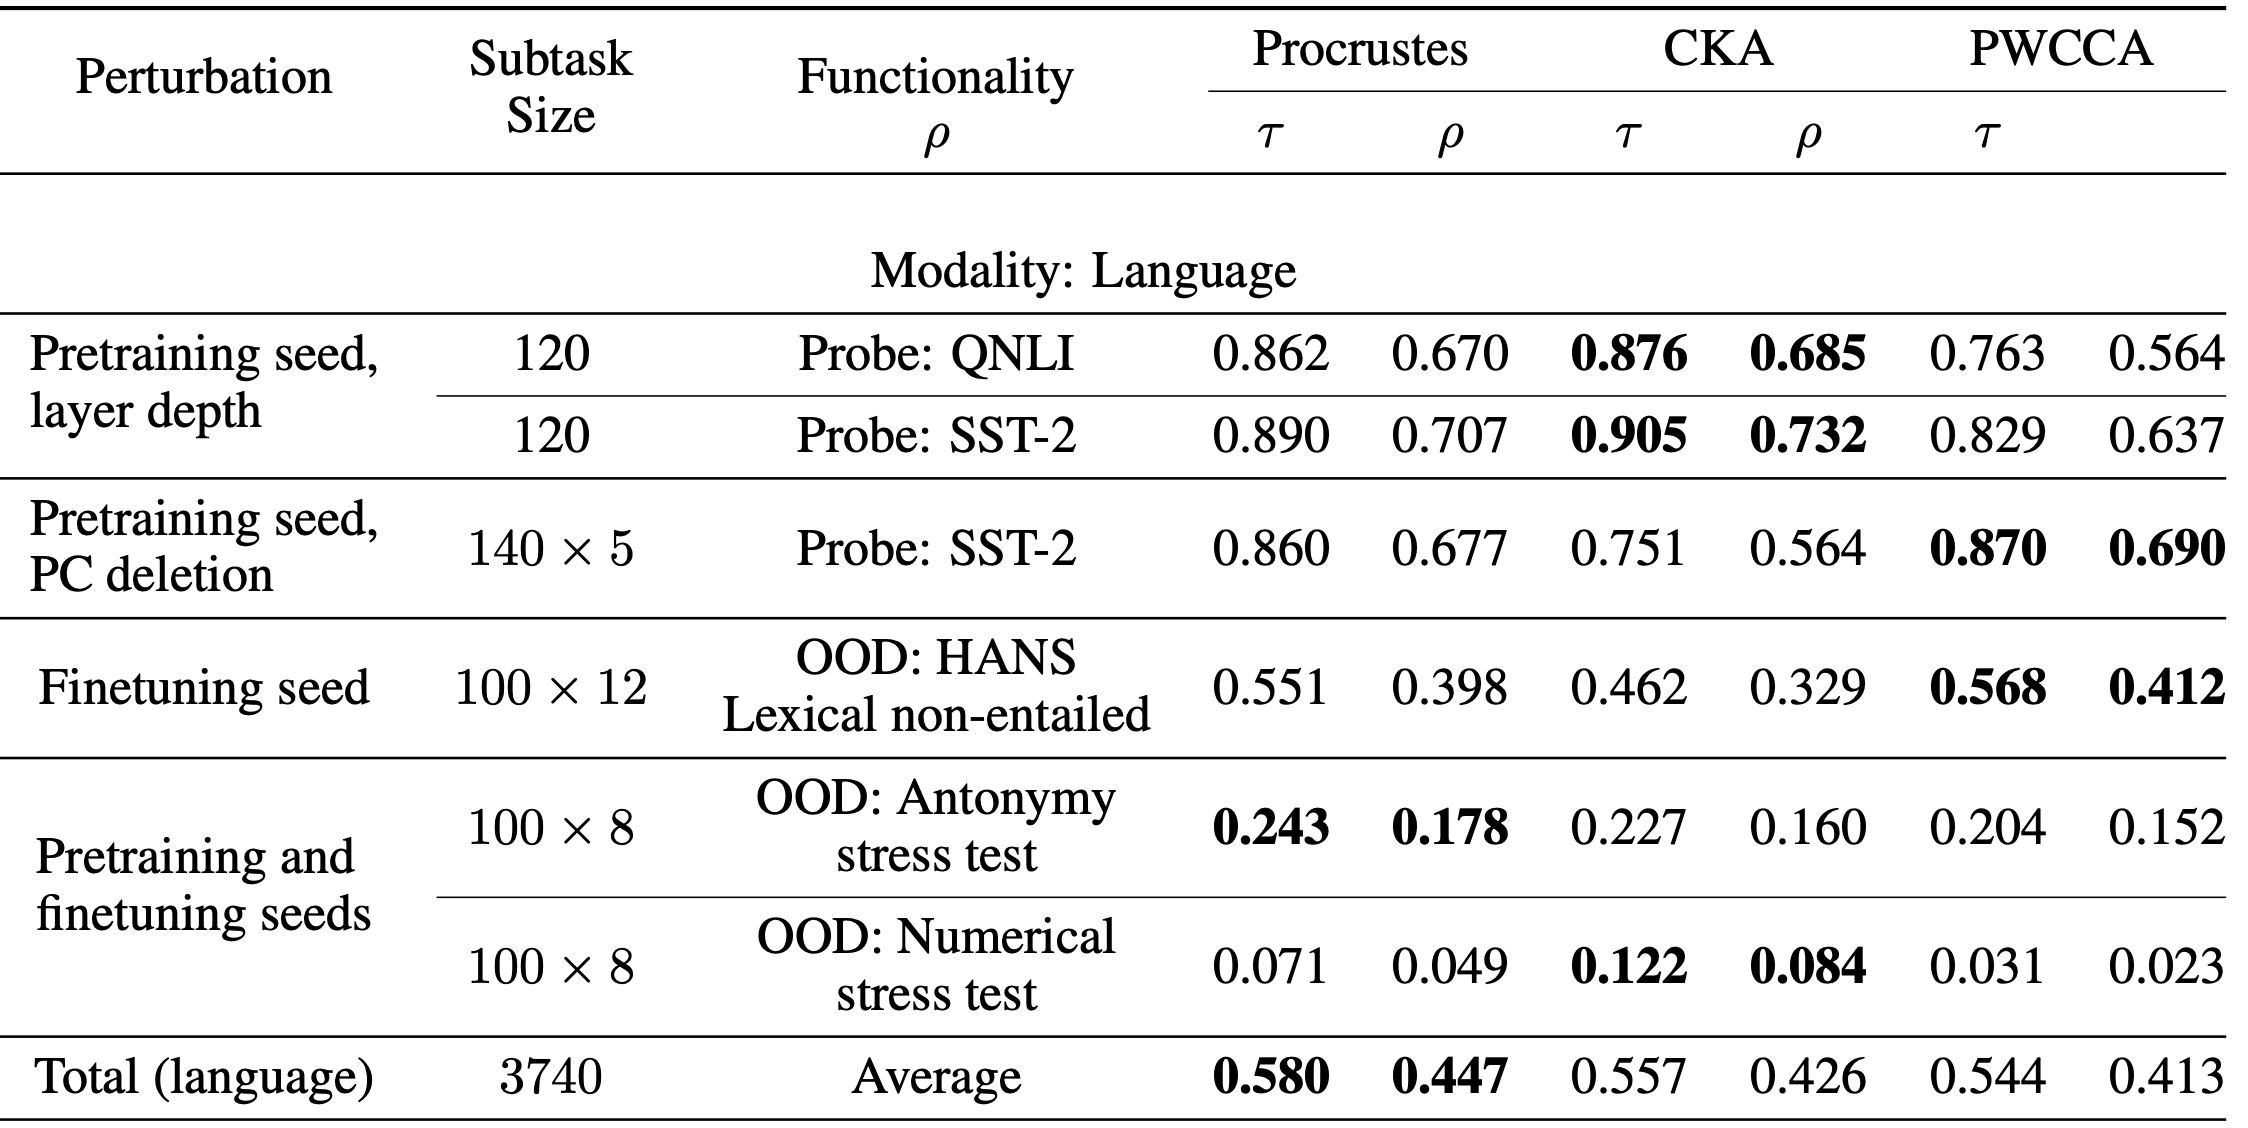
In the end, we were surprised to see Procrustes do so well since the recent CKA and CCA methods have gotten more attention, and we originally included Procrustes as a baseline for the sake of thoroughness. Building these benchmarks across many different tasks was essential for highlighting Procrustes as a good all-around method, and it would be great to see the creation of more benchmarks that evaluate the capabilities and limitations of other tools for understanding and interpreting neural networks.
For more details, please see our full paper!
References
[1] Raghu, Maithra, et al. "Do Vision Transformers See Like Convolutional Neural Networks?." arXiv preprint arXiv:2108.08810 (2021).
[2]Neyshabur, Behnam, Hanie Sedghi, and Chiyuan Zhang. "What is being transferred in transfer learning?." NeurIPS. 2020.
[3] Gotmare, Akhilesh, et al. "A Closer Look at Deep Learning Heuristics: Learning rate restarts, Warmup and Distillation." International Conference on Learning Representations. 2018.
[4] Kornblith, Simon, et al. "Similarity of neural network representations revisited." International Conference on Machine Learning. PMLR, 2019.
[5] Morcos, Ari S., Maithra Raghu, and Samy Bengio. "Insights on representational similarity in neural networks with canonical correlation." Proceedings of the 32nd International Conference on Neural Information Processing Systems. 2018.
[6] R. T. McCoy, J. Min, and T. Linzen. Berts of a feather do not generalize together: Large variability in generalization across models with similar test set performance. Proceedings of the Third BlackboxNLP Workshop on Analyzing and Interpreting Neural Networks for NLP, 2020.
This is also cross-listed at the Berkeley AI Research blog. We thank Juanky Perdomo and John Miller for their valuable feedback on this blog post.
0 comments
Comments sorted by top scores.