Maths writer/cowritter needed: how you can't distinguish early exponential from early sigmoid
post by Stuart_Armstrong · 2020-05-06T09:41:49.370Z · LW · GW · 13 commentsContents
13 comments
It's well known in FHI and similar circles, that it's impossible to distinguish an exponential (growth going up wildly) from a sigmoid/logistic curve (exponential growth until a turning point - an S shape) - until well after the turning point.
Which means we can't effectively predict that turning point. And so can't distinguish when a sigmoid will have a turning point, even when we know it must have one.

But this doesn't seem to exist in the statistics literature; and it would be very useful to have such a paper or textbook to point to.
We don't have time to write a full paper ourselves, but is there someone on this list with statistical experience who would like to write or co-write such a paper?
Since this result is important and as yet unpublished, it's plausible that such a publication may get an extremely high number of citations.
Cheers!
13 comments
Comments sorted by top scores.
comment by Arenamontanus · 2020-05-06T09:54:22.296Z · LW(p) · GW(p)
Another nice example of how this is a known result but not presented in the academic literature:
https://constancecrozier.com/2020/04/16/forecasting-s-curves-is-hard/
The fundamental problem is not even distinguishing exponential from logistic: even if you *know* it is logistic, the parameters that you typically care about (inflexion point location and asymptote) are badly behaved until after the inflection point. As pointed out in the related twitter thread, you gain little information about the latter two in the early phase and only information about the first two in the mid phase: it is the sequential nature of the forecasting that is making this problem.
I find it odd that this does not have a classic paper. There are *lots* of Bass curves used in technology adoption studies, and serious business people are interested in using them to forecast - somebody ought to have told them they will get disappointed. It seems to be a result of the kind that everybody who knows the field would know but rarely mention since it is so obvious.
Replies from: Stuart_Armstrong↑ comment by Stuart_Armstrong · 2020-05-06T10:21:26.741Z · LW(p) · GW(p)
even if you know it is logistic, the parameters that you typically care about (inflexion point location and asymptote) are badly behaved until after the inflection point.
Did a minor edit to reflect this.
comment by Shmi (shminux) · 2020-05-06T15:40:05.218Z · LW(p) · GW(p)
You may want to look into stiff equations. The logistic equation y'=λy(1-y) is increasingly stiff with increase in λ, meaning, in particular, that the resulting curve depends very sensitively on small relative changes in λ when λ is large. That would give you the exact effect you observe, inability to predict the inflection point from noisy data.
From a numerical methods textbook:
If the value of λ is increased the transition from zero to one occurs much faster, and for large values of λ it looks almost vertical. Such rapid changes in the solution are characteristic of stiff equations, and what this means is that the logistic equation becomes stiffer as λ increasesReplies from: aa-m-sa
↑ comment by Aaro Salosensaari (aa-m-sa) · 2020-05-06T17:40:18.061Z · LW(p) · GW(p)
Was momentarily confused what is k (sometimes denotes carrying capacity in the logistic population growth model), but apparently it is the step size (in numerical integrator)?
I have not enough expertise here to speak like an expert, but it seems that stiffness would be related in a roundabout way. It seems to describe difficulties of some numerical integrators with systems like this: the integrator can veer much off of true logistic curve with insufficiently small steps because the differential changes fast.
The phenomenon seems to be more about non-sensitivity than sensitivity of solution to parameters (or to be precise, non-identifiability of parameters): part of the solution before inflection seems to change very little to changes in "carrying capacity" (curve maximum) parameter.
Replies from: aa-m-sa, shminux↑ comment by Aaro Salosensaari (aa-m-sa) · 2020-05-06T17:47:17.776Z · LW(p) · GW(p)
"Non-identifiability", by the way, is the search term that does the trick and finds something useful. Please see: Daly et al. [1], section 3. They study indentifiability characteristics of logistic sigmoid (that has rate r and goes from zero to carrying capacity K at t=0..30) via Fisher information matrix (FIM). Quote:
When measurements are taken at times t ≤ 10, the singular vector (which is also the eigenvector corresponding to the single non-zero eigenvalue of the FIM) is oriented in the direction of the growth rate r in parameter space. For t ≤ 10, the system is therefore sensitive to changes in the growth rate r, but largely insensitive to changes in the carrying capacity K. Conversely, for measurements taken at times t ≥ 20, the singular vector of the sensitivity matrix is oriented in the direction of the growth rate K[sic], and the system is sensitive to changes in the carrying capacity K but largely insensitive to changes in the growth rate r. Both these conclusions are physically intuitive.
Then Daly et al. proceed with MCMC scheme to numerically show that samples at different parts of time domain result in different identifiability of rate and carrying capacity parameters (Figure 3.)
[1] Daly, Aidan C., David Gavaghan, Jonathan Cooper, and Simon Tavener. “Inference-Based Assessment of Parameter Identifiability in Nonlinear Biological Models.” Journal of The Royal Society Interface 15, no. 144 (July 31, 2018): 20180318. https://doi.org/10.1098/rsif.2018.0318
EDIT.
To clarify, because someone might miss it: this is not only a reply to shminux. Daly et al 2018 is (to some extent) the paper Stuart and others are looking for, at least if you are satisfied with their approach by looking what happens to effective Fisher information of logistic dynamics before and after inflection, supported by numerical inference methods showing that identifiability is difficult. (Their reference list also contains a couple of interesting articles about optimal design for logistic, harmonic models etc.)
Only thing missing that one might want AFAIK is a general analytical quantification of the amount of uncertainty, and comparison to specifically exponential (maybe along the lines Adam wrote there), and maybe writing it up in easy to digest format.
Replies from: Arenamontanus↑ comment by Arenamontanus · 2020-05-11T23:55:27.519Z · LW(p) · GW(p)
Awesome find! I really like the paper.
I had been looking at Fisher information myself during the weekend, noting that it might be a way of estimating uncertainty in the estimation using the Cramer-Rao bound (but quickly finding that the algebra got the better of me; it *might* be analytically solvable, but messy work).
↑ comment by Shmi (shminux) · 2020-05-06T21:52:46.812Z · LW(p) · GW(p)
Sorry, forgot to replace one of the k with λ. I agree that identifiability and stiffness are different ways to look at the same phenomenon: sensitivity of the solution to the parameter values results to errors building up fast during numerical integration, these errors tend to correspond to different parameter values, and, conversely, with even a small amount of noise the parameter values are hard to identify from the initial part of the curve.
comment by Past Account (zachary-robertson) · 2020-05-07T14:01:53.276Z · LW(p) · GW(p)
[Deleted]
comment by Aaro Salosensaari (aa-m-sa) · 2020-05-06T13:04:23.258Z · LW(p) · GW(p)
I was going to suggest that maybe it could be a known and published result in dynamical systems / population dynamics literature, but I am unable to find anything with Google, and textbooks I have at hand, while plenty mentions of logistic growth models, do not discuss prediction from partial data before inflection point.
On the other hand, it is fundamentally a variation on the themes of difficulty in model selection with partial data and dangers of extrapolation, which are common in many numerical textbooks.
If anyone wishes to flesh it out, I believe this behavior is not limited to trying to distinguish exponentials from logistic curves (or different logistics from each other), but also distinguishing different orders of growth from each other in general. With a judicious choice of data range and constants, it is not difficult to create a set of noisy points which could be either from a particular exponential or a particular quadratic curve. Quick example: https://raw.githubusercontent.com/aa-m-sa/exponential_weirdness/master/exp_vs_x2.png (And if you limit data point range you are looking at to 0 to 2, it is quite impossible to say if a linear model wouldn't also be plausible.)
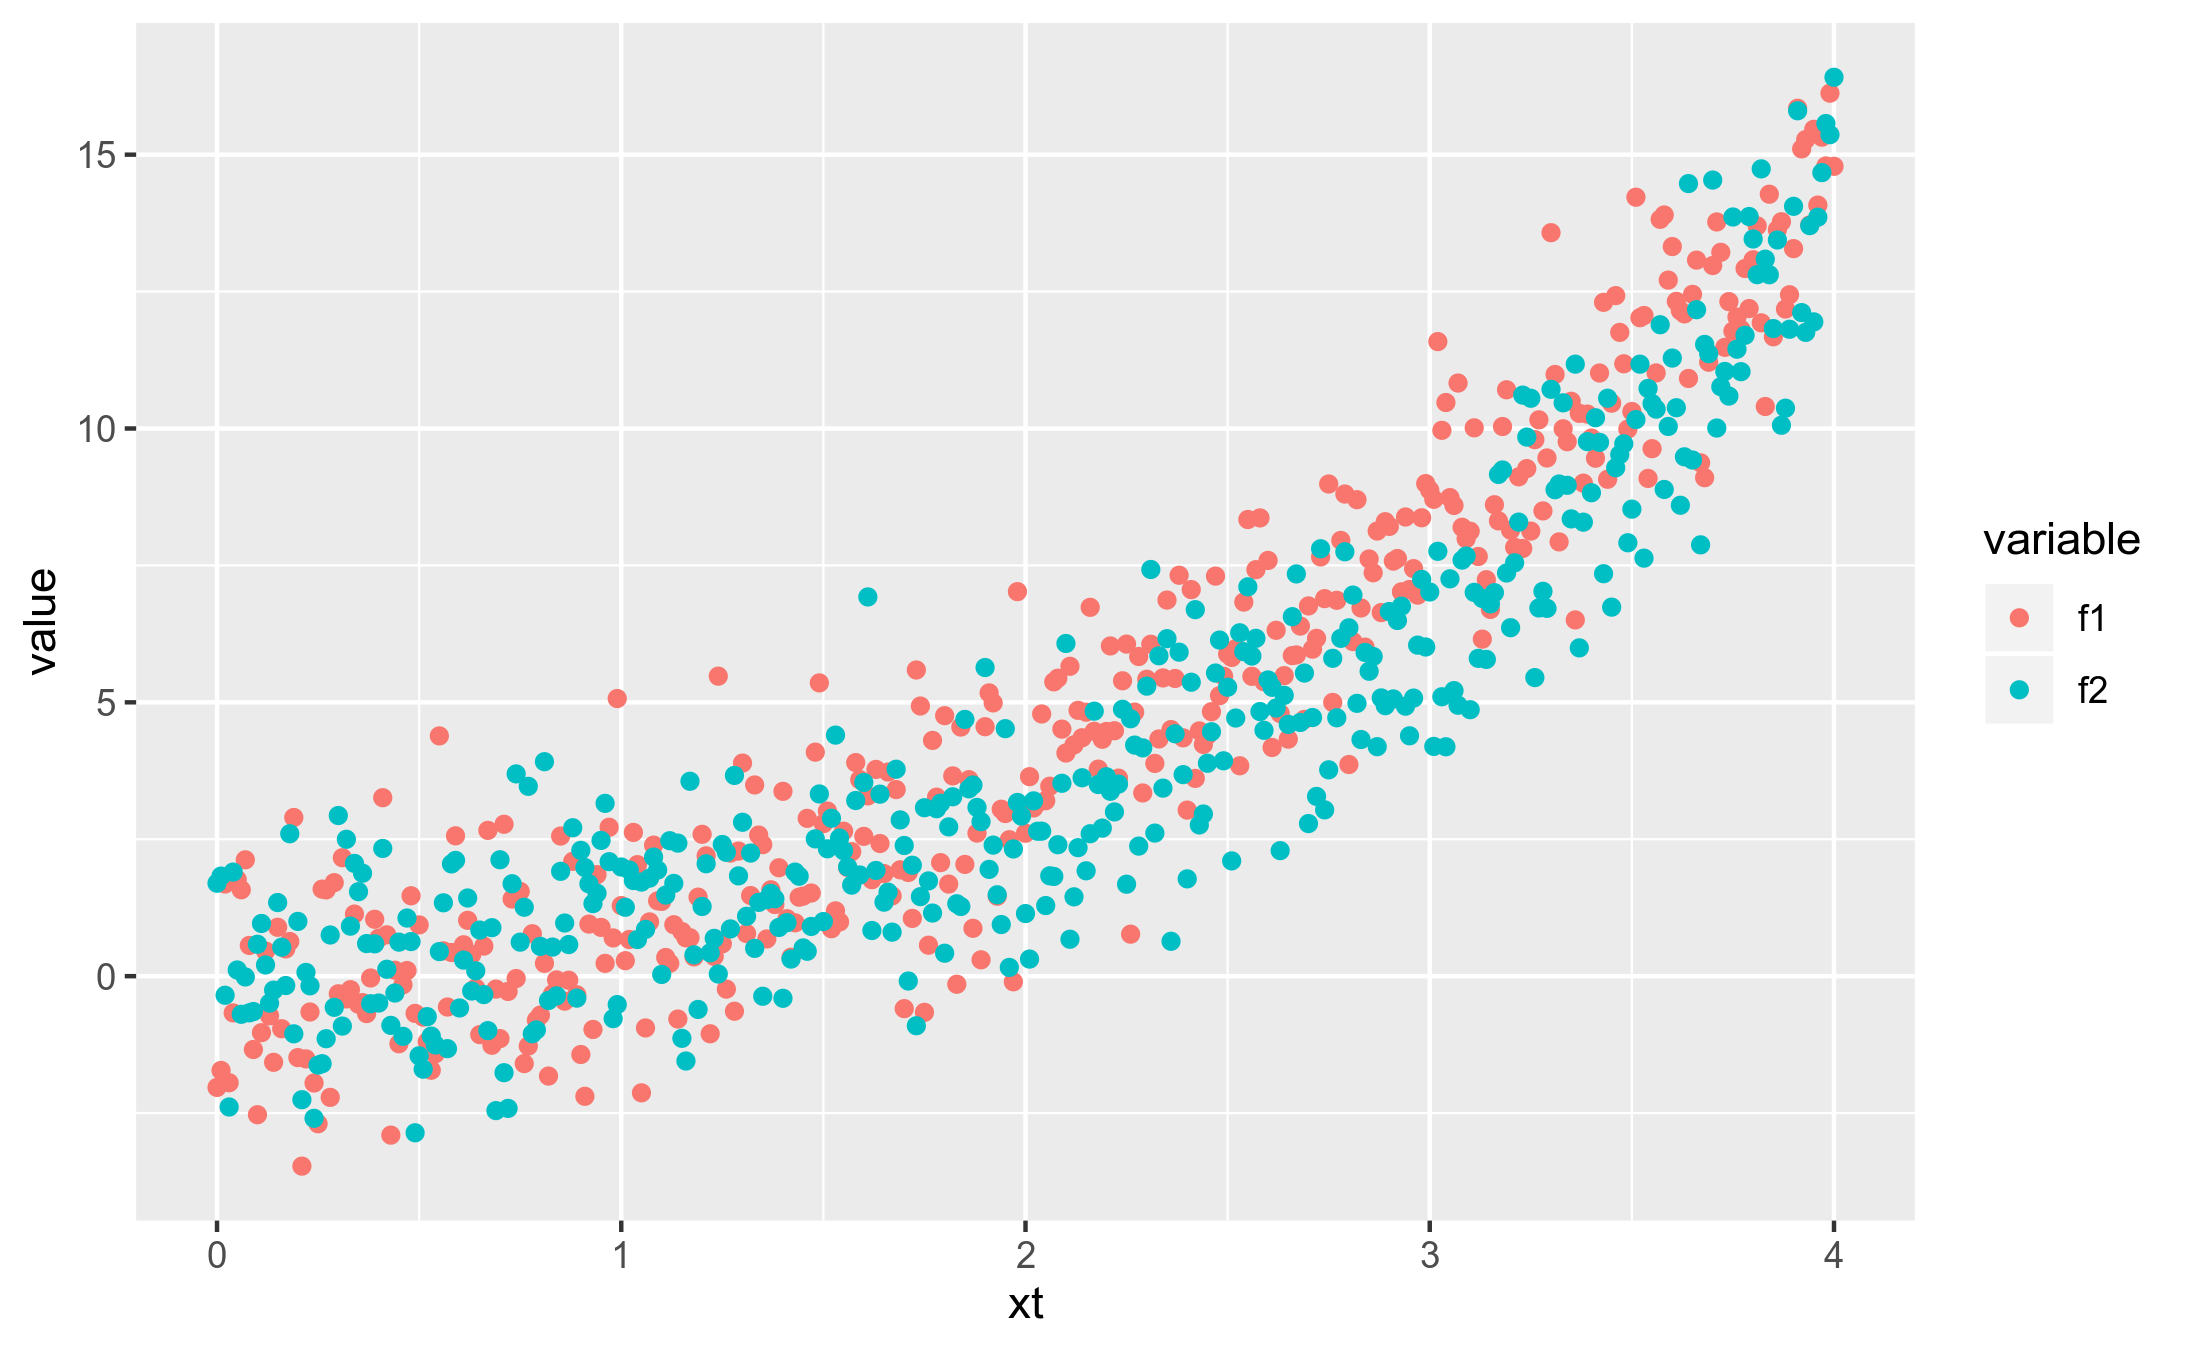
comment by FactorialCode · 2020-05-06T22:07:29.806Z · LW(p) · GW(p)
Isn't this really straight forward? I'm pretty sure ln(e^x) and ln(sigma(x)) only differ by about e^x + O(e^(2x)) when x < 0. You can't tell apart 2 curves that basically make the same predictions.
comment by Adam Bull · 2020-05-06T20:24:18.902Z · LW(p) · GW(p)
In the simplest case where the errors are Gaussian, this would probably be covered by standard regression lower bounds? You'd show that exponentials and sigmoids can be made close in L² over a restricted domain, then deduce it requires many samples / low noise to distinguish them.
Or as Aaro says above, maybe better to parametrise the sigmoid, and take the Fisher information of the turning point parameter.
comment by Derek M. Jones (Derek-Jones) · 2020-05-06T13:42:16.466Z · LW(p) · GW(p)
More examples of the difficulty of predicting the future using fitted regression models: