COVID Strategy 101
post by Mike Harris (mike-harris-1) · 2020-10-05T19:30:43.529Z · LW · GW · 7 commentsContents
  Introduction:
  The Basic Infection Model:
  Flatten the curve:
  Criticism of Flatten the Curve:
  Hold out until a Vaccine:
  Hammer and the Dance:
    The Hammer:
    The Dance:
  Criticisms of the Hammer and Dance Model:
    Testing can Stop the Spread:
    A Hammer could be Short and Sharp:
    Governments Could Dance:
  Non Mainstream Views:
  Low Mortality:
    The Response:
  Comorbidities:
    The Response
  Sweden's Strategy:
    The Response
  Herd immunity:
    Response
  Cross Immunity:
    The Response
  Heterogenous Spread:
    Social Networks
    Neighborhoods
    Lockdowns
    The Response:
  Conclusion:
None
7 comments
Introduction:
Over the past six months of the COVID epidemic a sharp divide has emerged.
In one camp, most public health experts believe that the lockdowns in place are keeping us from unmitigated disaster and millions of deaths. In the other camp, a disparate group of scientists have argued that the lockdowns are unnecessary and causing far more damage than what would be caused by COVID if life was allowed to return mostly to normal.
Most people are aware of these two camps, and may have read some of the articles arguing in one direction or the other. However most articles are either at a very high level, and don't explain the specifics of the strategy and beliefs; Or they are at a very technical level, and are too bogged down with mathematics and terminology to be comprehensible.
In this article I want to blaze a middle path, providing enough detail to understand the beliefs and arguments of both the camps, while not being so technical. To aid in this goal I have developed interactive tools to visualize the implications of the various theories proposed. These tools are obviously vast simplifications so the precise numbers produced are less important than the overall dynamics.
The disagreements between these two camps span a wide range of topics:
- Strategic: What is the right approach for dealing with COVID.
- Moral: How do you balance the loss of life from the epidemic with the loss of liberty from lockdown measures.
- Tactical: What actions are most effective, for instance how well do masks work?
This article is aimed at explaining the strategic disagreements. Science and data cannot decide these moral tradeoffs, only tell you what the tradeoffs are likely to be. The tactical decisions are also inherently technical in nature, depending on the precise numbers rather than the broad strokes.
This article is aimed at an American audience and uses data or numbers for the United States unless otherwise specified. However none of the ideas are unique to America.
The Basic Infection Model:
Almost every model for the spread of COVID has as its basis the SIR model. In this model every sick person will infect, on average, the same number of other people before recovering. This number is known as "R0". If we look at R0=2 it is easy to see how the infection can grow out of control very quickly; After 10 rounds of transmission 1 person will cause 1000 infections and after 20 they will cause 1,000,000.

At the beginning this exponential growth is steady, however, some of the people who would get infected by a sick person are immune, because they have already been sick. This will cause the growth rate to start to slow down. Eventually when enough people are immune the growth will stop. At this point we say that the population has reached "herd immunity". In this model, the point at which the population reaches herd immunity is entirely predictable. In our example with R0=2, the population will reach herd immunity when 50% of the population has been infected.
After the population reaches herd immunity, infection counts will decline, however they will not immediately stop. This means that more people will be infected. This is known as the "overshoot" and in the case of R0=2.0 means that eventually 80% will be infected before the cases fall to zero.

This basic model makes a few assumptions which allow it to be so simple, the main assumptions are.
- Each person will on average infect the same number of people.
- Who gets infected by a sick person is random.
- Once a person is infected they are immune and can no longer become infected.
Everybody agrees that these assumptions are not completely true, but most experts believe that this model is still useful, and that any deviations do not meaningfully affect the conclusions.
On this page you can see how changing the value of R0 changes the course of an epidemic.
As R0 gets higher all of the following will be true:
- The number of people infected will be higher
- The peak number of people infected will be higher.
- The peak will occur sooner in the course of the outbreak.
- The decline in the number of cases will be more rapid.
As a consequence of all of this, the growth rate early on in the course of an outbreak predicts the future with great precision. Early on experts looked at the growth rate in places like Wuhan, Milan, and New York and determined that the R0 was at least 2.5 and possibly higher.
If nothing was done very quickly most of the population would be infected. Based on previous studies doctors believed that approximately 1% of those infected would die. This meant that approximately 2,500,000 people would die. However if hospitals were overwhelmed, that number could go up significantly. In the worst case closer to 5% of those infected might die (all those who required hospitalizations) pushing the death total closer to 10,000,000.
Flatten the curve:
To prevent these worst case scenarios the initial strategy was known as "flatten the curve". This theory accepted that COVID was so infectious that it was inevitable for most of the population to get it. However if steps could be taken to mitigate the spread, then the infections would be spread out over a longer period of time. Once the curve was flattened, these mitigations could be loosened without seeing the same level of spike.

Even though most of the population would still end up infected, locking down to flatten the curve would have the following benefits.
- By spreading out the infections, more people would wind up getting proper care.
- By delaying the infections, there would be time to ramp up production for ventilators and protective equipment.
- Reducing the peak at herd immunity reduces the overshoot.
- More speculatively, by delaying the infections there would be time for doctors to discover more effective treatments.
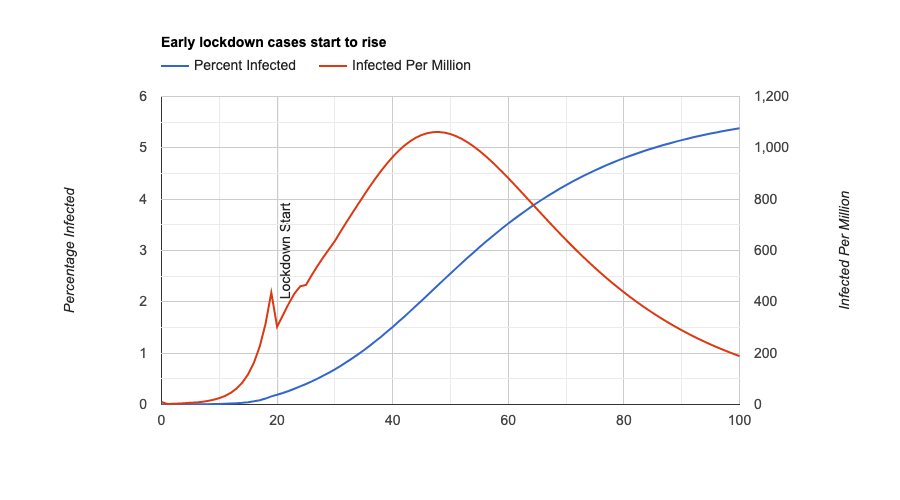
It is important to note that suppressing infections is counterproductive in this strategy. Because suppression prevents herd immunity, once you loosen the restrictions you will reach the same peak as before. Instead you want to lockdown just enough to keep your hospitals from being overwhelmed.

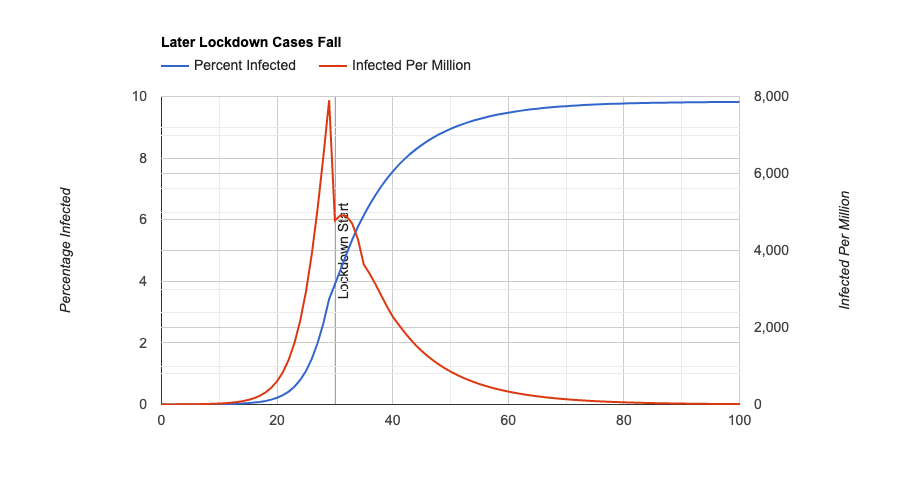
Using this page you can explore how changing the timing and severity of the lockdown changes its effectiveness. Note that any lockdown helps a little in terms of the eventual spike.
Criticism of Flatten the Curve:
Very quickly the flatten the curve model was criticized. There were two major sources of criticism.
First, the actual hospitalization capacity was not nearly high enough to make it viable. Instead of reducing the peak by a factor of two, it would be necessary to reduce the peak by a factor of 50 or 100. Doing this through a flat curve might take years, which was clearly unacceptable.
Second, even if flattening the curve was feasible and every patient could be treated, it would still mean accepting herd immunity. Even with proper treatments it would mean 2,000,000 people dying in the United States.
Instead countries like China, South Korea and Italy had shown that outbreaks could be suppressed and hopefully eradicated with harsh measures. If we followed their example we could avoid almost all of the deaths and eventually return to normal.
Hold out until a Vaccine:
Other countries had demonstrated that lockdowns could suppress and actually reduce the size of the outbreak. As we saw earlier, with the flatten the curve approach, this is a temporary solution. Once restrictions are lifted the peak will come back just as high as before.
One solution is to never leave lockdown until a vaccine could be developed, tested, and distributed. However, it was (and still remains) unclear how long it would take for an effective vaccine to be ready for COVID-19. The consensus opinion was that optimistically a vaccine was 18 months away. However other viruses took years to develop effective vaccines for, and some viruses cannot be treated by vaccines despite decades of effort.
Anyways, even optimistically an 18 month lockdown was considered obviously infeasible and not clearly better than the flatten the curve alternative so another solution had to be found.
Hammer and the Dance:
Fairly quickly many experts coalesced around a new framework. Countries like South Korea and Singapore were demonstrating that contact tracing and sufficient testing could contain outbreaks even without strict lockdowns. Once the US and Europe built up their testing capacity sufficiently, they could mostly reopen while remaining safe. Life might not completely return to normal (some crowded events might need precautions) but for the most part we could reopen while most of the population remained uninfected.
These ideas were fleshed out in the influential essay "The Hammer and the Dance" by Tomas Pueyo.
To explain the ideas behind this essay more simply let us consider a simple toy model:
- With no testing the average person will infect two other people (R0=2.0)
- With complete testing the average person will infect another person half the time (R0=.5)
- The first 1000 sick people can be detected and tested. Everybody else remains untested.
If at the start of this policy there are 10000 sick people, almost all of the sick people remain untested. As they infect others, the number of infected people goes higher and fewer and fewer people can be tested.
The testing capacity is a vast simplification. In the real model capacity changes over time and is much more probabilistic. However adding these does not affect the conclusions of the model.

The Hammer:
To solve this problem the strategy proposed an early, severe lockdown known as the "Hammer". During this period the number of infected would rapidly fall. At the same time the number of tests would grow, until a large enough percentage of those infected could be tested. Once this number was reached even without a lockdown cases could remain under control.
In our example once there were 1000 or fewer cases the lockdown could be safely left and cases would continue to stay low (because the R0 for those tested is lower than 1). How long this would take would depend on several factors.
- How many people were sick at the start (more sick = longer)
- The strictness of the lockdown (more severe = shorter)
- The growth of testing (more testing = shorter).
- How effective testing is at stopping the spread (more effective testing = shorter).

The Dance:
At some point in the lockdown process, the restrictions would need to either be fully or partially lifted. Whether that would cause cases to begin to rise again would depend on the factors listed above. However actually measuring these numbers was obviously infeasible. Instead a thermostat-like approach could be used.
- Cases rising = More restrictions
- Cases stable = Keep restrictions stable.
- Cases declining = Loosen restrictions.
The consequences of not adding restrictions if cases started to rise was needing to return to another "Hammer" lockdown. To avoid this instead most experts agreed there should be some slack in the system, so that unless cases showed a steady decline, restrictions should not be loosened.

Using this tool you can see how adjusting various parameters affects the effectiveness of this strategy lockdown. A key takeaway is that in this model, the strategy either succeeds, or fails utterly. Unlike in "Flatten the Curve" strategies there is very little in between space where the strategy partially succeeds. This also means that abandoning the strategy causes almost all of the benefits to go away.
Criticisms of the Hammer and Dance Model:
Critics in the opposing camp have pointed to several assumptions made that they believe to be incorrect.
Testing can Stop the Spread:
A core assumption of the strategy is that once enough people are tested, most lockdown restrictions can be safely removed. If this was not true, then this strategy was always doomed to failure.

Although South Korea and Singapore were showing success at keeping outbreaks from occuring, these countries are not the same as the United States and Europe. If the United States and Europe would not be able to reopen, even with large amounts of testing we would be stuck waiting in lockdown until a vaccine was ready.
Not only was this assumption unproven, but there is reason to believe that it is false. Even countries which successfully brought cases to near zero levels saw outbreaks reoccur when they reopened. In addition most countries failed at stopping the virus in the first place, even when given extra time to prepare, even when in lockdown before the virus spread.
A Hammer could be Short and Sharp:
Another assumption was that in a reasonably short period of time case numbers would decline rapidly in all places. Instead many places, such as Florida from April to June or France from May to August showed a plateau where cases were neither rising nor falling.
Despite the public health experts claiming that any plateau was simply a sign of insufficient lockdown, critics argued that it occurred in many places of varying lockdown severity. Instead they argued that these plateaus arose from more complicated dynamics.
If plateaus were inevitable the "Hammer and Dance" strategy would never find it safe to reopen and we would again be stuck waiting in lockdown until a vaccine was ready.
Governments Could Dance:
Finally Hammer and Dance strategies required governments to be nimble and flexible with their reopening plans, opportunistically reopening when slack appeared, and being quick to reclose if the numbers were not working out.
Instead governments are slow to act and slower to react, instead of a relatively quick lockdown with phases of reopening occuring in quick succession, the strategy could only work with months of time between each decision. This would mean that even if the strategy could succeed it would take far longer than the proponents were promising.
Non Mainstream Views:
In the other camp the critics have arrayed a variety of arguments against the general strategy being pursued throughout the United States and Europe.
These arguments share an implication that the lockdowns are less necessary or less effective than the public health experts claim. However, they are not all consistent with each other. Most people in the opposing camp believe in some subset of these claims and to various degrees.
Low Mortality:
COVID may be far less deadly than commonly thought. We compute the fatality rate of COVID by dividing the number of deaths by the number of cases. However the number of undiagnosed, nearly asymptomatic cases may be much higher than these estimates.
On the basis of these estimates the fatality rate was likely to be .2% instead of the 1% commonly believed. This would mean that herd immunity could be reached after only 400,000 deaths instead of the 2,000,000 claimed by experts.
In addition our best validations on the fatality rate come from the most infected places (like Wuhan early, or New York later). However these places are exceptional, as demonstrated by the fact that their case counts are so high above their neighbors. This means that there fatality rate cannot be directly compared as it may be impacted by idiosyncratic factors (more susceptible population, spread among nursing homes, higher initial viral load).
The Response:
The fact that undiagnosed cases are hard to measure is a known problem, and one which estimates of mortality take into account.
Our estimate of a ~1% fatality rate is based on several estimates which arrive at similar conclusions:
- Estimates from antibody surveys tend to produce numbers in the .5-1.0% range
- On The Diamond Princess, a cruise ship where everybody was tested, results came back at ~1.2%
- Estimates from China early on, were around .7-1.0%.
None of these computations are bulletproof, and there is still wide uncertainty around the precise value. However the lower estimates do not have nearly the credibility and to act based off of them would be irresponsible.
Comorbidities:
COVID death totals in fact overstate the actual impact. Most deaths are people who are old and sick. Properly taking this into account means that the death toll is not as high as it seems. Even though 1-2 million people might die of COVID these people were likely to die soon anyways (in a normal year 3 million people die in the US). Each death from COVID properly considered only shortens the lifespan by a few months or at most a couple of years. As a consequence we should not be reacting so severely and instead accept the consequences.
The Response
Although it is true that people who die of COVID are older and sicker than average, this is not unusual. Older and sicker people are at a greater risk for every condition. Using standard demographic controls shows that the average death from COVID reduces lifespan by more than 10 years
Furthermore even if you reject this study (those who die from COVID differ in uncontrolled ways from others), if this were true we would expect regions which had large COVID outbreaks in the past to see lower than usual death totals. Instead we see them at the normal levels which indicates that people who die of COVID were not on the verge of dying from other conditions.
Sweden's Strategy:
In contrast to most other countries, Sweden adopted a flatten the curve strategy. However they attempted a different strategy to avoid the high death totals and hospitalizations expected with that strategy. Although we have been using a short hand estimate of a 1% death rate from COVID, we know that in fact the risks are highly divergent. For those over 70 the death rate may be as high as 10% while for healthy adults the rate may be .1% or lower. Sweden therefore attempted to lock down the elderly, while keeping the rest of the country more free of restrictions. The idea was that once enough people had been infected, the elderly could be reintegrated into society without causing a spike (because the population as a whole had reached herd immunity).
We can model this strategy and show that in principle it could work.

Even after leaving lockdown, deaths remain low because the young people have enough immunity to protect the elderly population. If instead the whole country was locked down the strategy would not work. This is because once the lock down ends, the young population will remain vulnerable and will quickly transmit it back to the vulnerable, elderly population.

Looking at Sweden shows that although its death totals are higher than its neighbors, they are not nearly as high as predicted by the pessimists. Furthermore even once the country has loosened lockdown restrictions it has not seen its death total rise, indicating that they must have done something right.
This tool shows how variations on this strategy can reduce the death totals.
The Response
Sweden's strategy could theoretically work, however there are strong reasons to believe that it has not in fact worked. Every country has been making efforts to isolate their elderly population, and all of them have not had much success. Looking at the breakdown of deaths by age in Sweden does not show strong evidence that isolation is working.
In addition although the plan is to reach herd immunity which protects the elderly, studies indicate that Sweden is not anywhere that level.
Instead the best way to understand Sweden is that they attempted this strategy but failed. As cases and deaths piled up, the people of Sweden voluntarily chose the same lockdown measures that other countries were enforcing. This was what stopped the cases from growing. If people in Sweden were to fully open up, they would see the same spikes as others. By waiting for people to voluntarily lock down Sweden suffered many unnecessary deaths compared to its neighbors.
Herd immunity:
A common piece of evidence that many alternative theories cite is that in many places there has been a marked decline seen once around 20-30% of the population has been infected. This is not only seen in places like New York and Milan which were hit extremely hard before lockdown, but also in places like Florida and Arizona which saw their spikes after loosening lockdown.
As the basic model would predict that herd immunity is not a significant factor at these levels it must be that there is some missing factor from this model which could explain herd immunity at these lower levels. As a consequence many of the worst case scenarios are unlikely to occur even without a reaction.
In addition places which got hit early were able to get cases to decline extremely quickly, while places which didn't get hit early instead were much more likely to see a plateau, even with a lockdown of similar severity. Only herd immunity can explain this.
Response
The herd immunity of a population depends on two factors. How much transmission there is (R0) and what percentage of the population has already been infected. Entering a lockdown affects the R0 and therefore temporarily reduces the required percentage of the population required to reach herd immunity. If lockdown restrictions were lifted, the herd immunity would go away and the cases would go back up.
For instance consider the following scenario:
- Without lockdown: for every 10 infected people, 30 infections are caused (R0=3.0)
- With lockdown: for every 10 infected people, 15 infections are caused (R0=1.5)
Under a lockdown herd immunity will be reached when 33% of the population is infected. This is because 5 of the 15 people infected are immune. This means that every 10 infected people will only cause 10 new infections. Because the infections stay the same the peak of the infection has been reached.
However once lockdown is lifted those same 10 infected people will now infect 30 people. Of those 30 people only 10 will be immune. This means that every 10 infected people will cause 20 new infections. Infections will start to double and not stop until 66% of the population has been infected (of the 30 people infected, 20 are immune).
We can see this graphically here, where cases start to fall under a "flatten the curve" strategy before surging back up when lockdown restrictions are lifted.

As to the fact that the hardest hit places have been the quickest to see declines, this is a combination of two factors:
- Under lockdown conditions these places are closer to the herd immunity level. New York may have close to 33% of the population immune, so R0=1.5 is sufficient to halt the spread, in places which were not hit hard they would need to reduce R0 to almost 1.0.
- Places which saw the effects of COVID are more dilligent about locking down. In places like New York and Italy people are always wearing masks and social distancing. Other places with less experience are halfheartedly locking down meaning that they are still seeing their cases increase.
Cross Immunity:
One assumption made by the standard model is that the only way people become immune is by becoming infected. However if a large percentage of the population was naturally immune to the disease, then we would expect to see the peak when fewer people were infected.
If we return to our original example with R0=2.0, in the standard model we reach a peak when 50% of the population has been infected. However if 50% of the population was naturally immune we would reach a peak when 50% of the remaining non immune people were infected. This means that after only 25% of the total population was infected we would reach the peak.


In fact there have been studies showing that many people not directly exposed to COVID already demonstrate an immune response.
It is also possible that some regions have more natural immunity than others, which is why they have been less hard hit.
This tool shows how the shape changes as the cross immunity rate increases.
The Response
Yes it is possible for there to be some natural immunity to COVID, but it is unrealistic to believe that it is a significant factor. The ongoing biological research is valuable, but so far the evidence has not been especially strong, having an immune response may not be enough to keep a person from getting sick, or making others sick.
In addition there have been several studies of superspreader events. In two cases (a fishing boat and a choir practice) a single infected person was able to infect more than 80% of the group. If a large fraction of the population is naturally immune, how would that be possible?
Heterogenous Spread:
The basic SIR model assumes that all people will, on average, infect the same number of people and that who they infect is random. In the real world neither of these assumptions are true, some people interact and spread the virus more than others, and people don't interact with others at random, instead they mostly infect their friends, families and neighbors.
When taking these heterogenities into account, computing the course of an outbreak becomes far more difficult. This is because there is an ambiguity in the meaning of R0.
- R0 is defined as: "The average number of people that a random person will infect"
- R0 is measured as: "The average number of people that a random sick person will infect"
In the standard model these two are the same. In a heterogenous model however these numbers can differ and under most circumstances, R0 as measured will be higher than R0 as defined.
For a simple example imagine two completely isolated cities of the same size, Partyville and Hermittown. In Partyville every sick person infects two other people (R0=2.0). In Hermittown every sick person remains completely isolated (R0=0).
- R0 as defined = 1.0 (A random person is equally likely to be from Partyville or Hermittown).
- R0 as measured = 2.0 (A random sick person will be from Partyville).
Obviously this is extreme in two ways. Cities aren't completely isolated from each other, and no sick person could be completely isolated. But even with less extreme parameters this gap between the measured and defined R0 will persist.
For instance early on a heterogenous model with R0=1.0 will look the same as a homogenous model with R0=2.1

As time goes on, in the heterogenous model the R0 as measured will decline for two reasons:
- Sick people are more likely to interact with immune people than average (if 25% of people are immune, then 50% of Partytown is immune).
- After the most infectious places burn themselves out, the remaining infections are from places which transmit more slowly.

This means that it is fundamentally hard to predict the future course of the epidemic, even if data from the past is available with great precision.
There are two major sources of real-life interaction which can provide this heterogenity
Social Networks
People tend to interact with those who are similar to them. If people who are more likely to spread the disease interact more with others who tend to spread the disease this will be a source of heterogenity. For instance people who party in crowded bars will spread COVID more than those who stay isolated at home, but the people they spread COVID to will mostly be the other people partying with them in the crowded bars.
This tool shows how changing variability of individual spread affects the course of an outbreak.
Neighborhoods
People tend to stay within their local neighborhood, especially when under lockdown. This means that, like our example of Partyville and Hermittown, adding up the infections in each neighborhood will produce a distorted picture.
This tool shows how changing the variability of neighborhoods, along with their level of isolation can affect the couse of an outbreak.
Lockdowns
In the mainstream model, an early lockdown works better. This is because with an earlier lockdown more of the cases can be tested. In heterogenous models a later lockdown works better, because the most infectious groups are closer to herd immunity.
In addition, in the mainstream model if cases start to rise, they will continue to rise until herd immunity is reached. In heterogenous models the R0 as measured will naturally change over time, and with no change in behavior may switch between R0>1 (cases growing) and R0<1 (cases shrinking).
If we use a more complicated model, case numbers can switch between rising and falling many times, based on whether a particularly vulnerable group is in the midst of an infection.
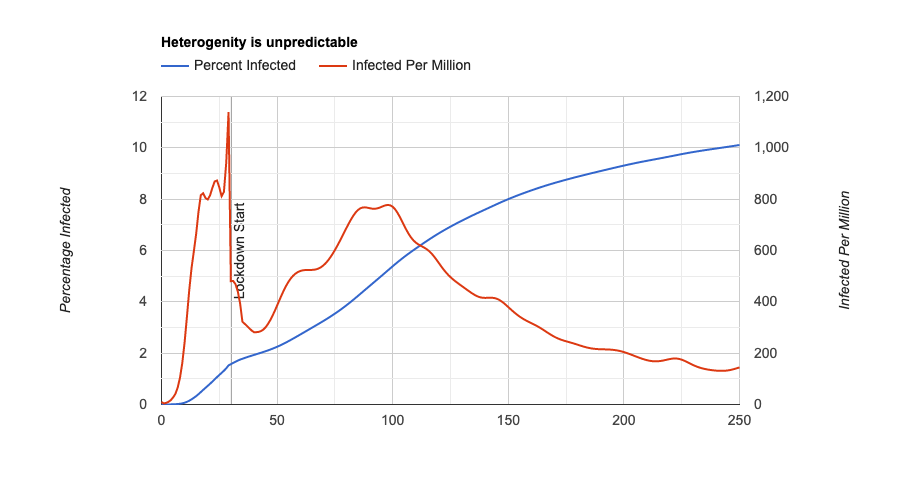 .
.
The Response:
It is true that the basic model's assumptions are not completely accurate, and heterogenity exists in the real world. But that is not a reason to switch to using these heterogenous models. These models are much more complicated and have many knobs to tune. This means that they can predict the past very well, but falter when predicting the future. In fact these models have not produced better predictions than the simpler basic model.
These problems are also problems for every disease, but the basic model has provided accurate predictions for a wide variety of epidemics.
In addition all of these heterogenous models predict wide disparities in who is infected by COVID. Although some disparities have been seen, the scale of the disparities seems too low to be consistent with a meaningfully heterogenous model.
Heterogenous models, also tend to assume that which communities are most infectious is static over time. However instead they change (Hermittown may become less isolated as they become less worried about COVID). Properly accounting for this, means that over time the homogenous model becomes more accurate.
Conclusion:
The main thing that I would like you to take away from this article is not that any one position or theory is correct. Instead I want you to realize how much uncertainty still remains and how much we don't know about this disease.
More importantly, how we should respond to the epidemic needs to take this uncertainty into account. Any plan we devise may end up being flawed because it is based on faulty assumptions. This means that as part of any plan we need to figure out how we can most effectively validate the assumptions, and what the consequences of being incorrect are.
Our present strategy for instance relies on the assumption that with sufficient testing it will be possible to open up almost completely. Experts devised many plans of the most effective testing regimes and staggered reopening plans which would make the plan work. However all of these plans were designed with the certainty of the strategy in mind. Some numbers might need to be adjusted, but fundamentally it was assumed that the strategy was sound.
The only way to validate these assumptions is to show them working in the real world. Rather than waiting months for case numbers to fall everywhere and national testing to come up to speed, could we have drastically ramped up testing in a few locations and seen if that would be enough? Instead of insisting that everybody choose the "right" strategy could we have tried different things in different places?
Accepting uncertainty in this way is not easy, it means that sometimes you will get it wrong and people will die. But without taking risks you leave yourself stuck in stasis, never certain enough to move forward and never able to learn if you are on the wrong path.
It's also important to bear in mind that any solution is an imperfect balance of priorities and tradeoffs. Complete isolation until a vaccine is ready would save the most lives but would not be tolerable. Everybody going to a giant COVID party and hugging each other would solve the problem in a different way, but would cause too many deaths to be justifiable. Various activities (religious services, schools, restaurants, travel, weddings, dentists, haircuts, etc.) are important, but have unknown costs. Science can help us figure out what the costs are and how to reduce them, but as a society we need to decide whether they are worth it.
At the end of the day, I don't know which theories are correct. I believe that heterogenity is underexplored and that our current strategy is fatally flawed because of it, but I'm not certain about it. At the end of this article, whatever theories you believe most likely, I hope you similarly embrace the uncertainty and start thinking about how we deal with it.
7 comments
Comments sorted by top scores.
comment by mad · 2020-10-07T04:42:33.132Z · LW(p) · GW(p)
Interesting that elimination isn't discussed - my jurisdiction (Western Australia) targeted this, and with strict border closures, mandatory 2 week quarantine for new entrants, we've not had a "wild" case in 6 months now (we have regular cases in hotel quarantine, but these don't 'escape' into the wild). Life is normal here: music festivals, dine in restaurants, cinemas, service industry/economy has time to recover, no need to wear masks, and of course no deaths.
New Zealand is another example of this, as is the rest of Australia (Victoria has, in 2 months of lockdown, gone from 700 daily cases to 6), and, funnily enough, Mongolia.
I know there's feasibility problems in a lot of places, especially because Australia and New Zealand, being islands, are pretty easy to isolate, but it seems like it would be much cheaper to improve border controls than to deal with a pandemic.
In conclusion, I know I'm really lucky to live where I do.
comment by remizidae · 2020-10-06T02:19:30.164Z · LW(p) · GW(p)
I’d like to respond to a small piece of this: if a large fraction of the population is naturally immune, how are superspreader events possible?
This is not surprising. It’s possible both that a large fraction of the population is immune, and that occasional events happen to include no or very few naturally immune people—just as flipping a fair coin will sometimes result in an unusual HHHHHHHHHH sequence. If superspreader events were the norm, they would be some evidence against natural immunity—but people mostly seem to cite the same few superspreader events, suggesting that very few social gatherings are superspreader scenarios.
Replies from: mike-harris-1↑ comment by Mike Harris (mike-harris-1) · 2020-10-06T15:48:58.569Z · LW(p) · GW(p)
I did not compute the odds precisely before writing up that section.
The two cases cited have attack rates of 53/61 and 104/122.
For a 25% cross immunity rate that would correspond to ~2% and .4% probability respectively. For a 33% cross immunity rate that would correspond to a .02% and a .0001% probability respectively.
The actual claim of what percentage of the population is immune is fairly nebulous but anything beyond 25% would be hard to justify.
comment by magfrump · 2020-10-09T08:10:29.065Z · LW(p) · GW(p)
In the heterogeneous spread response, you claim that the standard SIR model has predicted past epidemics well. Can you provide a citation for that?
I also suspect that this pandemic is much wider spread than any other comparable event in modern history, so more heterogeneity should be expected.
comment by mingyuan · 2020-10-06T17:59:52.849Z · LW(p) · GW(p)
One thing that I think would help resolve a lot of the confusion here is a better understanding of the clustered nature of COVID spread.
comment by aag · 2020-10-10T23:14:05.772Z · LW(p) · GW(p)
The Atlantic has an excellent article on the importance of super-spreader events to transmission of COVID-19. It explains how some countries have had better success by taking super-spreader events into account:
This Overlooked Variable Is the Key to the Pandemic: It’s not R.
Here are two key paragraphs:
Oshitani told me that in Japan, they had noticed the overdispersion characteristics of COVID-19 as early as February, and thus created a strategy focusing mostly on cluster-busting, which tries to prevent one cluster from igniting another. Oshitani said he believes that “the chain of transmission cannot be sustained without a chain of clusters or a megacluster.” Japan thus carried out a cluster-busting approach, including undertaking aggressive backward tracing to uncover clusters. Japan also focused on ventilation, counseling its population to avoid places where the three C’s come together—crowds in closed spaces in close contact, especially if there’s talking or singing—bringing together the science of overdispersion with the recognition of airborne aerosol transmission, as well as presymptomatic and asymptomatic transmission.
...
Overdispersion should also inform our contact-tracing efforts. In fact, we may need to turn them upside down. Right now, many states and nations engage in what is called forward or prospective contact tracing. Once an infected person is identified, we try to find out with whom they interacted afterward so that we can warn, test, isolate, and quarantine these potential exposures. But that’s not the only way to trace contacts. And, because of overdispersion, it’s not necessarily where the most bang for the buck lies. Instead, in many cases, we should try to work backwards to see who first infected the subject.
comment by zby · 2020-10-10T09:43:15.799Z · LW(p) · GW(p)
I don't know much how the situation is in African countries, Middle East, India or Latin America, but there are two contrasting examples - European culture countries (including USA, Canada) that struggle with the pandemic and East Asian countries that managed to get it under control. There are also Western countries that are doing well - like Iceland or New Zealand and Australia - which is kind of in between - I think they are just remote enough. The main factor seems to be how disciplined the population is. There are many measures that limit the R and in the West we fail to enforce them, be it face masks, limitations for public gatherings or giving accurate and complete information to contact tracers. This is of course complicated by the mistakes that our authorities made - starting with discouraging masks use early in the epidemic - those failures further undermined the public trust in government actions.
We need a plan that is adopted to those circumstances. More bottom up action - to try many approaches locally and see what works and only then scale it up and maybe mandate. My pet idea is to build safe bubbles around us and especially around the most vulnerable. Most of the long and close contacts, that have the biggest probability of spreading the virus, come from our stable social network. Our family, co-workers, schoolmates, friends etc - these are people that can infect us most easily - but they are also people with whom we can negotiate rules. This strategy can be more effective than it seems. It was actually promoted back in April and May - but now we can eventually have one more tool to make it really effective - rapid tests. At home cheap tests can be a game changer here. Support https://www.rapidtests.org/