Thank You, Old Man Jevons, For My Job
post by Closed Limelike Curves · 2019-07-06T18:37:48.146Z · LW · GW · 4 commentsThis is a link post for https://thelimelike.wordpress.com/2019/07/06/thank-you-old-man-jevons-for-my-job/
Contents
4 comments
[Epistemic status: Half-truth.]
[CW: Microeconomics]
Sometime in the 1800s, some random English economist named William Stanley Jevons made an amazing discovery: The demand for coal power is elastic.
This may sound boring as fuck. That’s because it is. A lot of things have price-elastic demand curves. This is probably just another one of those things that should go in the Journal of Things Nobody Has Ever Cared About But May Be Useful to Some Guy with a PhD in a Bizarrely Specific Field. Anyways, that’s why when steam engines became more efficient, British coal consumption shot through the roof.
wat
So anyways, let’s take a look at this graph, taken (With some small edits) from Wikipedia. It’s the main reason why you haven’t lost your job to automation yet, and your only hope for surviving the oncoming robot apocalypse:

So, that graph makes perfect sense, right? No? OK, fair. Let’s go over what everything means.
This is a supply and demand graph, showing the employment before and after a new machine is introduced which allows more work to be done by fewer people. Let’s say it’s some new steam-powered textile machinery, just to make any 19th-century Luddites reading this very angry.
The curve labeled S is the supply curve for labor. It shows how many man-hours of work you can hire at any particular hourly wage. Offer a wage of $20 an hour, and you’ll get more people showing up and offering to work than if you only offered $10, so it’s always upward-sloping — higher wages mean you get more people willing to work.
HR is the hourly revenue curve. It takes as an input how many man-hours are already being used, and represents how many dollars an employer would make if they paid for an extra man-hour of work. Importantly, though, this is also the demand curve for labor: An employer will refuse to hire anyone for more than this amount, because it’ll lose them money, and they will agree to hire anyone willing to work for less than this price.
If you know any microeconomics, you’re going to be taking a look at the point where the two curves intersect. That’s the point the economy natural settles on, the “Equilibrium point.” I’ll write more on this in a future post, but for now, think about what it means if the HR curve is above the supply curve: It means that the employer is willing to hire for a wage higher than what the potential employee is willing to work for. This means that the employer can offer a wage that not only makes him a profit, but is also better than what the employee was hoping for, so we expect that both people would agree to this trade.
Now, here’s the important bit. Let’s take a look at what happens when the new machine is introduced, and you can do, say, 20% more work with the same number of people. What’s going to happen?
Well, the HR curve is going to go up by 20% at every point! After all, workers are producing 20% more, so the amount of profit from hiring an extra worker increases by 20%. Not only have jobs not been lost because of this new technology, more jobs have actually been created, and what’s more, the jobs pay more money. Automation creates jobs and boosts wages.
The mistake in the common naive analysis that automation kills jobs (or that increased steam engine efficiency should reduce coal consumption) is in holding the amount of stuff being produced constant, whether it’s steam power or the amount of things being produced. But it doesn’t stay constant. When things get cheaper — like hiring people to do some manufacturing process, or producing power from coal — people use it more.
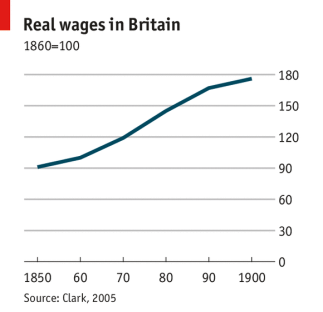
During the Industrial Revolution in Britain, the effect was big enough that wages doubled from 1850-1900.
So anyways, my next post will explain why this is all a lie and you’re actually maybe doomed to lose your job to automation. If you’ve found the problem with this analysis already, feel free to leave it in the comments.
- If you know calculus, this is more accurately described as the derivative of revenue with respect to man-hours.
- Technically I’m ignoring the possibility of a monopsony, which would make the marginal revenue and demand curves stop being equal, but just roll with it for now.
4 comments
Comments sorted by top scores.
comment by anna_macdonald · 2019-07-06T22:22:29.598Z · LW(p) · GW(p)
One problem I see with that analysis is this part:
After all, workers are producing 20% more, so the amount of profit from hiring an extra worker increases by 20%.
If demand isn't being met, or if it's elastic, then increasing your production = increasing your profits. But if demand for your product is not elastic, increasing your production will just leave you with unsold product and decrease your profits; you'd make more money by using those new machines to reduce your work force.
comment by Douglas_Knight · 2019-07-08T18:11:44.631Z · LW(p) · GW(p)
During the Industrial Revolution in Britain, the effect was big enough that wages doubled from 1850-1900.
The Industrial Revolution is not usually dated as beginning in 1850. Often it is dated as ending in 1850. Wages were stagnant 1750-1850. I think it's considered pretty mysterious why wages behaved differently in the two periods.
Replies from: Closed Limelike Curves↑ comment by Closed Limelike Curves · 2019-07-10T21:47:45.031Z · LW(p) · GW(p)
You're right, although 1850-1900 captures the Second Industrial Revolution.
Replies from: habryka4↑ comment by habryka (habryka4) · 2019-07-10T22:07:06.430Z · LW(p) · GW(p)
https://lukemuehlhauser.com/there-was-only-one-industrial-revolution/
(Not saying you are completely wrong, but I do think the idea of multiple industrial revolution is mostly confusing and doesn't help people model the world better)