How Do Induction Heads Actually Work in Transformers With Finite Capacity?
post by Fabien Roger (Fabien) · 2023-03-23T09:09:33.002Z · LW · GW · 0 commentsContents
  How Are Induction Heads Supposed to Work
    The usual explanation
    Fine-grained Hypothesis 1
    Fine-grained Hypothesis 2
  Experiments
    Setup
    Result 1: Induction Works Much Better for Some Tokens Than for Others
    Result 2: Induction Makes Tokens Near to B More Likely
  Appendix
    Spread of Induction Strengths
    Top and Bottom 10 Tokens for A and B Powers
None
No comments
Thanks to Marius Hobbhahn for helpful discussions and feedback on drafts.
I think the usual explanation of how induction heads work in actual Transformers, as described in Anthropic’s Mathematical Framework, is incomplete. Concretely, it seems like the following two statements are in contention:
- Induction (the behavior AB…A → B) works no matter what A and B are.
- The embedding dimension of real-world transformers is small enough that there are limits to how much information fits in the residual stream and in the OV channel.
The main reason is that there isn’t enough capacity to copy “A” to the second position and “B” to the last position without very lossy compression.
In this post:
- I present two fine-grained hypotheses of how induction might happen in Transformers with finite capacity;
- I explain why both of them require surprisingly strong and efficient compression mechanisms for induction to work regardless of A and B;
- I present some quick experimental results about the input-output behavior of a 2-layer Transformer on induction sequences, which suggest that:
- The ideal induction mechanism is incomplete,
- Neither of my two fine-grained hypotheses explain the real induction behavior well.
I would appreciate if someone could find better fine-grained hypotheses. I think it could lead to a better understanding of how Transformers deal with capacity constraints.
Further experiments about real induction behavior could be nice exercises for people starting to do Transformer interpretability.
How Are Induction Heads Supposed to Work
The usual explanation
Let’s say you have a sequence AB…A. The previous token head copies the A at position 1 to position 2. Then this copied A token is the key to an attention head, which matches the A at the last position, which is used as query at the last position. B at position 2 is used as value, and therefore gets copied over at the last position, enabling the network to predict B.
Fine-grained Hypothesis 1

Here is a detailed explanation of how induction heads work, which tracks capacity constraints:
- When A is copied over to position 2, it does not overlap with B (no matter what A & B are). For that to happen, B only occupies a (strict) subspace of the residual stream, and only a compressed version of A is copied over to position 2 in the remaining subspace B does not use;
- When B is copied over to the last position, it is copied over by attention heads through the OV circuit. But these circuits temporarily store the vectors in nb_induction_heads*embedding_size/nb_heads dimensions, which is tiny (64 in the case of one head of GPT2-small, out of 12 heads, 32 in the case of one head of Neel’s 2-layer attention-only model, out of 8 heads). Therefore, only a low-rank approximation of B is copied over to the last position.
What is weird in this detailed hypothesis:
- The embedding stream should be wide enough to store 2 compressed copies of the token at position 2, which looks hard to do, especially given that other mechanisms in the Transformer need to access token B at position 2 and might suffer if B is compressed to much at this position (is there enough place in the 768 dimensions of GPT2-small, or in the 256 dimensions of Neel’s 2-layer model?);
- For induction to work properly, it isn’t enough to copy a rough approximation of B to the last position. The information being copied over should in principle fully specify B. With only one or two attention heads, this looks really difficult to do.
Note: token A can be compressed heavily without induction heads failing too badly, it even helps with “fuzzy matching”.
Fine-grained Hypothesis 2

Here is another detailed explanation:
- Token A is just added to B with a flipped sign. As a result, right before the induction head reads position 2, the residual stream contains B - A (or more precisely, their corresponding vectors in the embedding space);
- B - A is used both as key and value: B - A is close enough to A to match the key at the last position, and B - A gets copied over to the last position. The network outputs B because B=(B - A) + A (the +A comes from the residual connection).
This too requires extreme and efficient compression:
- Token A needs to be copied to position 2 and then to the last position without too much loss, otherwise it won’t cancel out properly with A at the last position;
- Token B still needs to be copied through the second layer’s OV circuit without too much loss, otherwise only a very crude approximation of B will be recoverable by the unembedding layer.
Experiments
Setup
I use sequences of the form …AB…A, where A and B are random tokens and “…” are sequences of 10 random tokens. I compare the logprobs at the last position of those “induction sequences” with the logprobs of the same sequences but where the all tokens expect the last one have been shuffled (such that B is almost never right after A). If there are induction heads which work regardless of context and tokens, then B should be more probable after an “induction” sequence than after a “shuffled” sequence.
The metric I use is the difference of log odd-ratios before and after shuffling . I call this induction strength. Bigger induction strength means the network predicts B more strongly after A when there has been AB in the context.
Experiments are done with Neel Nanda’s 2-layer attention only model, using the TransformerLens library. The code can be found here.
Result 1: Induction Works Much Better for Some Tokens Than for Others
For a given token, I measure it’s average induction strength across 256 sequences where it is token A (“A power”), and it’s average induction strength across 256 sequences where it is token B (“B power”). I plot the histogram of A and B powers across the first 10000 tokens.

To understand what this means in terms of log odd-ratios, I plot the actual log odd-ratios before and after shuffling for tokens “ Fab” as fixed A, and “ien” as fixed B for 4096 sequences.
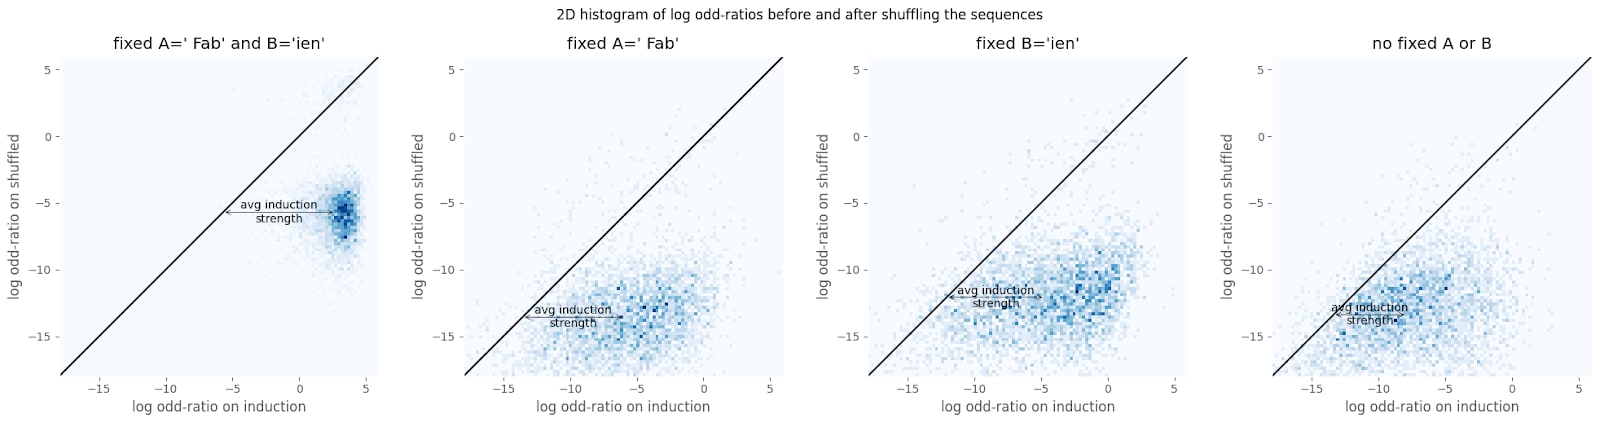
Observations and interpretation:
- Induction strength is very different from one token to the next. This suggests that the network is not doing “ideal induction”.
- Induction strength is quite high for almost all token. This mostly rules out the network achieving high compression by only dealing with a small subset of tokens.
- A and B powers have similar spreads. This is not expected if hypothesis 1 is correct: hypothesis 1 would predict that the B powers would have a bigger spread, since hypothesis 1 relies on B being compressed without too much loss (and doesn’t rely on A’s good compression too much). Therefore, if the compression scheme relies on working for some tokens more than for others, then the spread should be higher for the critical token role, which is B in hypothesis 1.
Result 2: Induction Makes Tokens Near to B More Likely
I measured the induction strength but instead of measuring , I measured where B* is a token near to B in the unembedding space (according to the cosine similarity). I also measured it for where R are random tokens (I draw new random tokens for each experiment). I measure induction strengths on 4096 sequences.

Induction strengths of tokens near B are roughly half-way between the induction strength of B and the induction strengths of random tokens.
Observations and interpretation:
- The fact that induction “bleeds” to nearby tokens might be a sign that the network is doing some compression of token B, and further confirms that the network is not doing ideal induction.
- The fact that there is a huge drop in induction strengths between B, and its 1st neighbor, but a relatively small drop between the 1st neighbor and the 15th, suggests that something more is happening. For example, it could be the case that it matters a lot that B is present in the context, in a way that neither hypothesis 1 nor hypothesis 2 would predict.
Appendix
Spread of Induction Strengths

Top and Bottom 10 Tokens for A and B Powers
std are the 1-sigma standard deviation divided by sqrt(number of samples), over 4096 samples.

0 comments
Comments sorted by top scores.