We have some evidence that masks work
post by technicalities · 2021-07-11T18:36:46.942Z · LW · GW · 13 commentsContents
  “Observational Window”
  “Regional Effects”
  “Uniform Regional Transmissibility”
  “No Mask Variation”
  “Data Extrapolation”
None
13 comments
by Gavin Leech and Charlie Rogers-Smith
Our work on masks vs COVID at the population level was recently reproduced [LW · GW] with a bunch of additional experiments. These seem to cast doubt on our results, but we think that each of them is misguided. Since the post got some traction on LW and Marginal Revolution, we decided to respond.
Nevertheless, thanks to Mike, who put a lot of work in, and who was the only person in the world to check our results, despite plenty of people trying to gotcha us on Twitter.
“Observational Window”
Best-guess summary of Mike’s analysis: he extends the window of analysis by a bit and runs our model. He does this because he’s concerned that we chose a window with low transmissibility to make masks look more effective than they are. However, he finds similar results to the original paper, and concludes that our results seem robust to longer periods.
But as our paper notes, a longer window isn’t valid using this data. After September, many countries move to subnational NPIs, and our analysis is national. The way our NPI data source codes things means that they don't capture this properly, and so they stop being suitable for national analyses.
Estimates of national mask effect after this don’t properly adjust for crucial factors, and so masks will "steal" statistical power from them. So this analysis isn’t good evidence about the robustness of our results to a longer window.
“Regional Effects”
MH: "If mask wearing causes a drop in transmissibility, then regions with higher levels of mask wearing should observe lower growth rates."
Best-guess summary of Mike’s analysis: A correlational analysis between the median wearing level of a region and the (the expected number of new cases per initial case in a region) that our model infers. (What he calls ‘growth rates’, but which are not growth rates.) He claims that if wearing is effective then the correlation should be negative. The intuition is that if masks work, then countries with lots of mask-wearing should have lower transmissibility. Instead, he finds that the correlation is positive.
This is interesting, but the conclusion doesn’t seem right. You can tell a bunch of stories about why mask-wearing might be correlated with , independent of mask effectiveness. For example, it seems plausible that when transmissibility increases, more people wear masks. Overall, the correlation between average mask-wearing and constant transmissibility is such weak evidence that we honestly don’t know in which direction to update our beliefs based on this result.
It’s also worth highlighting how much information this analysis discards. He takes a scalar (the regional ) and then plots it against a scalar (the median wearing level). But this averages away almost all of the information.


It's hard to say anything about the relationship between and wearing as a static average. You have to look at changes in mask-wearing.
MH: "Within a given region, increased mask usage is correlated with lower growth rates (the 25% claimed effectiveness), but when comparing across regions masks seem to be ineffective."
Even given fixes to the above, this doesn’t follow. Our posterior with a median of 25% is a pooled estimate across regions.
Endogeneity (the estimate being biased by, for instance, people masking up in response to an outbreak) is a real concern, but the above doesn’t show this either. We can see how serious endogeneity could be by looking at the correlation between mask level and case level: = 0.05.
“Uniform Regional Transmissibility”
MH: "The first experiment was to force all regions to share the same base transmissibility. This provided an estimate that masks had an effectiveness of -10%"
Best-guess summary of Mike’s analysis: Mike sets all s to the same value and runs the model. He does this to isolate the ‘relative’ effect of mask-wearing -- i.e. the effect from day-to-day changes in wearing, as opposed to absolute mask-wearing.
I think the intuition comes from the fact that we use two sources of info to determine mask-wearing effectiveness: the starting level of mask-wearing in a region, and day-to-day changes. It would be cool to see what we infer from only day-to-day changes in wearing. But this method doesn’t achieve this; instead, setting all the s to be the same will bias the wearing effect
To see this, suppose we have data on two regions. Region A has an and B has an , but we don’t know these values. Further assume that region B has more mask-wearing, which is consistent with Mike’s finding that there’s a small positive correlation between and mask-wearing. What happens if we force these values to be the same, say ? Well, the model will use the mask-wearing effect to shrink A’s 1.0 down to 0.5, and to pull B’s 1.0 up to 1.5. And since B has more mask-wearing relative to A, this is only possible when the mask-wearing effect is negative. So fixing region s to be the same creates a strong negative bias on the mask effect estimate.
Can we do better? We think so! As we mentioned to Mike in correspondence, a better way to isolate the effect from day-to-day changes in wearing would be to zero-out wearing at the start of the period, so that no information from wearing levels can inform our estimate of R0. We tried this analysis and got a 40% reduction in R from mask-wearing, with large uncertainty (because we’re removing an information source).
“No Mask Variation”
MH: "The next experiment was to force each region to use a constant value for mask wearing (the average value in the time period)."
Best-guess summary of Mike’s analysis: let’s isolate the absolute effect now! To do this, set mask-wearing to be constant across the period.
Most of what our model uses to estimate the effect is day-to-day changes in wearing and transmission. If mask-wearing is set constant, our model will still be ‘learning’ about the mask-wearing effect from day-to-day changes in transmissibility, even if mask-wearing doesn’t change--it will just be learning from false data. Setting mask-wearing constant is not [inferring nothing from day-to-day changes in transmission], it’s inferring false things.
“Data Extrapolation”
MH: "the failure of large absolute differences in variable X across regions to meaningfully impact the observed growth rate ... should make us skeptical of large claimed effects"
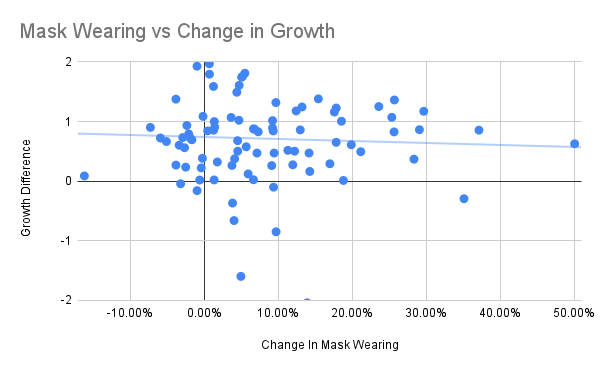
Best-guess summary of Mike’s analysis: Let’s compare changes in wearing from April to May to changes in growth rates. If masks work then we should find a strong negative correlation.
The method:
- For April and May, take the average wearing
- May average mask wearing - April average mask wearing (x-axis).
- AprilCaseRatio = Cases @ end April / cases @ start April
- MayCaseRatio = Cases @ end May / cases @ start May
- “Growth rate” = AprilCaseRatio / MayCaseRatio (y-axis).
- Scatterplot each region
(This throws away even more useful information -- picking out two days in April and May throws away 96% of the dataset.)
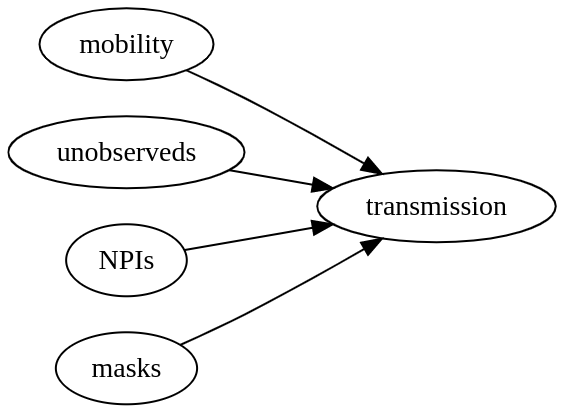
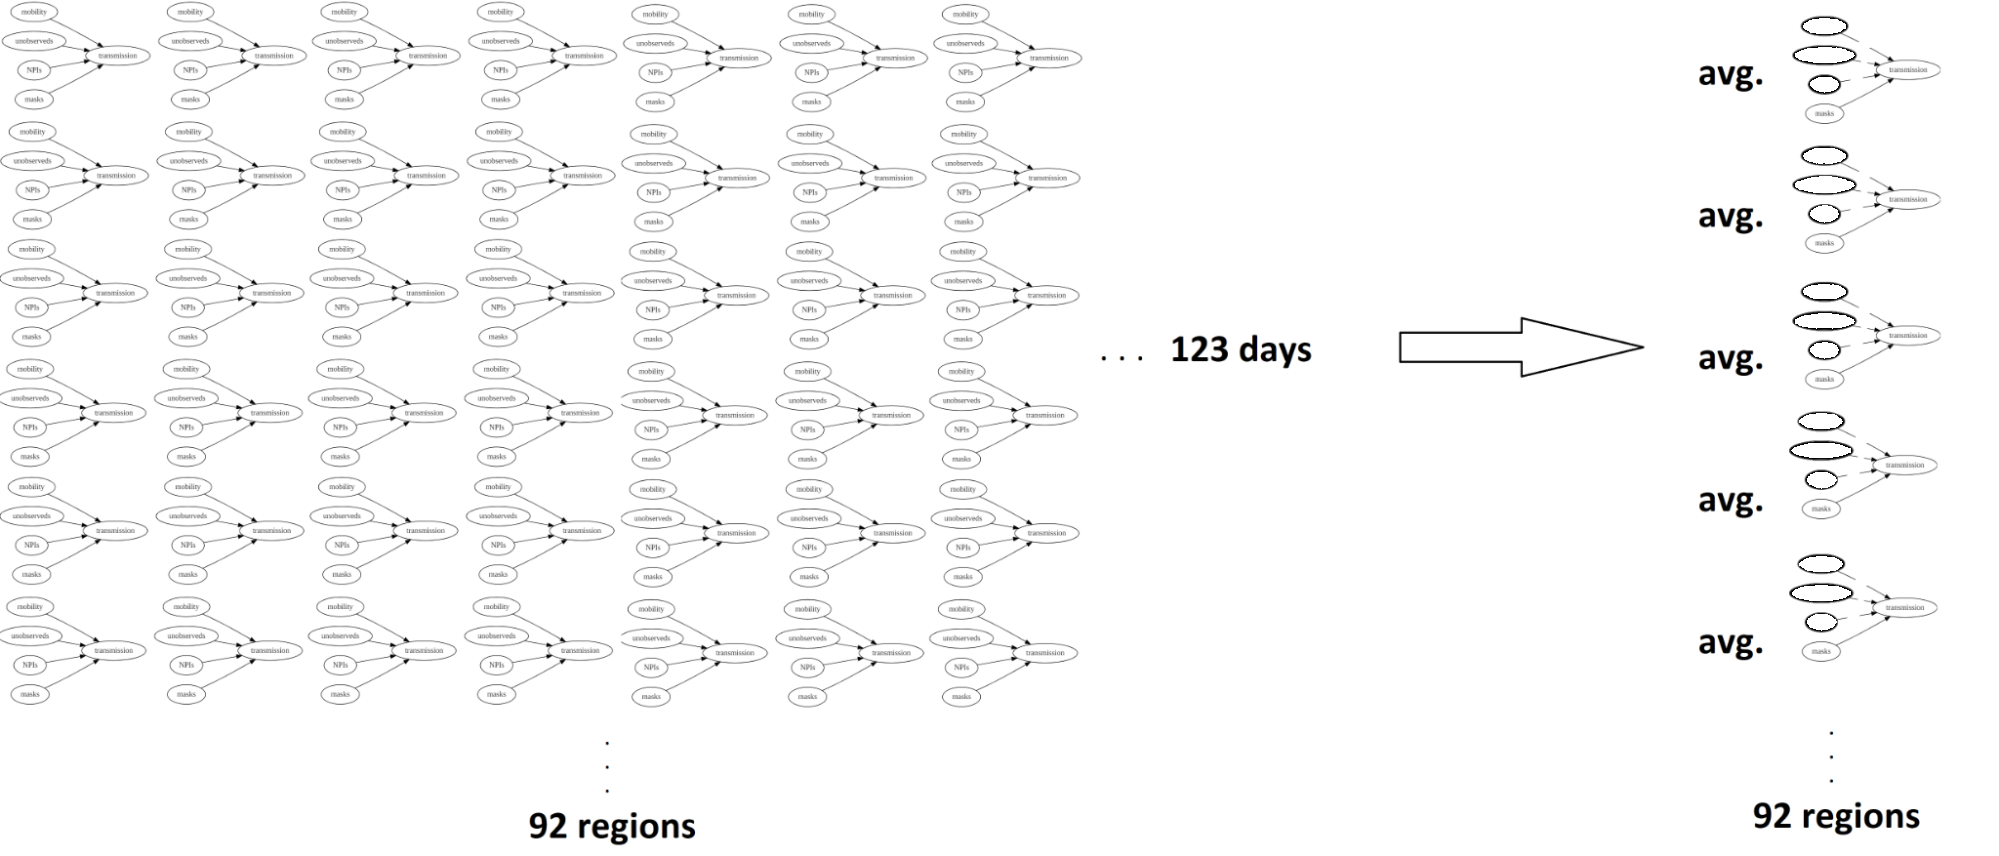
But this analysis doesn’t account for any of the known factors on transmission. The crux here is whether we’d expect to ‘see’ the effect of wearing amidst all the variation in other factors. Averaging over 90 or so regions could smooth out random factors. However, if factors are persistent across regions -- factors that, for example, result in increased transmission across most countries -- then this method will not uncover the wearing effect. And in fact there are strong international trends in factors in May 2020. We wouldn’t update much unless the correlation was particularly strong.
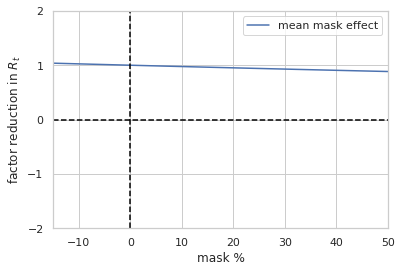
However, let’s assume we could find the wearing effect using this method. Mike implies this slope should be more strongly negative than he observes. How negative should it be, under our model (25% reduction in due to masks)? Let’s look at Mike’s plot and compare it to the mean of our posterior (which you shouldn’t do but anyway):


The slope he finds is similar to our model estimate - in fact it’s more negative. (Looks like a decrease in Growth Difference for +50% wearing.) In our plot, y is the reduction in , not Mike’s ratio of case ratios, but it gives you an idea of what a point estimate of our claim looks like on a unit scale, on the same figure grid.
It's difficult to see medium-sized effects with methods this simple, and this is why we use a semi-mechanistic model. Correlation analysis between cases (or growth) vs wearing neglects important factors we need to adjust for (e.g. mobility at 40% effect!). Moreover, doing it in the way described neglects a lot of data.
(Charlie wants to indicate that he isn't confident in the following paragraph -- not because he disagrees, but because he hasn’t been following the broader literature.)
Even if the experiments above showed what they purport to, Mike's title, ‘We Still Don’t Know If Masks Work’, would still be misleading. By this point we have convergent lines of evidence: meta-analyses of clinical trials, slightly nightmarish animal models, mechanistic models, an ok cloth mask study. We should get the big RCT results soon: I (Gavin) am happy to bet Mike $100 that this will find a median reduction in R greater than 15% (for the 0-100% effect).
Our paper is observational, and there are limits to how strong such evidence can be. Mike says "they are not sufficient to prove a causal story"; this much we agree on.
Lastly: we exchanged 13 emails with Mike, helping him get the model converging and explaining most of these errors (though not as extensively). It was disappointing to find none of them corrected, no mention of our emails, no code, and no note that he had posted his work.
13 comments
Comments sorted by top scores.
comment by Mike Harris (mike-harris-1) · 2021-07-30T04:48:21.593Z · LW(p) · GW(p)
I'd like to respond to some of the points raised.
First I'd like to apologize for not reaching out to you before publishing my critique, I tried to integrate your responses from our email conversation but should have given you a chance to respond before publishing.
A minor point, for the data extrapolation you are reading the graph incorrectly. A higher growth difference meant that the growth rate (a rough approximation of R0) fell more sharply. The point of this section was not that the effect wasn't large, but that it pointed weakly in the wrong direction. Regions which increased mask wearing the most had their growth rates fall more slowly. I don't think this is strong evidence, but it does point against the effectiveness of mask wearing. This is the spreadsheet used to compute the graph:
The core point of dispute if I understand it correctly is that knowing the absolute level of mask wearing in a region does not give evidence as to the overall R0 (even taking into account mobility and NPIs), but knowing the change in mask wearing over time gives evidence as to the change in R0.
In the model in your paper the absolute effect and relative effect are not disambiguated and an effect size mean of 25% reduction is observed.
In your proposed specification you try to isolate the relative effect by zeroing out starting mask wearing and observe a higher impact.
In my proposed specification I try to isolate the absolute effect by zeroing out the relative changes and observe a smaller impact.
These two observations don't contradict each other. The data is consistent with two distinct causal stories.
-
High inherent transmission -> Mask Wearing -> Lower transmission. This is your preferred model and indicates that the absolute effect is spurious.
-
High inherent transmission -> Mask Wearing + Lower Transmission later. This is my preferred model and indicates that the relative effect is spurious.
One reason to favor the second story is that although the model is described as measuring R_0, it is actually measuring Rt. The model does not include population infections as a modifier to the growth rate. This is a known causal factor which would artificially make masks look more effective.
As further evidence that our actual belief states are not too far apart, 15-25% reduction in case load (different from R0) was my best guess for the results of the mask RCT. I will make the $100 bet with the caveat being that payment is in the form of a donation to GiveWell.
Replies from: technicalities↑ comment by technicalities · 2021-07-30T15:52:49.972Z · LW(p) · GW(p)
Great! Comment below if you like this wording and this can be our bond:
"Gavin bets 100 USD to GiveWell, to Mike's 100 USD to GiveWell that the results of NCT04630054 will show a median reduction in Rt > 15.0 % for the effect of a whole population wearing masks [in whatever venues the trial chose to study]."
↑ comment by Mike Harris (mike-harris-1) · 2021-07-30T16:40:41.344Z · LW(p) · GW(p)
I can't accept the wording because the masking study is not directly measuring Rt. I would prefer this wording
"Gavin bets 100 USD to GiveWell, to Mike's 100 USD to GiveWell that the results of NCT04630054 will show a median reduction in cumulative cases > 15.0 % for the effect of a whole population wearing masks [in whatever venues the trial chose to study]."
Replies from: technicalities↑ comment by technicalities · 2021-07-31T09:47:24.207Z · LW(p) · GW(p)
Sounds fine. Just noticed they have a cloth and a surgical treatment. Take the mean?
Replies from: mike-harris-1↑ comment by Mike Harris (mike-harris-1) · 2021-07-31T18:35:52.810Z · LW(p) · GW(p)
Sure.
My current belief state is that cloth masks will reduce case load by ~15% and surgical masks by ~20%.
Without altering the bet I'm curious as to what your belief state is.
Replies from: mike-harris-1↑ comment by Mike Harris (mike-harris-1) · 2021-09-01T14:31:21.644Z · LW(p) · GW(p)
The study was just released https://www.poverty-action.org/study/impact-mask-distribution-and-promotion-mask-uptake-and-covid-19-bangladesh
For the cloth mask they got a 5% reduction in seroprevalence (equivalent to 15% for 100% increase) and for surgical masks they got an 9.3% reduction (equivalent to 28% for 100% increase).
I unequivocally lost the bet and will send my donation. Let me know if you have a preferred charity.
Replies from: technicalities↑ comment by technicalities · 2021-09-02T07:34:48.027Z · LW(p) · GW(p)
Givewell's fine!
Thanks again for caring about this.
comment by IlyaShpitser · 2021-07-12T21:54:58.895Z · LW(p) · GW(p)
Should be doing stuff like this, if you want to understand effects of masks:
https://arxiv.org/pdf/2103.04472.pdf
comment by J Mann · 2021-07-19T15:43:35.470Z · LW(p) · GW(p)
Thanks for this engagement, it's great to see.
Stepping back to a philosophical point, a lot of scientific debates come down to study design, which is at a level of expertise in statistics that is (a) over my head and (b) an area where reasonable experts apparently can often disagree.
My normal strategy is to wait for Andrew Gelman to chime in, but (a) that doesn't apply in all cases, and (b) philosophically, I can't really justify even that except in kind of a brute Bayesian sense.
I'd love to get a good sense of how confident we can be that masks work - but since I'm not competent on the stats, I guess I'll wait for the RCTs and stick with "can't hurt, may well help" until then. (Like Vitamin D, but with a higher percentage of "may well help.")
↑ comment by technicalities · 2021-07-19T16:12:44.205Z · LW(p) · GW(p)
Sadly Gelman didn't have time to destroy us. (He rarely does.)
Replies from: J Manncomment by Mike Harris (mike-harris-1) · 2021-07-30T07:33:33.516Z · LW(p) · GW(p)
I am also not convinced that zeroing out mask levels at the start solves this problem. The random walk variable is also a learned per region factor. Even if the starting value can no longer be influenced by mask levels, the starting value + 1 month of random walk value for the region can be influenced.