How Roodman's GWP model translates to TAI timelines
post by Daniel Kokotajlo (daniel-kokotajlo) · 2020-11-16T14:05:45.654Z · LW · GW · 5 commentsContents
5 comments
How does David Roodman’s world GDP model translate to TAI timelines?
Now, before I go any further, let me be the first to say that I don’t think we should use this model to predict TAI. This model takes a very broad outside view and is thus inferior to models like Ajeya Cotra’s [LW · GW] which make use of more relevant information. (However, it is still useful for rebutting claims that TAI is unprecedented, inconsistent with historical trends, low-prior, etc.) Nevertheless, out of curiosity I thought I’d calculate what the model implies for TAI timelines.
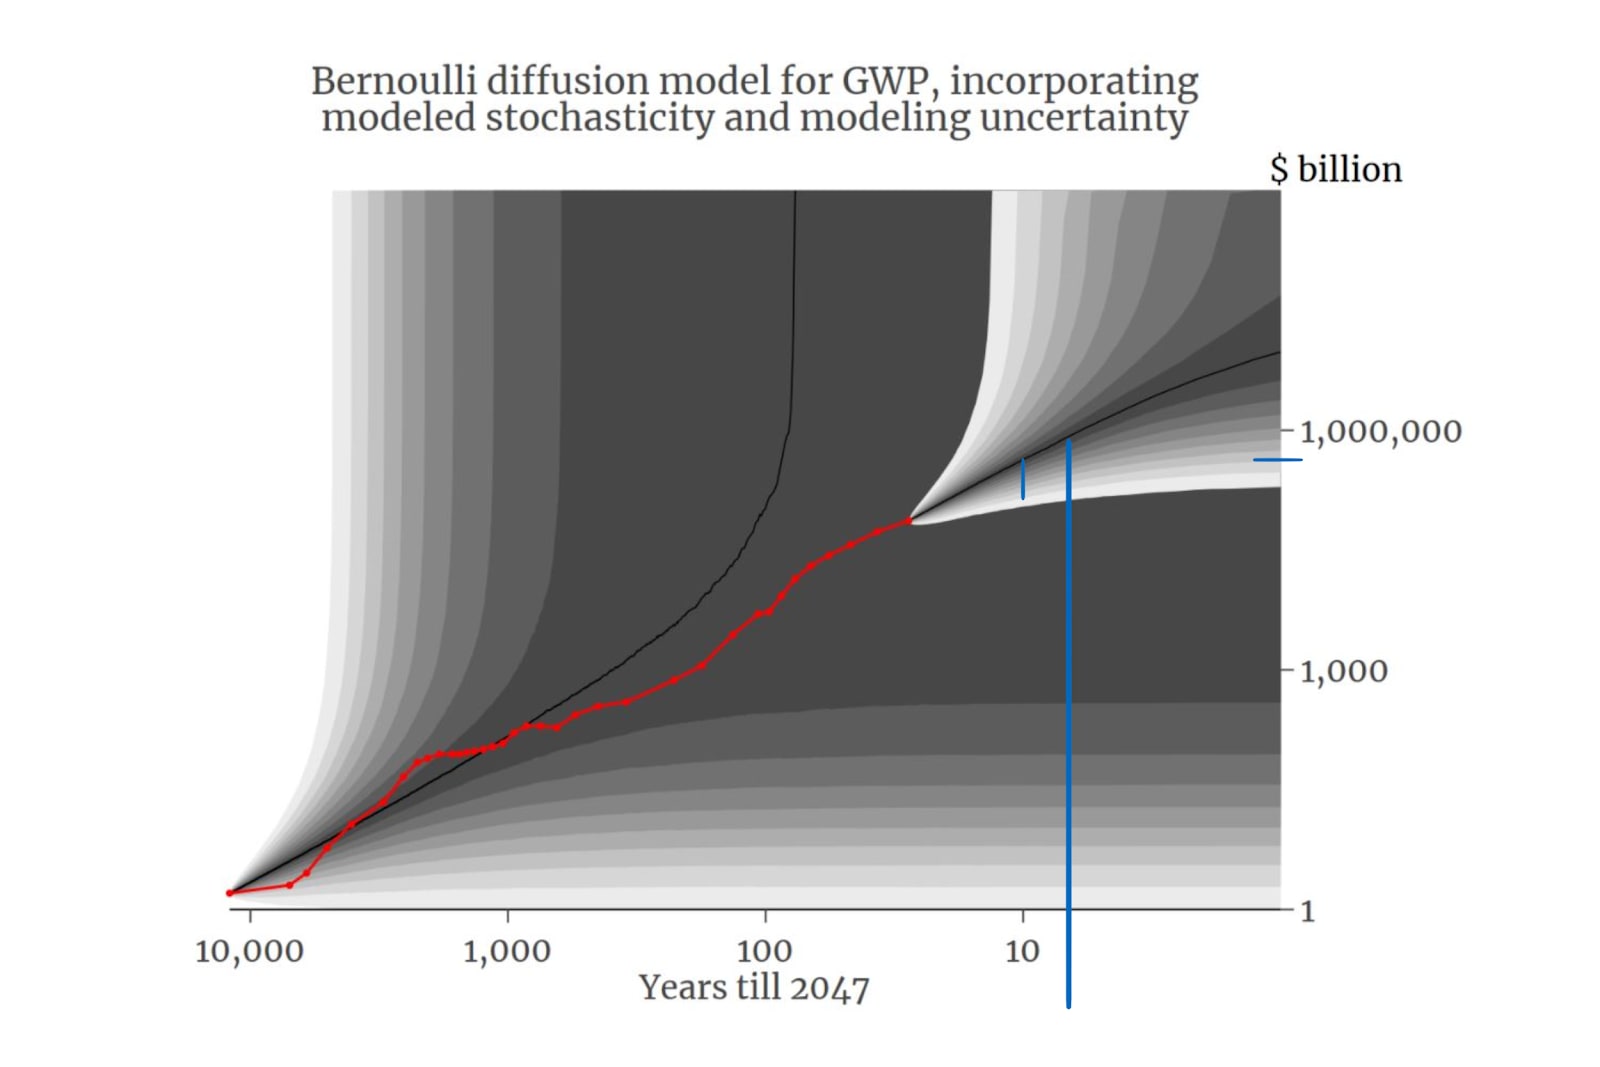
Here is the projection made by Roodman’s model. The red line is real historic GWP data; the splay of grey shades that continues it is the splay of possible futures calculated by the model. The median trajectory is the black line.
I messed around with a ruler to make some rough calculations, marking up the image with blue lines as I went. The big blue line indicates the point on the median trajectory where GWP is 10x what is was in 2019. Eyeballing it, it looks like it happens around 2040, give or take a year. The small vertical blue line indicates the year 2037. The small horizontal blue line indicates GWP in 2037 on the median trajectory.
Thus, it seems that between 2037 and 2040 on the median trajectory, GWP doubles. (One-ninth the distance between 1,000 and 1,000,000 is crossed, which is one-third of an order of magnitude, which is about one doubling).
This means that TAI happens around 2037 on the median trajectory according to this model, at least according to Ajeya Cotra’s definition of transformative AI as “software which causes a tenfold acceleration in the rate of growth of the world economy (assuming that it is used everywhere that it would be economically profitable to use it)... This means that if TAI is developed in year Y, the entire world economy would more than double by year Y + 4.”
What about the non-median trajectories? Each shade of grey represents 5 percent of the simulated future trajectories, so it looks like there’s about a 20% chance that GWP will be near-infinite by 2040 (and 10% by 2037). So, perhaps-too-hastily extrapolating backwards, maybe this means about a 20% chance of TAI by 2030 (and 10% by 2027).
At this point, I should mention that I disagree with this definition of TAI; I think the point of no return (which is what matters for planning) [LW · GW] is reasonably likely to come several years before TAI-by-this-definition appears. (It could also come several years later!) For more on why I think this, see this post. [AF · GW]
Finally, let’s discuss some of the reasons not to take this too seriously: This model has been overconfident historically. It was surprised by how fast GDP grew prior to 1970 and surprised by how slowly it grew thereafter. And if you look at the red trendline of actual GWP, it looks like the model may have been surprised in previous eras as well. Moreover, for the past few decades it has consistently predicted a median GWP-date of several decades ahead:
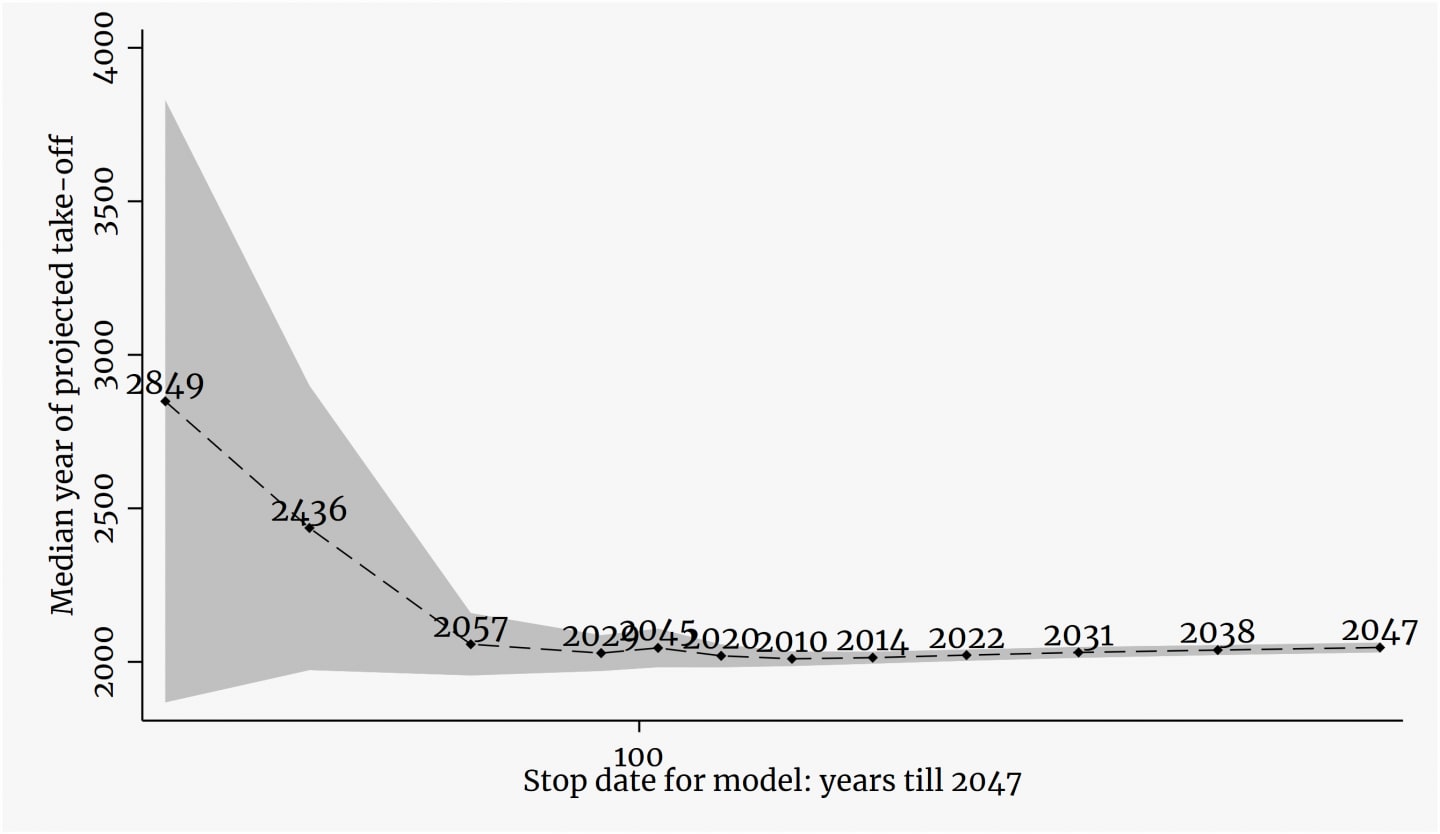
The grey region is the confidence interval the model predicts for when growth goes to infinity. 100 on the x-axis is 1947. So, throughout the 1900’s the model has consistently predicted growth going to infinity in the first half of the twenty-first century, but in the last few decades in particular, it’s displayed a consistent pattern of pushing back the date of expected singularity, akin to the joke about how fusion power is always twenty years away:
| Model has access to data up to year X = | Year of predicted singularity | Difference |
| 1940 | 2029 | 89 |
| 1950 | 2045 | 95 |
| 1960 | 2020 | 60 |
| 1970 | 2010 | 40 |
| 1980 | 2014 | 34 |
| 1990 | 2022 | 32 |
| 2000 | 2031 | 31 |
| 2010 | 2038 | 28 |
| 2019 | 2047 | 28 |
The upshot, I speculate, is that if we want to use this model to predict TAI, but we don’t want to take it 100% literally, we should push the median significantly back from 2037 while also increasing the variance significantly. This is because we are currently in a slower-than-the-model-predicts period, but faster-than-the-model-predicts periods are possible and indeed likely to happen around TAI. So probably the status quo will continue and GWP will continue to grow slowly and the model will continue to push back the date of expected singularity… but also at any moment there’s a chance that we’ll transition to a faster-than-the-model-predicts period, in which case TAI is imminent. EDIT: And indeed, TAI could be the thing that causes the transition to a faster-than-the-model-predicts period.
Thanks to Denis Drescher and Max Daniel for feedback on a draft. This research was conducted at the Center on Long-Term Risk and the Polaris Research Institute.
5 comments
Comments sorted by top scores.
comment by gjm · 2020-11-16T17:00:10.184Z · LW(p) · GW(p)
I'm puzzled by a couple of features of the (first) graph.
- I understand what the grey contours at top right mean, but what are the grey contours at bottom left?
- I understand what the black line at top right is, but what's the black line that starts at bottom left and zooms off to infinity somewhere around 1950?
↑ comment by Vaniver · 2020-11-16T18:47:23.954Z · LW(p) · GW(p)
Presumably there are two different contour sources: the model fit on the historical data initialized at the beginning of the historical data, and the model fit on the historical data initialized at the end of the historical data. The 'background' lets you see how the actual history compared to what the model predicts, and the 'foreground' lets you see what the model predicts for the future.
And so the black line that zooms off the infinity somewhere around 1950 is the "singularity that got cancelled", or the left line on this simplistic graph.
↑ comment by Daniel Kokotajlo (daniel-kokotajlo) · 2020-11-16T19:07:19.831Z · LW(p) · GW(p)
Yes, though as a nitpick I don't think the black line is the singularity that got cancelled; that one was supposed to happen in 2020 or so, and as you can see the black line diverges from history well before 1950.
comment by adamShimi · 2020-11-17T11:23:42.640Z · LW(p) · GW(p)
Reading this would be way more insightful if you recapped the proposed model in the introduction. As it is, I need to read another post (which I probably will, but didn't for the moment) before understanding how the model works, and where it might fail.
Replies from: daniel-kokotajlo↑ comment by Daniel Kokotajlo (daniel-kokotajlo) · 2020-11-17T11:33:27.806Z · LW(p) · GW(p)
Thanks for the feedback. I'll think about it. To be honest I feel like I have higher priorities right now, but going forward I'll update more towards doing recaps in my posts.