Does making unsteady incremental progress work?
post by peterbarnett · 2021-03-05T07:23:30.338Z · LW · GW · 4 commentsThis is a link post for https://peterbarnett.org/2021/03/05/unsteady-progress/
Contents
4 comments
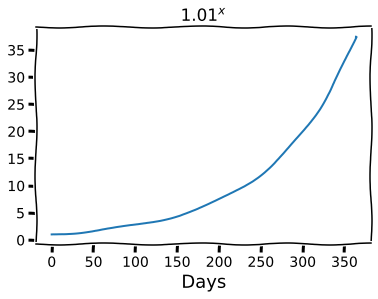
There's a commonly repeated piece of wisdom about incremental improvement which says it's important to know the difference between and as gets very large. If you are making 1% improvement per day at a thing, over a year your progress goes like this (note that because of decreasing marginal returns your metrics probably won't go like this, but skill using some scale will):
While if you are neglecting a skill and so losing 1% a day your progress will go like this:
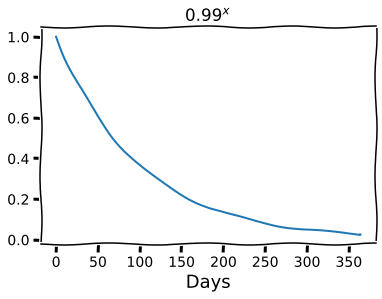
This is true and good in the world of maths; if you make steady incremental progress you keep improving, your gains compound and you shoot to the moon, while if you slowly decrease then things fall to zero. And this is kind of just a 2% difference, the difference between +1% and -1% per day.
I was a bit dubious of this advice for the "real world", because in the real world making 1% progress every day is often really hard. Sometimes you make big leaps, sometimes you fall back a bit. So rather than doing , it's more like .
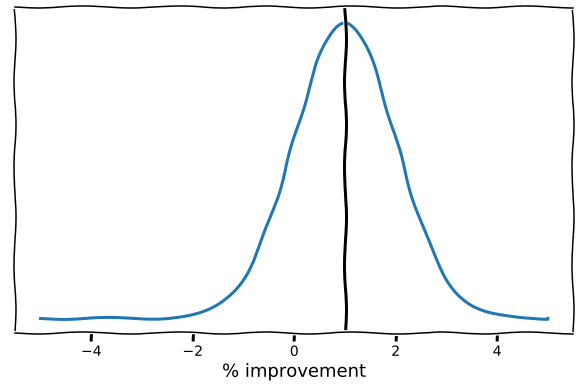
So I decided to test this, drawing the percent improvement from a distribution which was centered on 1%, but could be bigger or smaller:
With this varying, but still on-average positive improvement, a single trajectory looks like this:
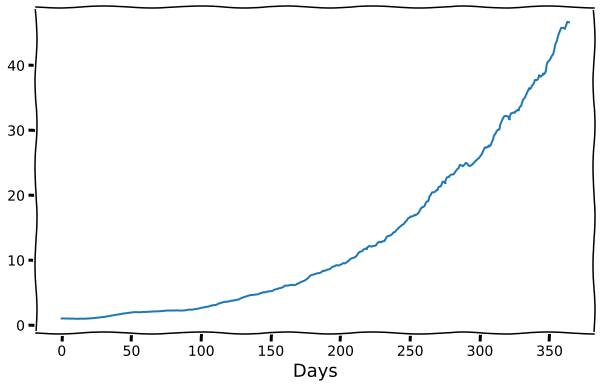
This looks good! It increases similarly to the case without any variation. This is pretty robust when we run the same thing a bunch of times:
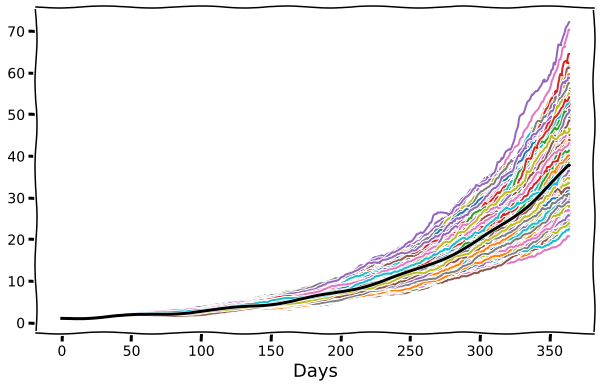
Here the rainbow lines are individual runs with variation, and the solid black line is the case with no variation. With the randomness there is a bit more uncertainty about where it ends up, but it's still broadly clustered around the original, and we don't see any of the samples collapse to zero. The final distribution of improvement after 365 days looks like this:
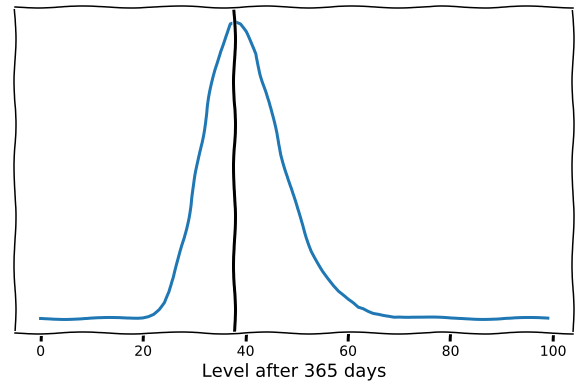
Still centered around the same value but with a fair bit of variation. And in fact, a slightly longer tail on the right; so with random variation you're likely to end up better than the no-variation case... but this definitely relies on a bunch of assumptions and probably isn't very robust.
I guess the moral of the story is that it's great to make steady incremental progress every day, but it's also good to make unsteady progress as long as on average you improve every day.
4 comments
Comments sorted by top scores.
comment by Steven Byrnes (steve2152) · 2021-03-05T12:58:09.437Z · LW(p) · GW(p)
There's a formula! Derive it by taking the log and apply the Central Limit Theorem. Final result should be a log-normal distribution, right?
I put something like that as an example in the Wikipedia article on Benford's law. (cf. "Multiplicative fluctuations") That's why it's fresh in my mind :-)
comment by viviers · 2021-03-05T10:09:11.965Z · LW(p) · GW(p)
Awesome post! I wonder if there's a take-home that can improve motivation for some people here. I'm not convinced that telling people they don't have to be perfect everyday will work. It could give them an out. A rationalisation on any given day that "it's okay to slack today if I pull up the average later on".
Also how do you create these graphs? They're awesome
Replies from: ChristianKl, peterbarnett↑ comment by ChristianKl · 2021-03-07T15:34:23.322Z · LW(p) · GW(p)
It's possible to be stuck in local maxima for various optimization pressures. There are often cases where you can either do a task in the way that was presently most effective for you or try new ways to do the task.
↑ comment by peterbarnett · 2021-03-05T10:49:33.635Z · LW(p) · GW(p)
Thanks! Yeah, I definitely think that "it's okay to slack today if I pull up the average later on" is a pretty common way people lose productivity. I think one framing could be that if you do have an off day, that doesn't have to put you off track forever, and you can make up for it in the future.
I make the graphs using the [matplotlib xkcd mode](https://matplotlib.org/stable/api/_as_gen/matplotlib.pyplot.xkcd.html), it's super easy you use, you just put your plotting in a "with plt.xkcd():" block