Microcovid Becoming Less Useful
post by jefftk (jkaufman) · 2022-02-20T03:50:02.301Z · LW · GW · 13 commentsContents
13 comments
I want to start by saying how much I appreciate what the volunteers behind Microcovid have done. Providing a risk calculator has been really helpful to a lot of people. There's also been a lot of value in running a centralized estimate of the impact of different mitigations.
On the other hand, at this point, I think it has become substantially less useful, and in many cases is leading people to seriously overestimate the level of precautions that are appropriate for their particular situation:
Its data on prevalence is stale, because the automatic updater last ran successfully on 2022-02-07.
To determine how risky things are in your area it uses the average number of cases from last week. When cases are rising, it extrapolates to predict growth. On the other hand, when cases are falling (as they are now here, and have been for a while) it does not extrapolate and assumes that cases have stayed flat.
It's models the people you interact with as being equally likely to currently be infectious, regardless of their vaccination status. Vaccinated people, however, are less likely to get covid and are infectious for a shorter time period. [EDIT: possibly it is modeling the "less likely to get covid" piece but not "less likely to transmit if infected" and "infectious for less time" pieces?]
-
It defaults to a risk budget of 200 microcovids per week, a 1% annual chance of getting covid, regardless of what you tell it for your vaccination status. The highest budget it offers is only 10x that, for people who "can't avoid risk, but still want to make smart choices". This was a reasonable way of looking at things earlier in the pandemic, but at this stage I think much higher budgets are generally appropriate for fully vaccinated people: the risk to the individual is generally extremely low and the risk they impose on others is relatively low. Altruistically, since most of society is operating on a much higher risk budget keeping to low one is a lot of sacrifice for minimal benefit.
For a vaccinated and boosted person I think a better approach is to use no budget most of the time, and then use a budget of perhaps 10,000 microcovids/week (~50% annual risk) when demand on the medical system is likely to be especially high.
Even just the first two have a very large impact. For example, it currently gives a random person in my county as having a 0.78% chance of having covid (780 cases per 100k). Let's walk through the basic method with current data.
For the most recent seven days we've averaged 379 cases/day. Population is 1.6M, so that's 24/100k. The positive test rate is 2.2%. They have some math I don't entirely follow the reasoning for, with:
prevalence_ratio = 1250 / (day_i + 25) * positive_test_rate ** 0.5 + 2
true_infections =  prevalence_ratio * reported_infections
Where
day_i is number of days since 2020-02-12 (738 as of
today). They cite
Estimating
True Infections Revisited: A Simple Nowcasting Model to Estimate
Prevalent Cases in the US, but I'm just going to use it as is:
prevalence_ratio = 1250 / (738 + 25) * 2.2% ** 0.5 + 2
prevalence_ratio = 1.6 * 0.15 + 2
prevalence_ratio = 0.24 + 2
prevalence_ratio = 2.24
true_infections = 2.24 * 24/100k
true_infections = 54/100k
Using current data moves the risk down 14x, from 780/100k to 54/100k.
Now let's apply the extrapolation that they do when cases are
rising. The seven days before that averaged 460 cases/day, or
29/100k. Test positivity was 4%, so prevalence_ratio is 2.33, and
estimated true_infections is 68/100k. Dividing 54 by 68
we get 79%, so the extrapolated current number is 79% * 54/100k.
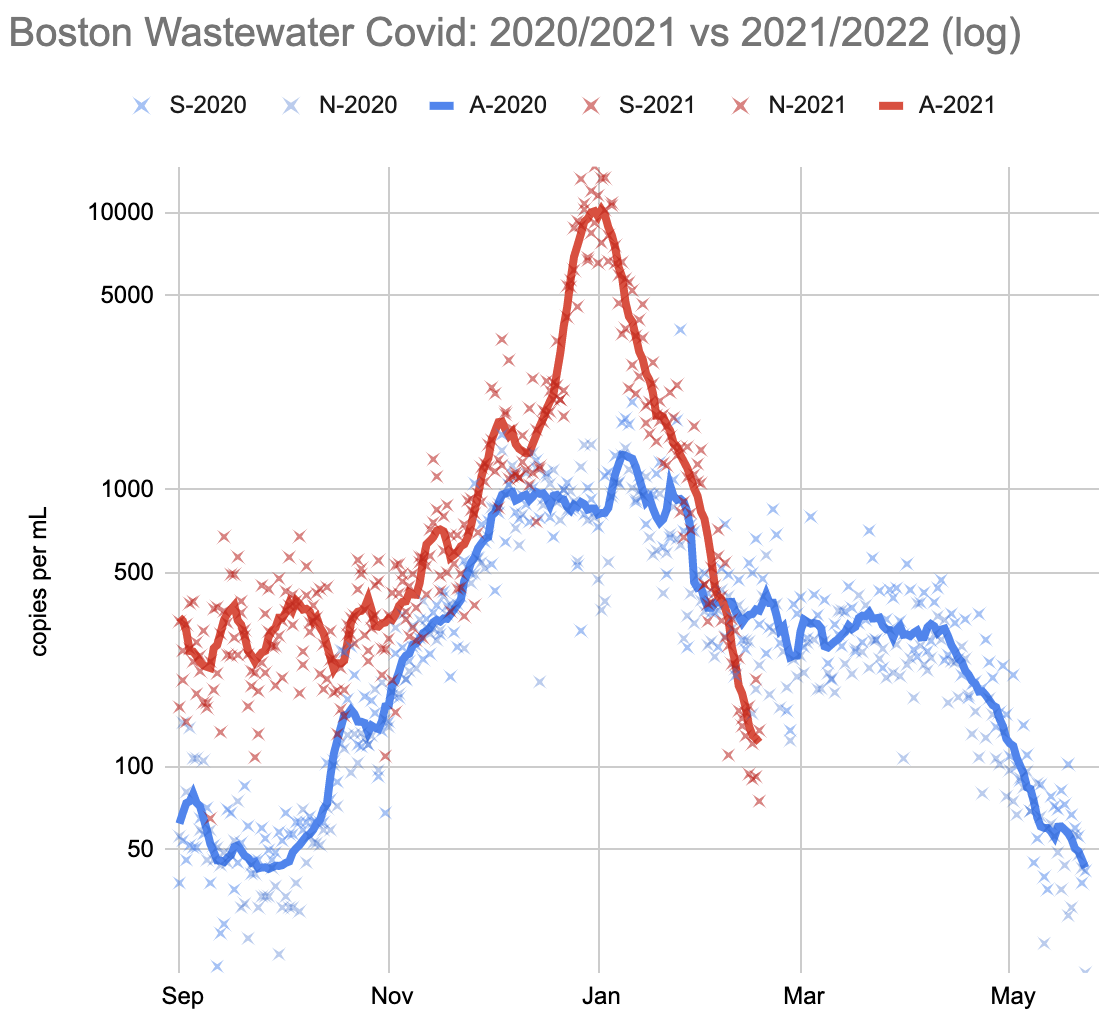
Consistent downward extrapolation brings it down another 20%, from 54/100k to 43/100k, for a total of 18x. This extrapolation is warranted here, if you look at the (more current) wastewater numbers.
Comment via: facebook
13 comments
Comments sorted by top scores.
comment by Sameerishere · 2022-02-26T20:38:43.152Z · LW(p) · GW(p)
FYI, prevalence updater now seems to be fixed https://github.com/microCOVID/microCOVID/issues/1358
comment by Sameerishere · 2022-02-22T14:13:22.491Z · LW(p) · GW(p)
Thanks for this!
What had you conclude that microCOVID fails to model the impact of vaccinations? I haven't looked closely at their methodology, but just toggling "Their vaccine" from "Yes" to "No" to "I don't know" does change the risk estimate.
Replies from: jkaufman↑ comment by jefftk (jkaufman) · 2022-02-23T03:31:36.371Z · LW(p) · GW(p)
My reading of the site was that they modeled other people's vaccinations like other people's masks: reducing the chance that you get infected from them conditional on them being infected. I still can't tell whether this is what they are modeling, though.
comment by Dawn Drescher (Telofy) · 2022-02-20T23:53:55.799Z · LW(p) · GW(p)
Thanks for the analysis!
Some of these points seem like attempts at being conservative (I imagine most people will prefer to err in the direction of caution when advising others), while other points just look like the project is not well-maintained anymore.
Do you have a feeling for what a good adjustment factor is that one could apply to the result to compensate the first kind of problem, so everything related to others’ vaccination status? (I’ll just enter the local data manually while the importer is broken.)
(I’m hesitant to go with a budget that would imply a 50% yearly risk for me, but if I’m going to stick with my approximate 3% p.a. risk budget, I want to do so using a median estimate, not a conservative one. Update: Did some math. I think I’m comfortable with a 20% p.a. budget now. But I don’t really do budgets because I weigh for every event what risk it is worth or whether there’s an equally good but safer alternative.)
Replies from: adamzerner↑ comment by Adam Zerner (adamzerner) · 2022-02-21T05:09:46.580Z · LW(p) · GW(p)
Do you have a feeling for what a good adjustment factor is that one could apply to the result to compensate the first kind of problem?
microCOVID uses https://apidocs.covidactnow.org/ for US positive test rates. I removed the "apidocs." part, entered my county, and it gives you a graph showing daily new cases. I think you could take a look at that graph and then try to extrapolate out seven days or so.
For example, I live in Multnomah County, OR. The last day they have is 2/18/22 and the number is 29.7 (new cases per 100k people). On 2/11/22 it was 47.8. The decline is slowing, so maybe we can say a 15k drop over 7 days. So over 10 days, maybe 21k or something. Which would mean we're currently at something like 9k cases/day.
Replies from: Telofy↑ comment by Dawn Drescher (Telofy) · 2022-02-21T10:32:39.088Z · LW(p) · GW(p)
Good. There’s a site for Switzerland like that too. I extrapolated from that in a similar manner. :-)
Replies from: Sameerishere↑ comment by Sameerishere · 2022-02-22T14:19:22.896Z · LW(p) · GW(p)
I'm a little confused by your methodology here - if the last day they have is 2/18, and today is 2/22 (or was 2/21 when you posted it), why are you extrapolating out by 10 days (29.7 - 21 ~ 9k)?
More generally, does the following seem like a valid way to input data manually into microCOVID?
- Take the last reported daily cases/100K from covidactnow.org. Reduce by extrapolating to what you'd expect for today
- Multiply by 7 and input into "Reported cases in past week"
- Enter "100000" into Total Population
- Leave "Percent increase in cases from last week to this week" at 0%, since you can't set it to negative
- Take the latest "percent of tests that come back positive" as-is from the latest number available at covidactnow
- Take the "2+ or J&J" number and enter it into "Percent of population fully vaccinated" (looking at the default number in there before I typed mine in, it looks like that's what microCOVID is using, not % boosted)
Thanks!
Replies from: Telofy↑ comment by Dawn Drescher (Telofy) · 2022-03-05T16:59:54.515Z · LW(p) · GW(p)
Hi! I suppose that question mostly goes to Adam? The importer is fixed, so I’m not doing any of this anymore. What I did was to extrapolate to the current, incomplete week n using the slope from week n-2 to n-1. Then I set the percent increase to 0 because the week is actually the current week already.
But the differences from week to week will, in most cases, be minor, so I don’t think it’s important to get this exactly right. There are so many other uncertain factors that go into the model that I don’t recommend investing too much time into this one.
Replies from: Sameerishere↑ comment by Sameerishere · 2022-03-05T17:58:19.114Z · LW(p) · GW(p)
Thanks!
comment by Sameerishere · 2022-03-14T20:06:36.757Z · LW(p) · GW(p)
A friend raised concerns that as people are increasingly using at-home tests instead of PCR, the data sources for microCOVID are underreporting risk.
Detailed her concerns further here:
https://www.lesswrong.com/posts/kCrX2mPEdnuTPCK3A/microcovid-risk-levels-inaccurate-due-to-undercounting-in [LW · GW]
Would be curious to hear thoughts from you all who have been thinking about the related issues Jeff raised earlier (albeit with the trend in the opposite direction).
Replies from: jkaufman↑ comment by jefftk (jkaufman) · 2022-03-14T23:45:00.910Z · LW(p) · GW(p)
Not in Boston in particular, because we have good wastewater monitoring, but yes, this ( and just generally people testing less ) would worry me with microcovid numbers elsewhere.
comment by isaacb · 2022-02-26T22:39:35.559Z · LW(p) · GW(p)
Do you have a better option? Personally, I like that it doesn't assume cases are falling - results lag behind data, and data isn't perfect.
I use microcovid because I need to. I would much rather it be slightly overconservative than find myself infected due to underestimating the risk.
comment by Tornus · 2022-02-23T02:15:29.698Z · LW(p) · GW(p)
Thank you for this.
I want to start by echoing your gratitude to the microCOVID team: they've done amazing work and the tool they've produced has been incredibly valuable to me and to many others. And I agree with your assessment that microCOVID is much less useful than it has been in the past. I'll add to your points:
- Their calculation of prevalence strikes me as far too clever. I understand what they're trying to do, and it makes sense in theory. But Covid surveillance is something I know a lot about, and I believe they're over-driving the data. Test positivity seems like a really valuable signal, until you understand what goes into it—once you do, it seems much less useful. In my own modeling, I use (current case rate) * (under-reporting constant), with a manually determined adjustment for trend. But I'd rather use the current level than the fancy extrapolated level used by microCOVID.
- They're using significantly inaccurate constants in some places that matter. For example: their household Secondary Attack Rate (SAR) for a fully boosted person is 15%, but a better value would be 25% paper 1, paper 2.
I don't know the answer here. We need a tool like microCOVID, and I understand how hard it is to maintain a volunteer-based tool.