Why You Might Want a New Way to Visualize Biases
post by dtm · 2020-07-27T17:30:45.065Z · LW · GW · 2 commentsContents
2 comments
A few days ago I made a post called A New Way to Visualize Biases [LW · GW], and the community seems to have been generally skeptical as to the value of the diagram. I don't think the original post made clear enough the types of use cases I was primarily interested in, and I know I haven't perfected the model yet, but the primary reason I posted was to get some clarity and ideas from LW on how I might do that, which some commenters offered.
But I do want to defend the potential value of a framework like this. If I had just been trying to understand biases in isolation, I probably never would have seen a reason to develop a diagram like this either, but I came to it from a different angle.
Most people are familiar with the idea that our thoughts and reasoning play a large role in our emotions and behaviors. Cognitive behavioral therapy (CBT), the most empirically effective therapeutic treatment for depression and other disorders to date, is based on the idea that cognition mediates our emotions, and biased and distorted thoughts are very often responsible for maladaptive emotions and mood disorders.
David Burns, author of Feeling Good says "Our research reveals the unexpected: depression is not an emotional disorder at all! The sudden change in the way you feel is of no more causal relevance than a runny nose is when you have a cold. Every bad feeling you have is the result of your distorted negative thinking." You can dispute whether this analysis oversimplifies emotion or depression, but it is clear that many negative and harmful emotions are the result of cognitive biases.
One of the most effective techniques for eliminating persistently negative emotional cycles is called cognitive restructuring. If you wanted to make use of cognitive restructuring, you might keep a log of your emotions and the thoughts and circumstances which may have preceded or triggered them, and mapping out the chain to identify which psychological algorithms are systematically leading to these emotional spirals. Then you could use the Socratic method to attempt to spot and remove the biased thoughts which triggered your emotions.
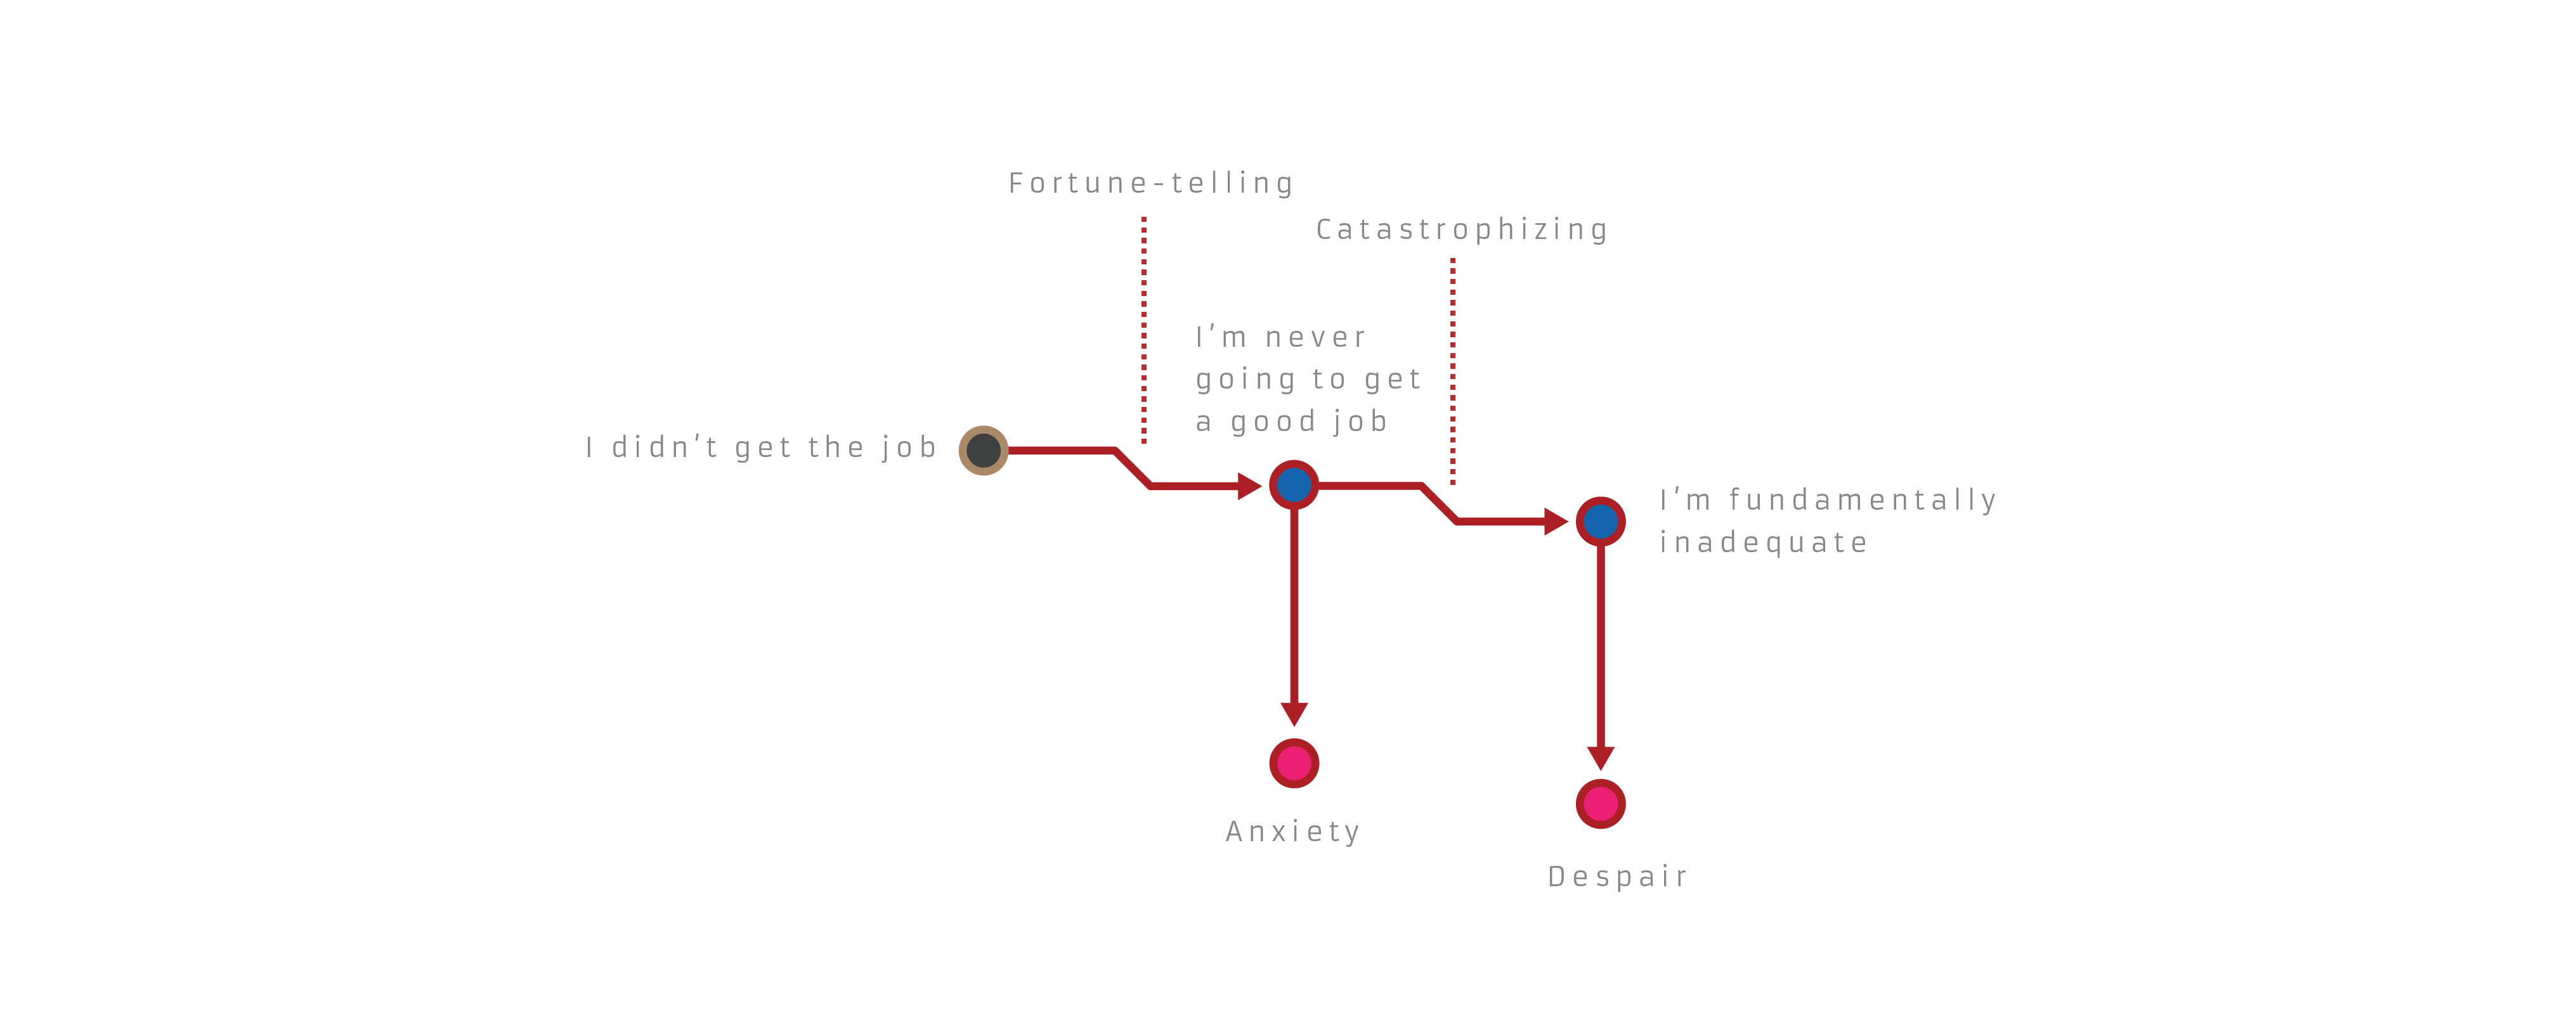
Here is a simple example of a chain of automatic psychological algorithms resulting in maladaptive emotions:

So if you read the original post and generally understand how I'm trying to use the diagrams, you will see that I have added nodes for emotion here. So in this case the external event of receiving a rejection letter triggered the biased cognition "I'm never going to get a good job," an example of the fortune-telling distortion, which yielded a negative emotion of anxiety, as well as triggering another distorted thought, "I'm fundamentally inadequate," an example of catastrophizing, which yielded a compounding emotion of despair (yes, clearly possible to convey with words, but not as easy to grasp intuitively).
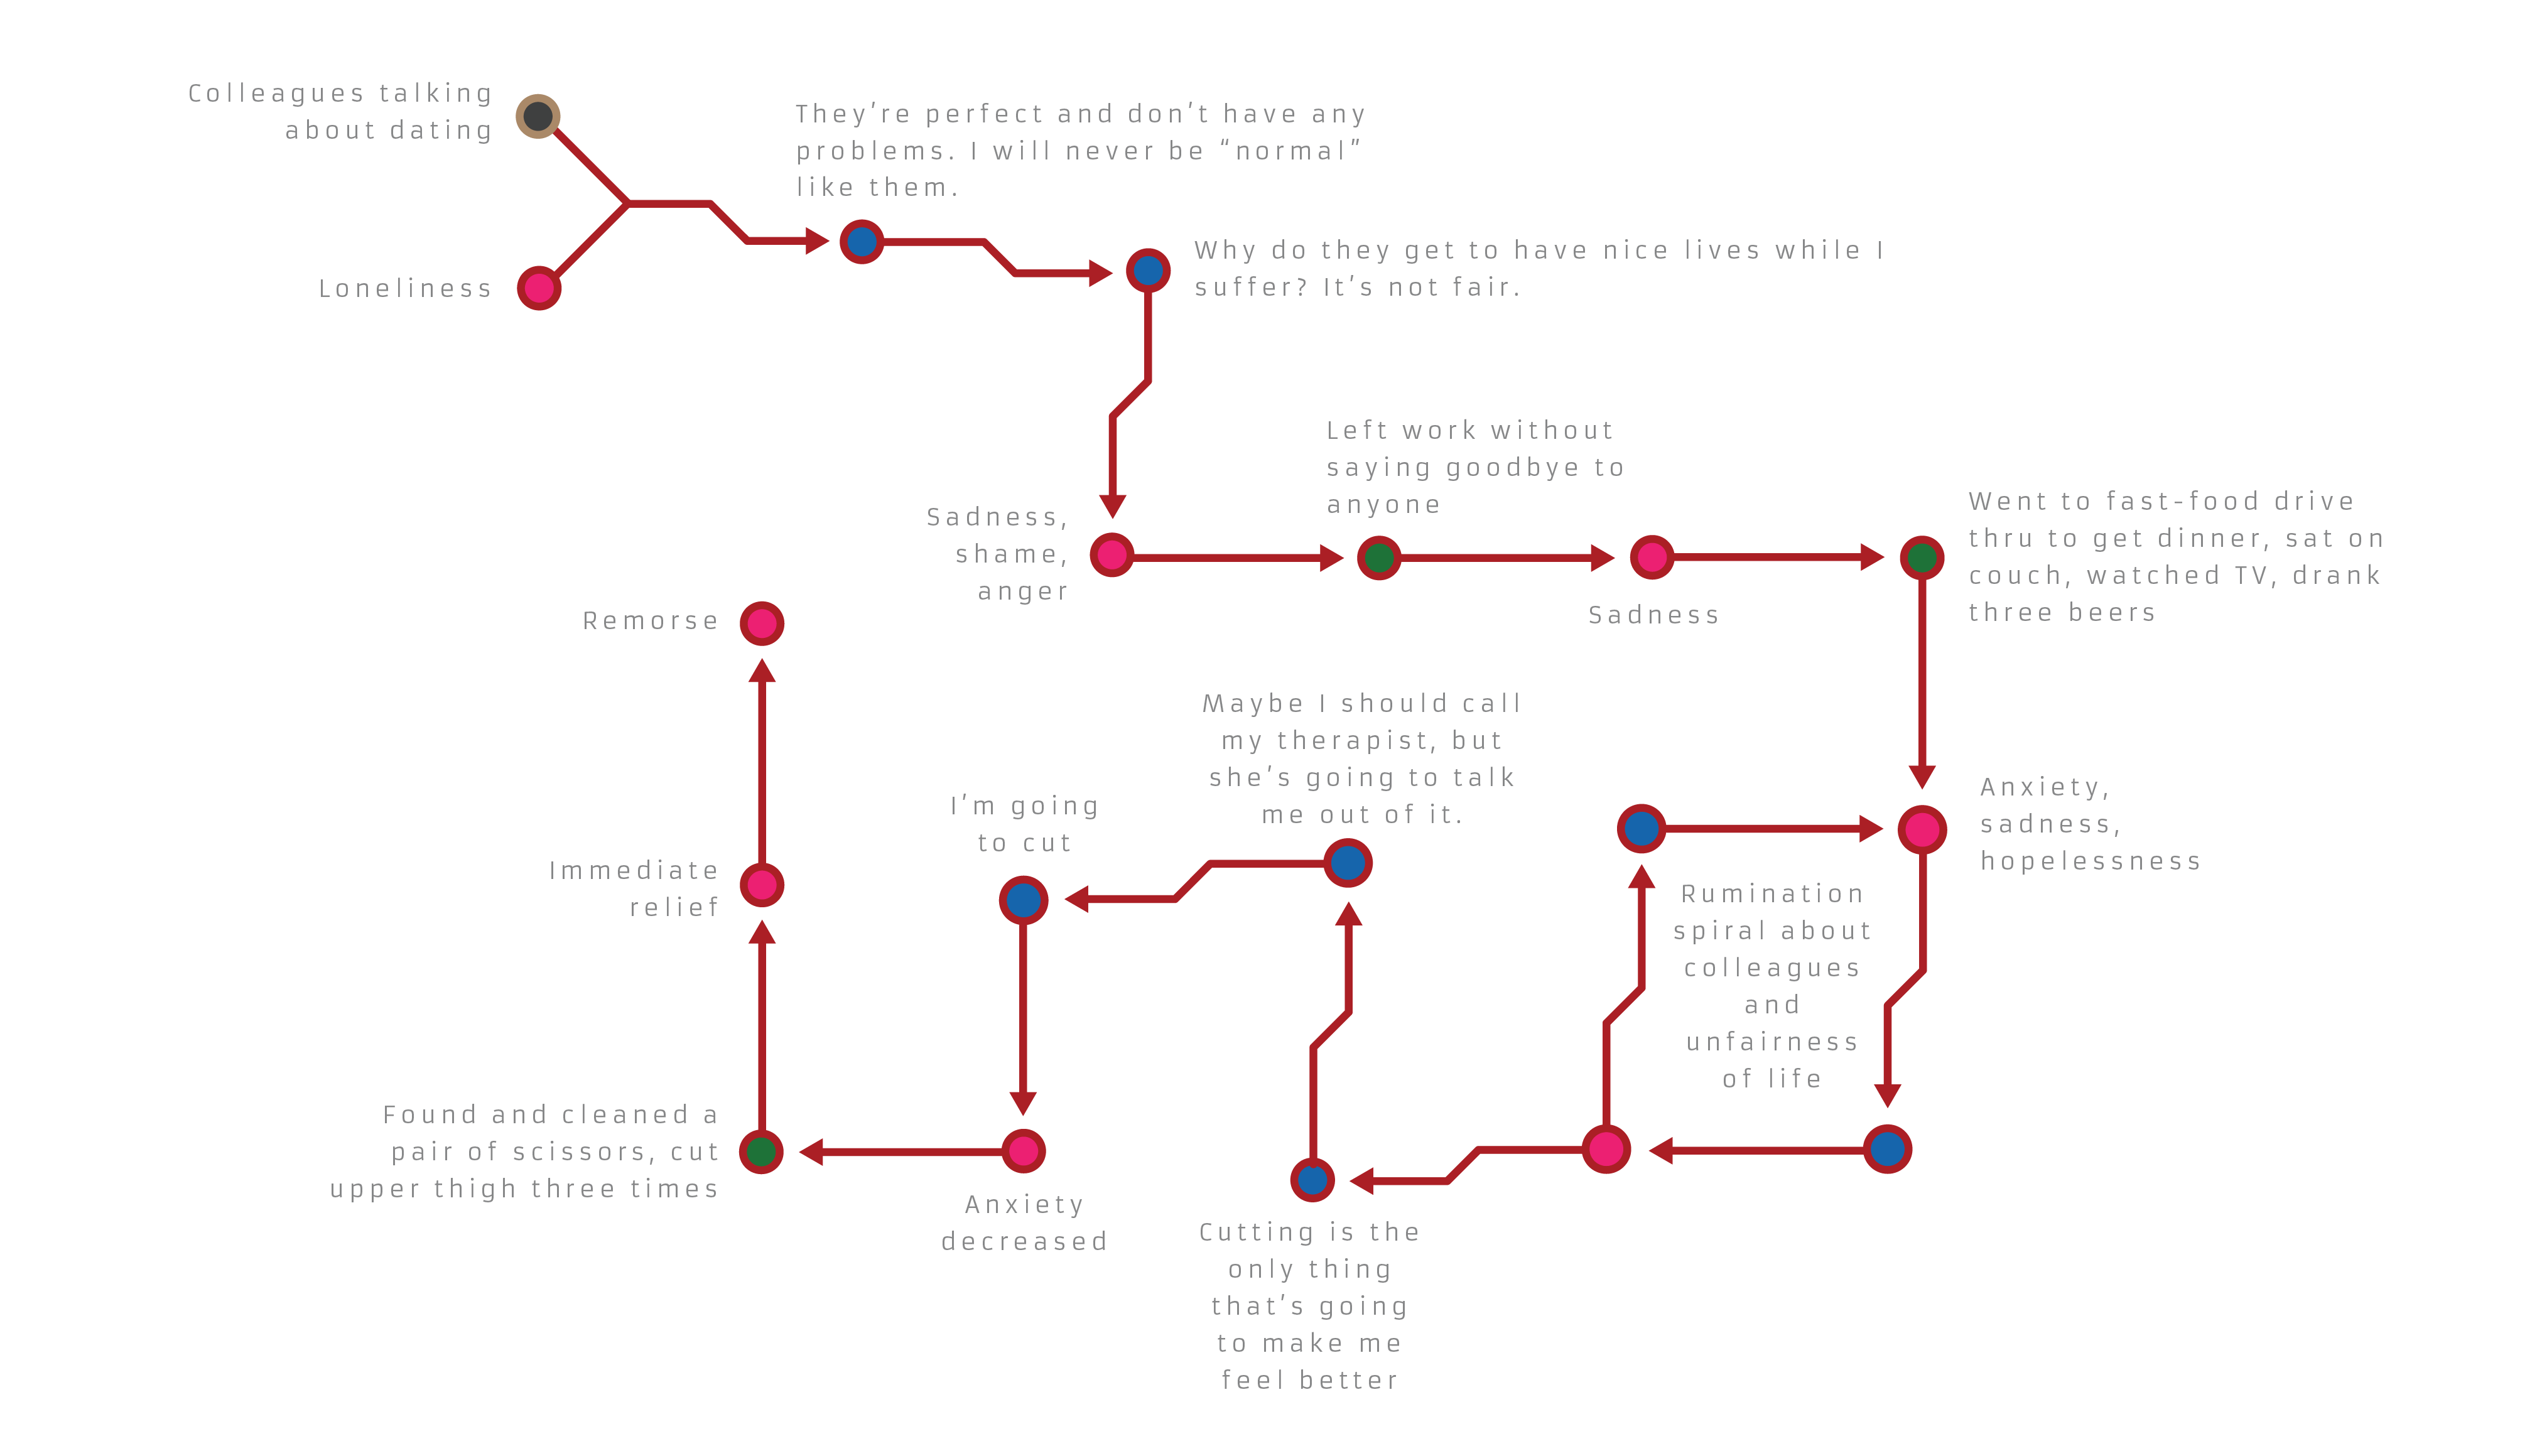
Dialectical behavior therapy (DBT), another therapeutic practice which originally emerged from CBT, often focuses more on treating harmful behaviors such as addiction and self-harm. One of the core exercises is known as behavioral chain analysis, in which a patient goes through a similar investigation to identify what led to the target behavior and which leverage points exist for preventing it in the future. Again, we are typically looking at external events, thoughts, emotions, and now behaviors (shown with a green node).
Here is a complex (and pretty heavy) example taken directly from a patient's experience documented in Shireen Rizvi's Chain Analysis in Dialectical Behavior Therapy and converted into diagram form.

Chain analysis is a part of this practice because the act of logging, listing, and ideally mapping the chain can play a major role in identifying the leverage points for changing the behavior. And often, the most effective leverage points end up being the correction of the systematic cognitive biases which led to the harmful emotions or behaviors. So if, after engaging in a maladaptive behavior, you could draw up this diagram and identify that a few key distorted thoughts or beliefs led you down this harmful path, you could begin working on removing those biases.
At first glance, it may seem a bit out of scope here, but I see LW as a group committed to self-optimization in many forms, including emotional and behavioral. I reference treatments within psychotherapy, but I want to make clear that the insights gained from the minds of those with extreme issues and disorders shed light on how the human mind works in general, and can be applied by all of us. I won't go into all of them here, but I have found many more uses for this model which can be useful to relatively healthy people interested in self-improvement, such as understanding motivated biases, modulating desires, and changing habits.
Perhaps I am biting off more than I can chew, but I am not giving up on the idea that a diagram like this could be useful in demonstrating and working through strictly cognitive issues too. If I could find the right ways to refine it, I think this could serve as an incredible self-improvement framework, particularly if it can aid and motivate people in removing biases who might not have thought or cared about this before. But I would like to make it as accurate, robust, and useful as I can, and I think this community could contribute to this goal.
2 comments
Comments sorted by top scores.
comment by gjm · 2020-07-27T21:47:06.351Z · LW(p) · GW(p)
I think there's a terminological issue. What you have here is a new graphical notation for (certain kinds of statements about / structures involving) biases, not a way to visualize them. To me, at least, visualizing something means displaying the thing in a way that lets you see that thing itself more clearly; but here, the point isn't to see the biases more clearly -- what you're trying to clarify is a larger structure in which the biases are largely-unanalysed elements.
The criticism you got was mostly saying "this so-called way of visualizing biases doesn't actually show you anything about the biases" -- which is correct but, if I'm understanding you right, largely misses the point because the goal was never to provide a tool for understanding biases better; what you want to understand is bad habits, case histories, and the like. Biases are components of those things; you want a notation that includes a way of representing biases; but this isn't a visualization of biases any more than the usual notation for electrical circuits is a visualization of (say) resistors.
Replies from: dtm↑ comment by dtm · 2020-07-27T23:04:09.602Z · LW(p) · GW(p)
Fair enough! I think the circuit analogy is fitting; the primary analysis is at a system-level scale rather than an individual unit scale. That said, my goal would be to turn it into a tool for better understanding and changing biases themselves (without losing the higher-level functionality). Some people have offered some ideas on how that might be done, and that’s exactly what I’m hoping to get out of sharing here.