Seasonal Patterns in BIDA's Attendance
post by jefftk (jkaufman) · 2025-02-02T02:40:03.768Z · LW · GW · 0 commentsContents
No comments
We've been keeping attendance statistics for BIDA since 2011, and looking at the online chart I noticed some patterns in the moving average that looked seasonal:
How seasonal is it?
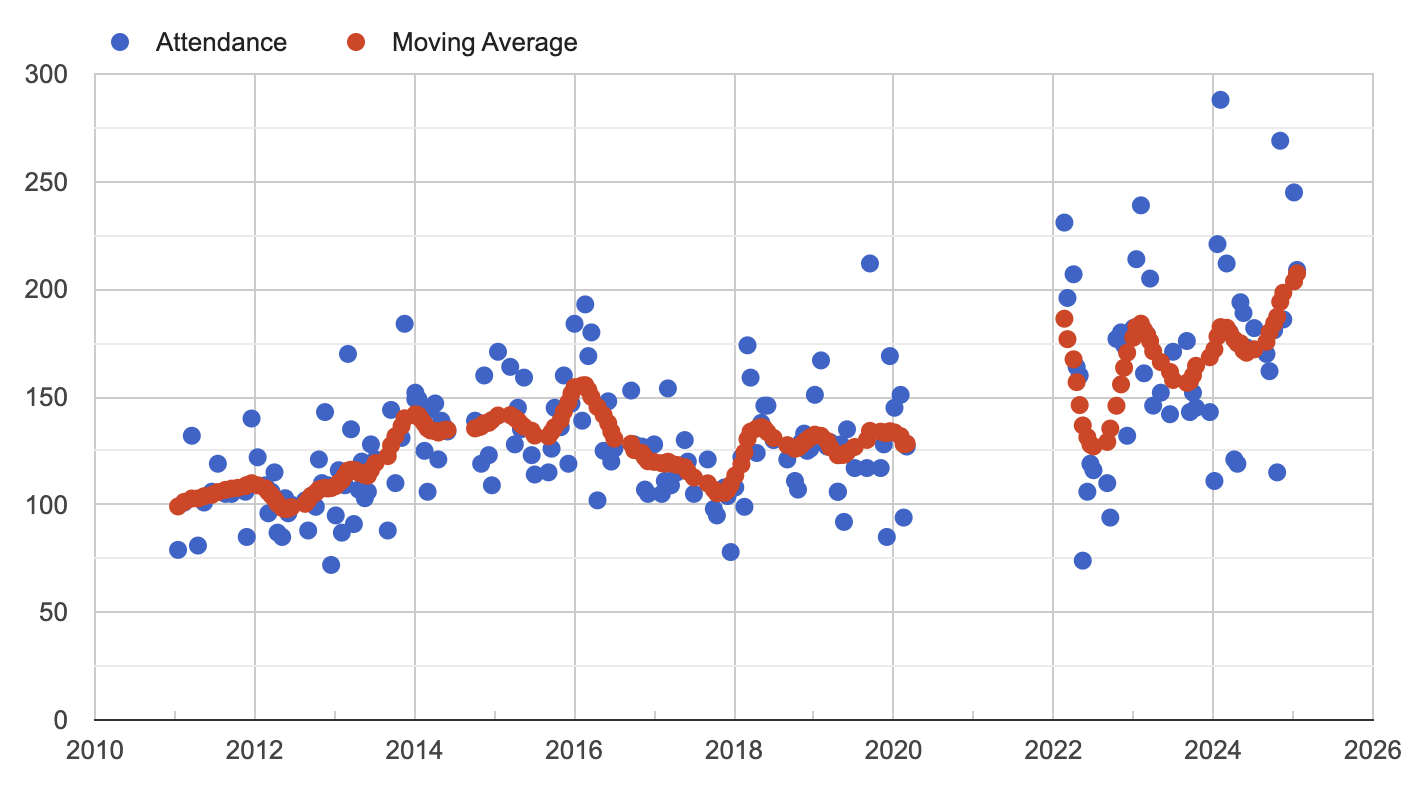
First, here are the raw attendance values:
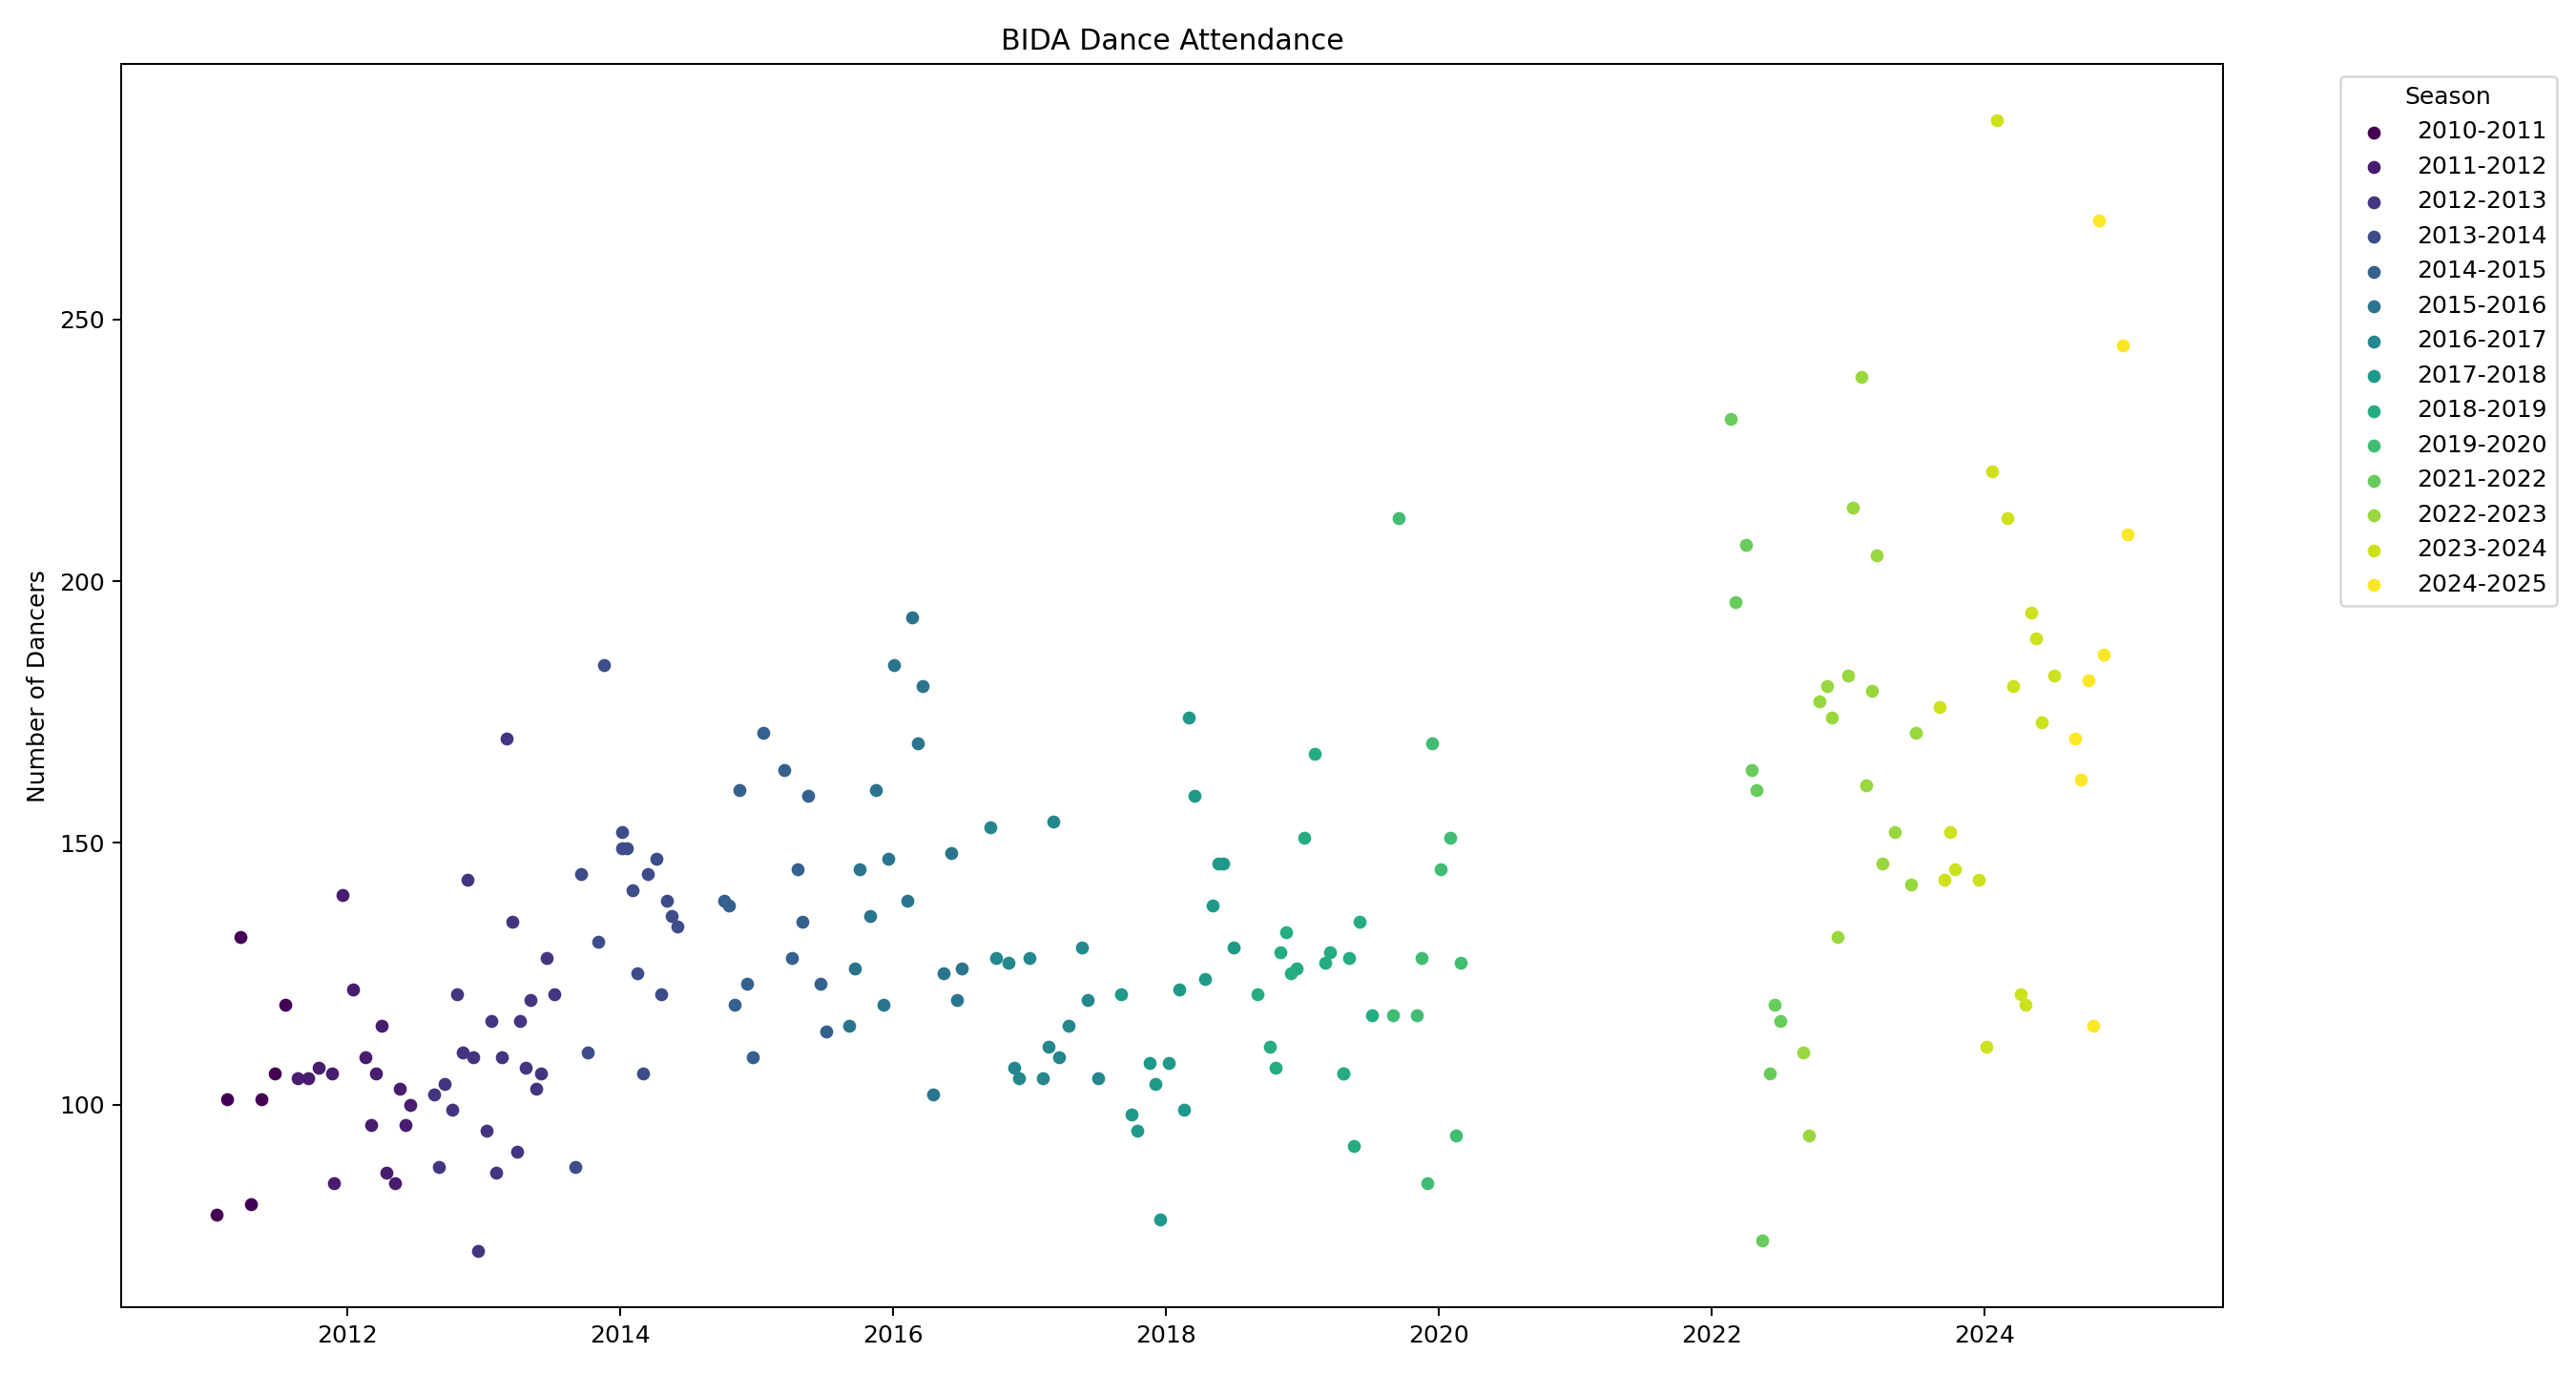
This excludes special events (family dances, double dances, bonus dances, Spark in the Dark) and our new 4th Sunday afternoon series. To make it a bit clearer, let's add a moving average:
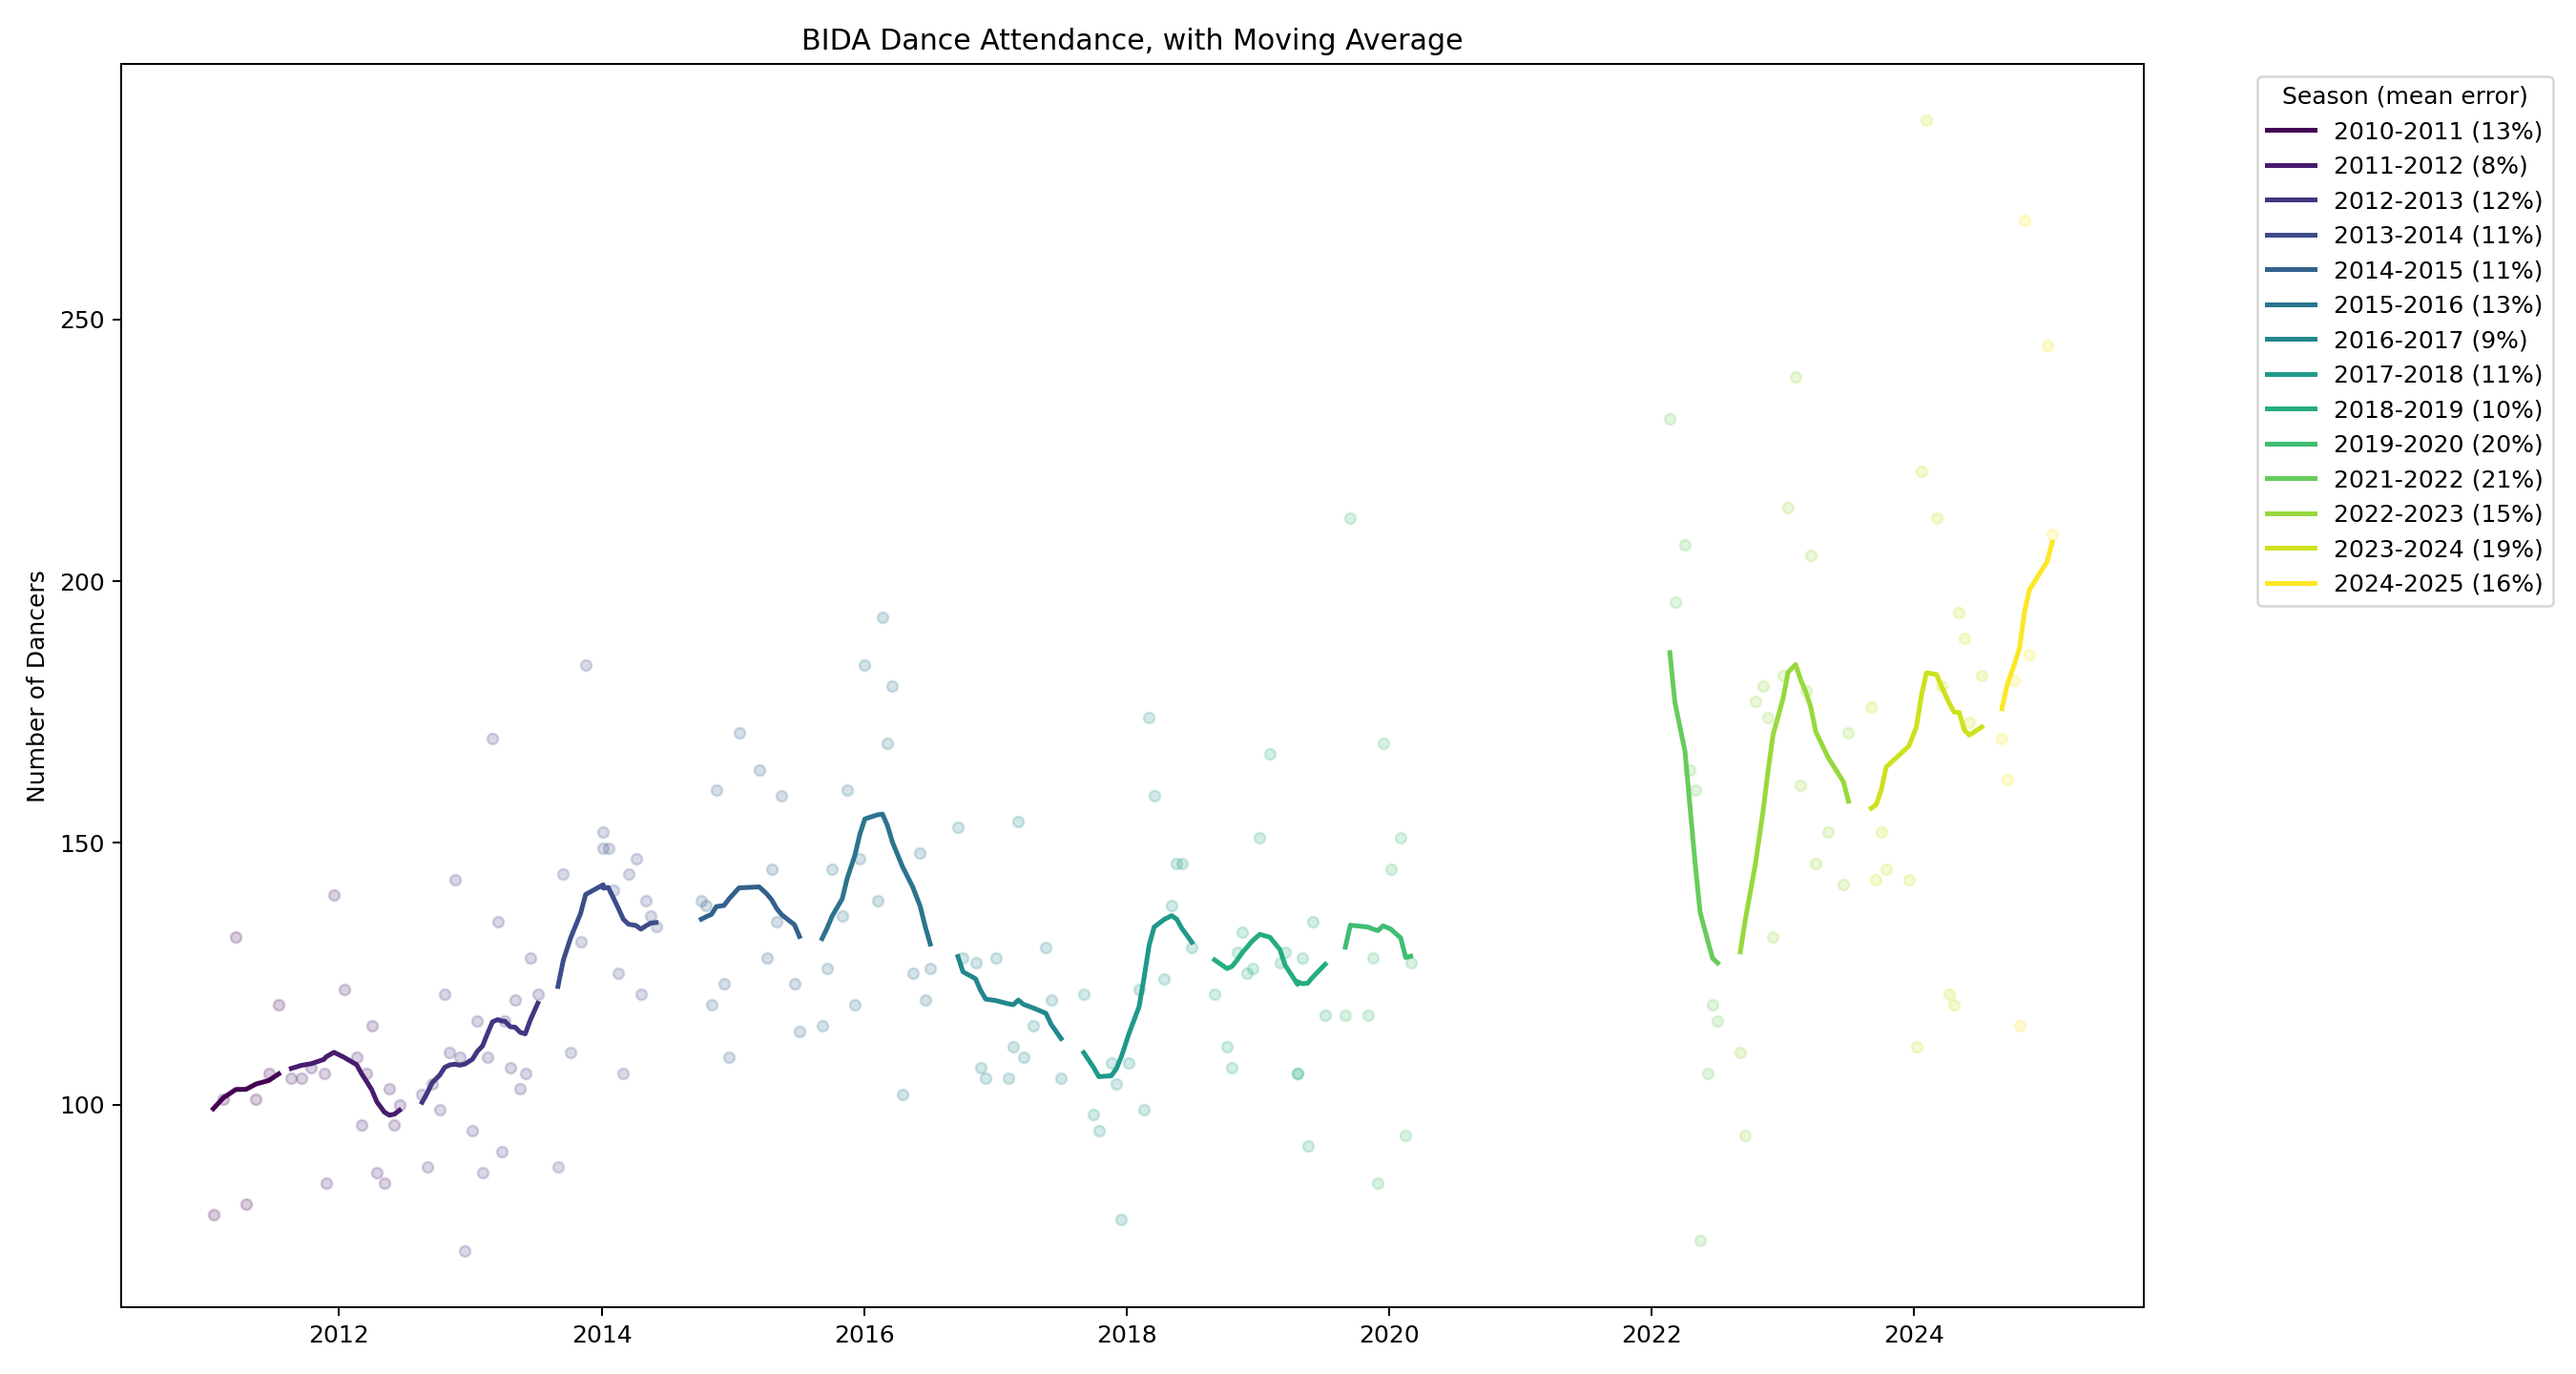
A seven dance sliding window, where the dances are weighted 1,2,3,4,3,2,1. This is the same weighting as on the website.
Attendance grew to a peak at the beginning of 2016, fell to a trough at the beginning of 2018 (prompting me to write a worried blog post), recovered in 2018 and stayed ~level until the pandemic hit, and then has really taken off since resuming.
I still see the seasonal pattern that prompted me to look into this, but I think it would be clearer if I lined up the seasons:
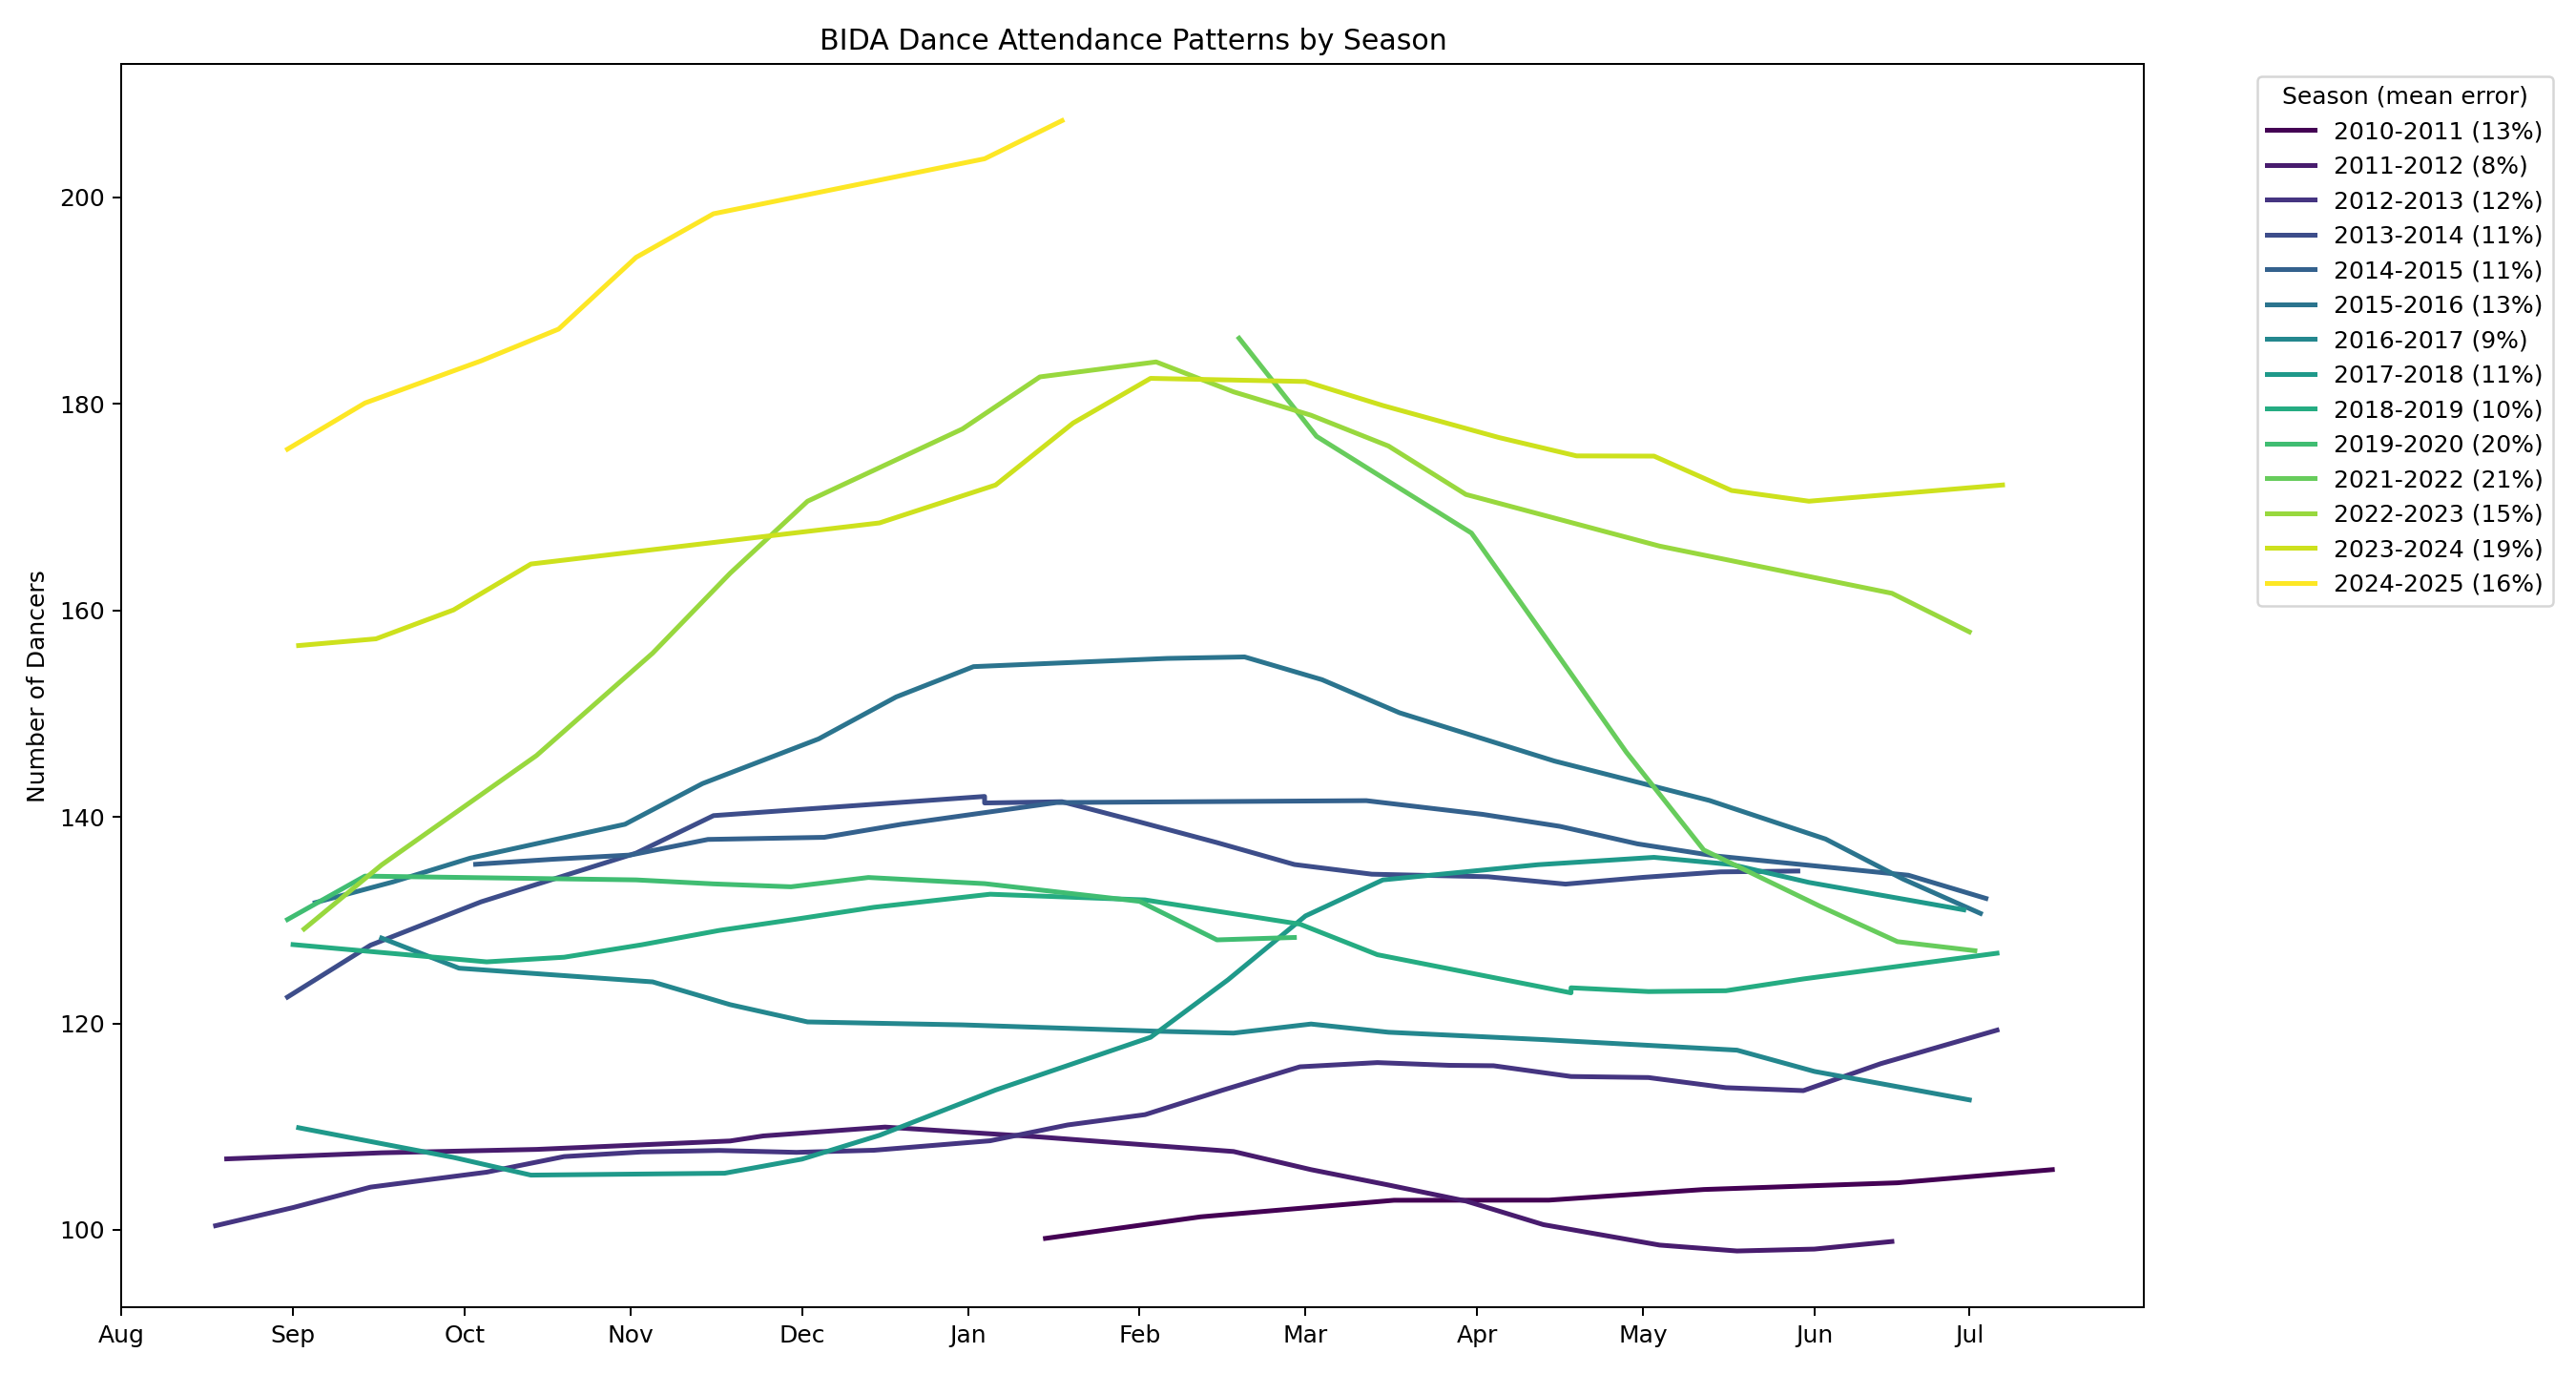
It does look like attendance tends to be higher in the winter, and probably also like the pattern is becoming stronger? Some guesses at why:
There are more options for things to do in Boston in warmer weather. When it's nice outside an indoor dance is relatively less attractive. This is true both day-of (if it's nice outside you might go hang out in a park or do a tiring activity during the day) and with advance planning (weddings, festivals, trips, etc are less likely to be planned for winter because of the typical weather). From the other direction, the warm social atmosphere of the dance might be something people are especially looking for in the coldest and darkest part of the year.
BIDA is increasingly attracting students, who are less likely to be around in summer. The founding cohort had recently graduated college, and initially it seemed like the average age was going up by about one year per year. More recently, though, it seems like there are a lot more younger dancers. Though as I get older I have trouble telling college students from recent graduates, and it's possible there aren't actually that many students.
The hall is at its most pleasant when we can bring in lots of cold dry air, and this is a larger effect the more dancers we have. This is why we don't dance in the summer, but the dances at the beginning and end of our season can be pretty warm and humid, which also makes the floor stickier.
On the other hand, judging from our latest survey this is a pretty covid-cautious group, and it's a bit unexpected that the seasonality of dancing post-resumption would match the seasonality of covid. To the extent people are trying to avoid respiratory illness I'd guess they'd try to shift dancing towards times of the year with lower infection risk? But to the extent people are doing this it's apparently not large enough to overcome the factors pushing the other way.
I'm curious what seasonality looks like at other dances, if anyone has data they can share!
0 comments
Comments sorted by top scores.