D&D.Sci Hypersphere Analysis Part 1: Datafields & Preliminary Analysis
post by aphyer · 2024-01-13T20:16:39.480Z · LW · GW · 1 commentsContents
  Raw Data and Columns
  Reformatting for use
  Correlation Matrix
  An Inadequate First Guess
None
1 comment
This is a post (hopefully eventually a short series of posts) detailing my analysis of the recently released D&D.Sci scenario [LW · GW] by abstractapplic. I've decided to go through documenting what I do - if you intend to play the scenario yourself without help, you should do that before reading this. If you want to use this information in your solutions, go ahead.
Raw Data and Columns
I start by grabbing the raw data and saving it as a csv, then import it into Python and Excel to play with it. I'm not trying to do any particular analysis at this point, just trying to get familiar with the data and see if anything jumps out.
We'll go through the columns one by one, and make some charts in Excel for visualization[1].
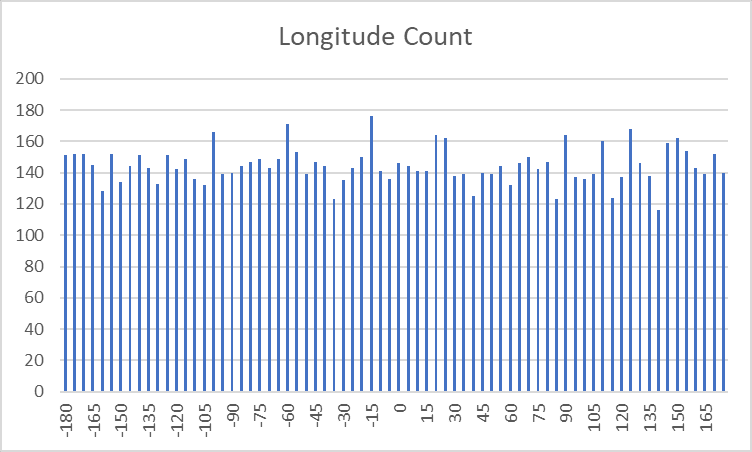
Longitude is relatively evenly-distributed from -180 to +180.
Latitude can vary from -90 to +90 but is bimodal, usually taking on values around 45 - we rarely land near the equator or near the poles.
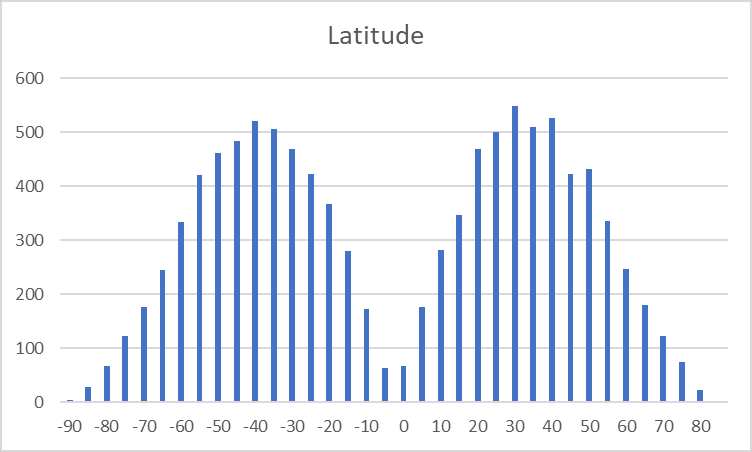
And Shortitude and Deltitude look the same as Latitude:
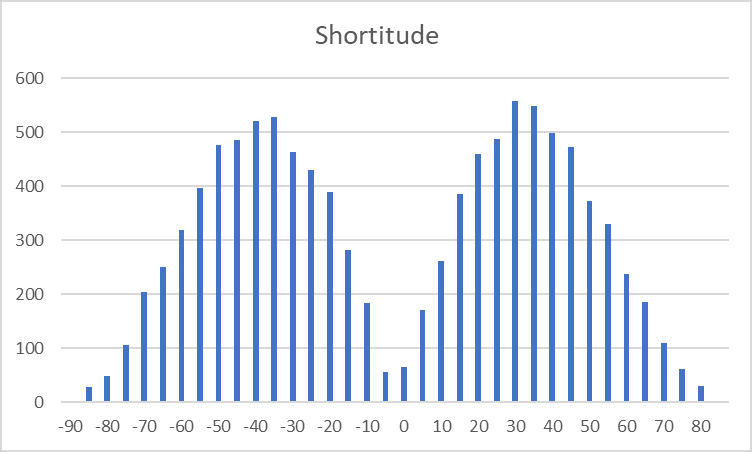
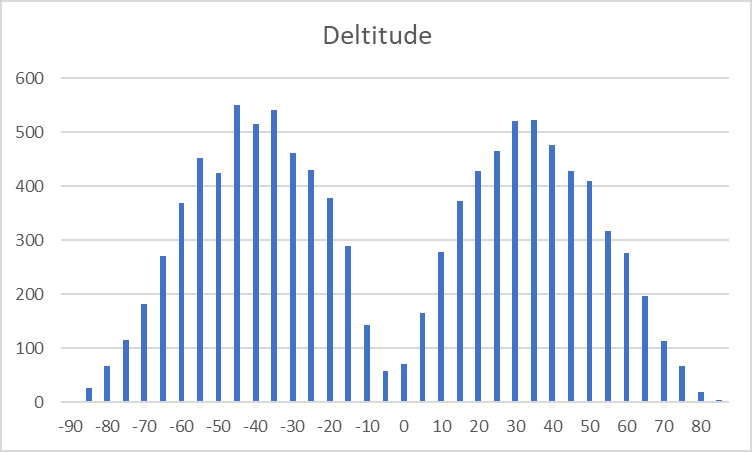
This might be what you naturally expect from landing at a random point on a 4D sphere - certainly values near +-90 being less likely happens naturally, since those are 'the poles' and take up less area. I don't have a good enough intuition for this to know if values near 0 are also naturally rare once you add more dimensions, or if we're avoiding the 'equator' for some reason.
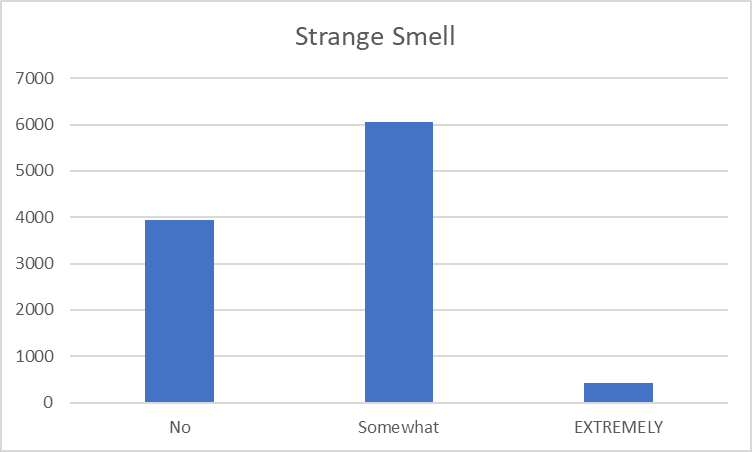
Strange Smell is often Somewhat present, but only rarely EXTREMELY present:
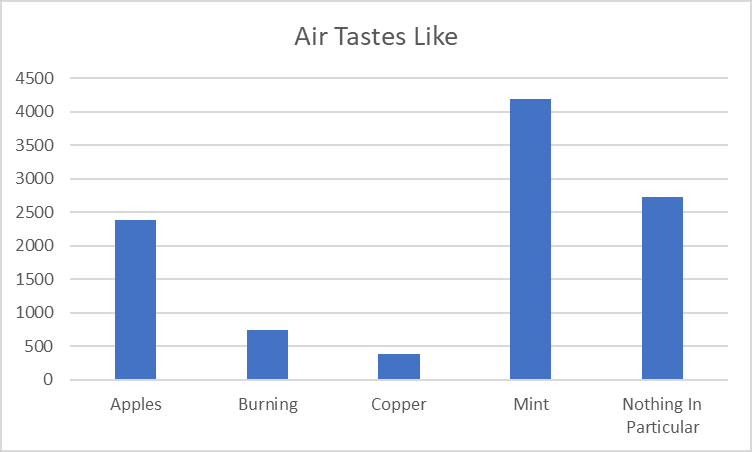
Air Tastes Like has a few different values, some common and some rare:
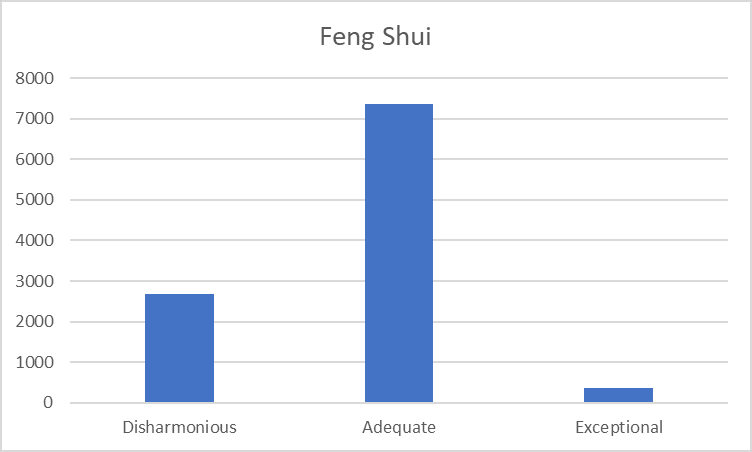
Feng Shui is generally Adequate, sometime bad, and very rarely good:
Weird Sounds has five possible values, of which we see up to three at a time:
- Eerie Silence
- Impossible Humming
- Otherworldly Skittering
- Unearthly Squelching
- Unnatural Buzzing
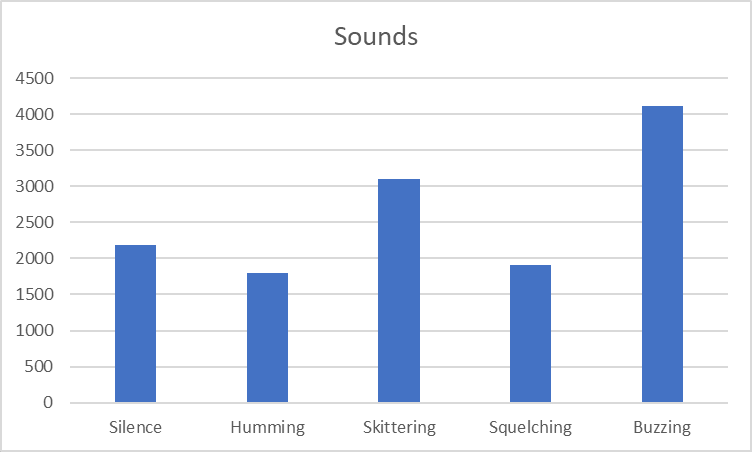
Eerie Silence appears exactly when no other sounds appear.
Skittering and Buzzing never happen together (though they are the most common sounds separately).
Local Value of Pi is distributed in what looks like a very neat distribution:
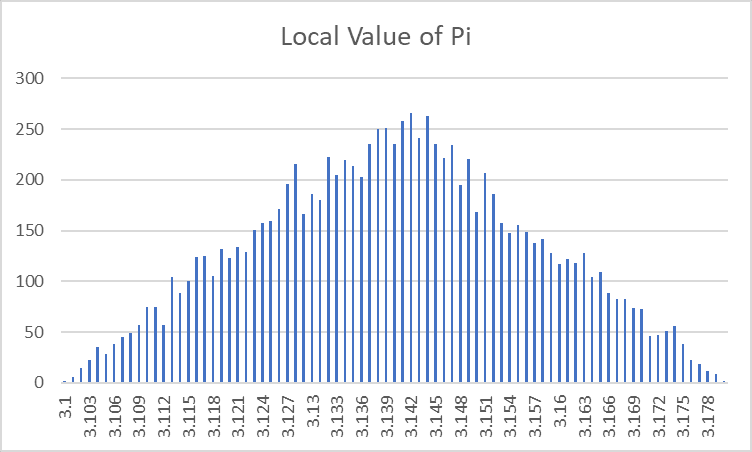
3.141 + (1d41-1d41)/1000 isn't literally accurate, since we see more decimal figures than that, but it's probably a reasonable way of thinking about it?
Murphy's Constant has a very weird distribution:
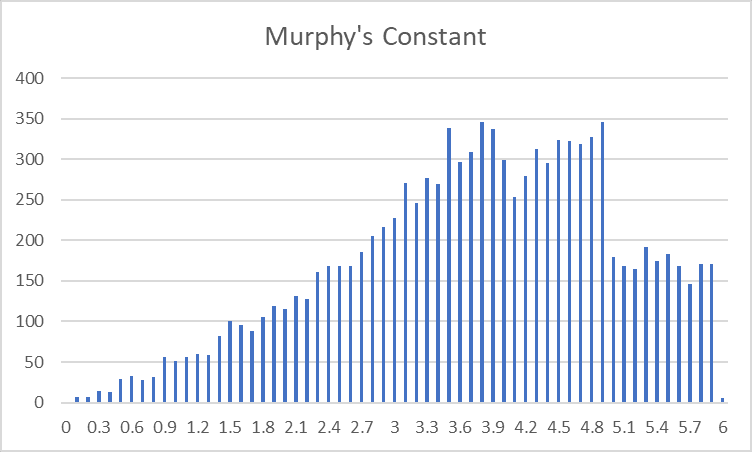
I'm going to guess something like this:
- MC is distributed with the same type of distribution we saw Pi have, with probability increasing linearly from 0 to ~5.5 and then decreasing from ~5.5 to ~11.
- However, our Glorious Empire never chooses any site with MC>6.
- Additionally, we have some restrictions or conditions that cut in at MC=4 and MC=5, making the perceived frequency fall off at those points.
Performance is not looking great:
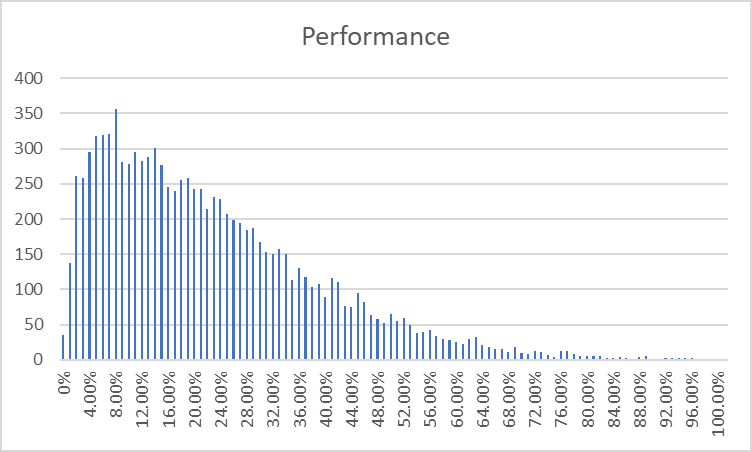
Across 10k+ sites, there have been 2 where performance was >=100%.
We do admittedly have 110k precleared sites to choose from. This suggests that there are going to be ~20 sites in the full possible data that will perform acceptably - this in turn suggests that there's not going to be much leeway in our task here. If we can't almost-perfectly identify all factors that affect performance, we're not going to realistically be able to find 12 100%+ sites.
Reformatting for use
I tweaked a few of the columns to be more user-friendly:
- 'Weird Sounds' becomes 4 separate Boolean cols for different noises (leaving out Silence as what we get when there's no other noises).
- 'Strange Smell?' and 'Feng Shui of Surrounding Area' become numbers from 0 to 2: 0 means no smell/bad feng shui, 1 means some smell/okay feng shui, 2 means extreme smell/good feng shui.
- 'Air Tastes Like' becomes 4 separate Boolean cols (for all the smells except 'Nothing')
and then outputted the result as a new file that I think is more convenient.
Correlation Matrix
One of the simplest useful things we can do with this data is build a correlation matrix.[2]
| Lo | La | Sh | De | Pi | Mu | Smell | Feng | Appl | Burn | Copp | Mint | Hum | Skit | Sque | Buzz | Perf | |
| Lo | 0.01 | -0.01 | 0.00 | 0.00 | 0.00 | 0.00 | -0.01 | -0.01 | -0.01 | 0.02 | 0.00 | 0.00 | 0.00 | -0.01 | 0.00 | 0.07 | |
| La | 0.01 | 0.00 | -0.01 | 0.00 | 0.00 | 0.02 | 0.01 | 0.01 | -0.02 | 0.00 | 0.00 | 0.00 | 0.02 | -0.01 | -0.02 | 0.00 | |
| Sh | -0.01 | 0.00 | 0.01 | -0.01 | 0.00 | -0.01 | -0.01 | 0.00 | -0.01 | -0.01 | 0.01 | -0.02 | 0.01 | -0.01 | -0.01 | 0.01 | |
| De | 0.00 | -0.01 | 0.01 | 0.00 | 0.02 | 0.00 | 0.00 | -0.01 | 0.01 | 0.02 | -0.01 | -0.01 | -0.01 | -0.01 | 0.01 | 0.00 | |
| Pi | 0.00 | 0.00 | -0.01 | 0.00 | -0.01 | 0.00 | -0.01 | -0.02 | 0.01 | 0.00 | 0.00 | 0.00 | 0.01 | 0.00 | -0.01 | 0.11 | |
| Mu | 0.00 | 0.00 | 0.00 | 0.02 | -0.01 | 0.00 | 0.01 | 0.00 | 0.00 | 0.00 | 0.00 | 0.01 | 0.00 | -0.01 | -0.01 | -0.40 | |
| Smell | 0.00 | 0.02 | -0.01 | 0.00 | 0.00 | 0.00 | -0.01 | 0.00 | 0.00 | 0.00 | 0.00 | 0.01 | -0.02 | -0.01 | 0.01 | -0.16 | |
| Feng | -0.01 | 0.01 | -0.01 | 0.00 | -0.01 | 0.01 | -0.01 | 0.01 | -0.02 | -0.01 | 0.01 | -0.01 | 0.01 | 0.00 | -0.01 | 0.10 | |
| Appl | -0.01 | 0.01 | 0.00 | -0.01 | -0.02 | 0.00 | 0.00 | 0.01 | -0.15 | -0.11 | -0.45 | -0.01 | 0.00 | 0.00 | 0.00 | -0.07 | |
| Burn | -0.01 | -0.02 | -0.01 | 0.01 | 0.01 | 0.00 | 0.00 | -0.02 | -0.15 | -0.05 | -0.23 | 0.00 | -0.01 | 0.00 | 0.01 | 0.09 | |
| Copp | 0.02 | 0.00 | -0.01 | 0.02 | 0.00 | 0.00 | 0.00 | -0.01 | -0.11 | -0.05 | -0.16 | 0.02 | 0.01 | 0.00 | 0.00 | 0.04 | |
| Mint | 0.00 | 0.00 | 0.01 | -0.01 | 0.00 | 0.00 | 0.00 | 0.01 | -0.45 | -0.23 | -0.16 | -0.01 | 0.01 | 0.00 | -0.01 | 0.26 | |
| Hum | 0.00 | 0.00 | -0.02 | -0.01 | 0.00 | 0.01 | 0.01 | -0.01 | -0.01 | 0.00 | 0.02 | -0.01 | 0.01 | 0.01 | 0.00 | -0.47 | |
| Skit | 0.00 | 0.02 | 0.01 | -0.01 | 0.01 | 0.00 | -0.02 | 0.01 | 0.00 | -0.01 | 0.01 | 0.01 | 0.01 | 0.00 | -0.53 | 0.06 | |
| Sque | -0.01 | -0.01 | -0.01 | -0.01 | 0.00 | -0.01 | -0.01 | 0.00 | 0.00 | 0.00 | 0.00 | 0.00 | 0.01 | 0.00 | 0.01 | -0.29 | |
| Buzz | 0.00 | -0.02 | -0.01 | 0.01 | -0.01 | -0.01 | 0.01 | -0.01 | 0.00 | 0.01 | 0.00 | -0.01 | 0.00 | -0.53 | 0.01 | -0.17 | |
| Perf | 0.07 | 0.00 | 0.01 | 0.00 | 0.11 | -0.40 | -0.16 | 0.10 | -0.07 | 0.09 | 0.04 | 0.26 | -0.47 | 0.06 | -0.29 | -0.17 |
A few things stand out:
- Most pairs of entries show almost no correlation. This makes theories like 'the Evil Squelching Creatures smell of Copper' or 'Minty smell drives off the Buzzers' quite implausible.
- All air-tastes are negatively correlated (obviously, since they are mutually exclusive).
- Skittering and Buzzing are very negatively correlated, as mentioned above they never happen together. (The Skitterers eat the Buzzers?)
- Performance is correlated with several different variables. A first glance shows:
- Strongly harmed by Murphy's Constant (I guess the constant measures the strength of his Law?)
- Harmed by Buzzing, Squelching and especially Humming.
- The air tasting of Mint is very good, some other tastes are slightly good or bad.
- Higher values of Pi and better Feng Shui are slightly good.
- Stronger smell is slightly bad.
- Weirdly, a higher Longitude seems to be slightly good.
There are two main limitations to this analysis.
- As you have no doubt been told ten million times, correlation does not imply causation.[3] In particular, we see what looks like a slight benefit from Skittering, but I suspect that this is a mirage. Skittering is mutually exclusive with Buzzing, and Buzzing is quite bad. It's plausible that Skitterers are bad but not as bad as Buzzers: that would suggest that we should avoid Skittering as well, and favor Silence.
- Some patterns that could be present in the data would not be reflected in these numbers properly.
- If there's a wonderful oasis at exactly Longitude +83, we would see that as a very slight positive correlation between Longitude and performance.
- If a bit of Feng Shui is good but a lot is bad, we wouldn't track that well.
- If there's an interaction, where Hummers are peaceful near the equator but fierce away from it, we would miss that entirely.
An Inadequate First Guess
If I try using the information here to make my initial guesses:
We have a very large number of possible sites we can try. Even after several requirements:
- Must be Silence.
- Must have no Strange Smell.
- Air must taste of Mint.
- Feng Shui must be at least Adequate.
we still have 2628 entries. My guesswork score based on murphy's constant/pi/a tiny bit of Longitude suggests trying the following sites:
6123
10709
11789
16118
23695
24728
29720
33672
36008
48703
53187
61818
However, when I apply the same logic to the main dataset and look at how generators in sites like this actually scored, they tend to be in the 50-90% range. This is much better than the overall average of 23%, but obviously not actually good enough that I should risk my neck on them.
Presumably digging deeper into Longitude/Latitude/Shortitude/Deltitude will provide more detail. I'll do that at some point, and will try to get a writeup of what I've done.
- ^
(Personal preference note: Excel is a very bad programming language that gets used to do a bad job of solving simple programming tasks by people who really ought to just use Python, but a very good data visualization tool.)
- ^
These are quite useful, and really startlingly easy to make in Excel if you use paste-transpose and mixed absolute referencing.
- ^
(I hate this particular phrasing of it, because the word 'imply' can be used to mean either 'prove' or 'suggest', and while correlation doesn't prove causation it definitely does suggest causation.)
1 comments
Comments sorted by top scores.