Power Outage Chances
post by jefftk (jkaufman) · 2021-05-16T16:40:02.389Z · LW · GW · 6 commentsContents
6 comments
On yesterday's post about generators, Chris asked whether power
outages are worth planning for. That's a good question: very roughly,
you can think of whether it is worth spending
$X to
handle an emergency with probability
P as whether you'd
be willing to spend
$X/P if the emergency were certain.
So: what's
P?
Let's start by looking at national blackout statistics. The Energy Information Administration has power companies report data on many things, including reliability starting in 2013. Taking "SAIDI With MED" (System Average Interruption Duration Index including Major Event Days), weighting by "Number of Customers" (lines of service), and excluding utilities that didn't report these values, I see (sheet):
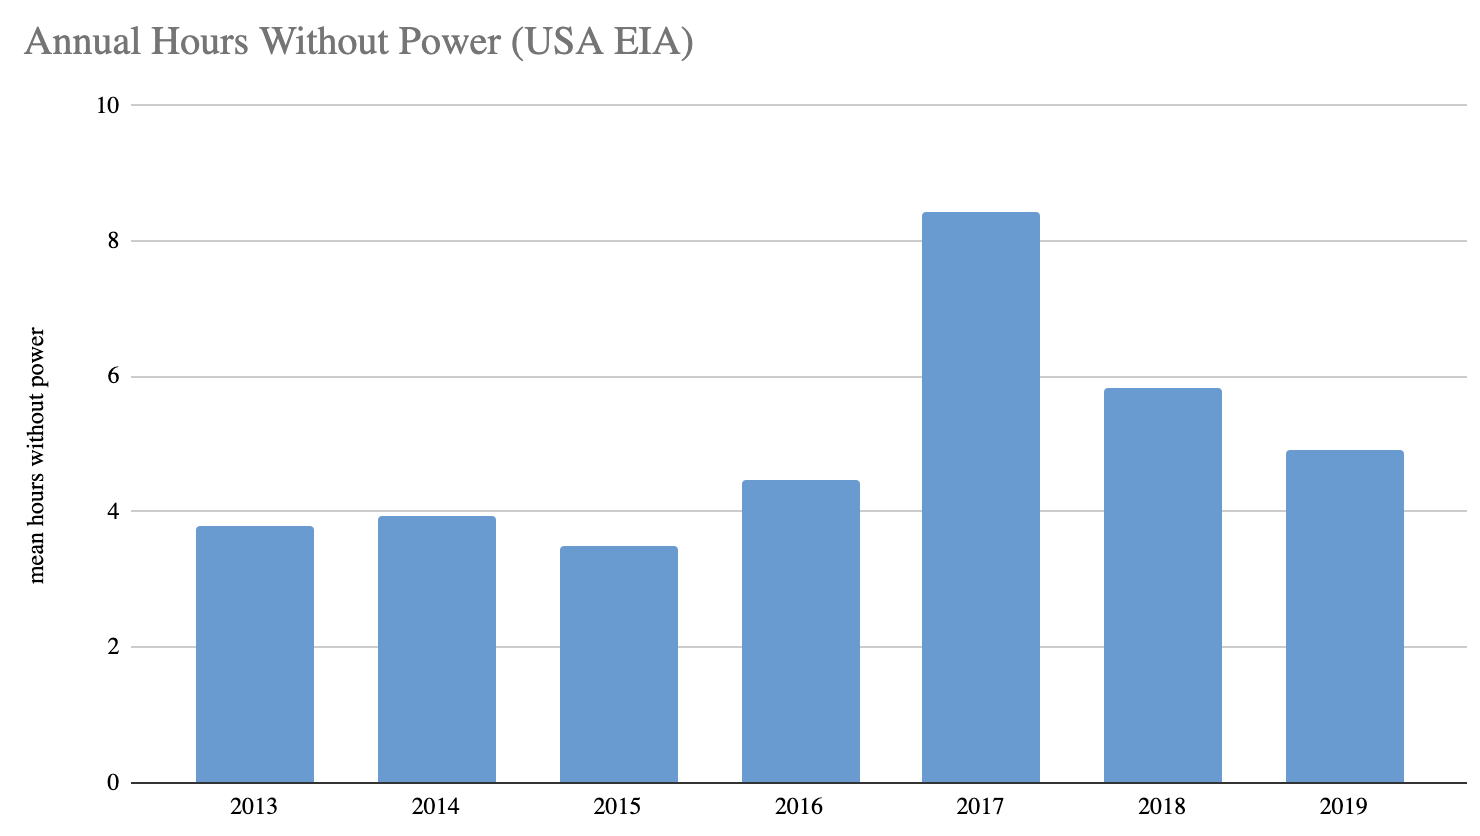
In some ways this is an overestimate of what I care about: it includes both short and local outages that, while annoying, are not much of an issue. I am much more concerned about longer regional outages: if everyone in the Boston Area was suddenly out of power at the same time there wouldn't be anywhere near enough generators / out-of-area hotel rooms / etc to go around.
On the other hand, it's also an underestimate: the worst power outages have been from major storms—Hurricanes (Isabel, Ike, Sandy) and winter storms (CA, TX)—and accidents—Northeast, Southwest. The 2013 - 2019 period looks like it had fewer of these than typical? Additionally, with the grid becoming more interconnected and more computerized the risk of a large regional outage seems likely larger?
How likely would you estimate a >3d outage is for the average person in the US over the next 10y?
Comment via: facebook
6 comments
Comments sorted by top scores.
comment by jimrandomh · 2021-05-16T20:28:27.258Z · LW(p) · GW(p)
In the Bay area, my power-outage planning has been less about heat (it never really gets cold enough to be dangerous), and more about making sure we can still run air filters in case a wildfire and a power outage happen at the same time. For that, I have a couple of 75Wh Li-Ion batteries with inverters. The air filters I have use 45W on a high setting (significantly less on low settings), so this isn't enough to run them on high continuously, but is enough to re-clear the air each time a door is opened and periodically deal with particulates that have leaked in. Lead-acid batteries would provide a lot more Wh/$, but they're also heavier and less compact.
Replies from: jkaufman↑ comment by jefftk (jkaufman) · 2021-05-16T21:16:02.617Z · LW(p) · GW(p)
Makes a lot of sense! And in the bay, a simultaneous wildfire and power outage seems quite plausible.
comment by madonna · 2021-05-31T18:52:04.683Z · LW(p) · GW(p)
I think that the average person in the US is not the right measure for this risk, since (in my experience living in both settings) power outage durations have different distributions in urban and rural areas. Of course, there is gradation between completely rural and completely urban settings and other factors such as whether you're connected to city water and whether you have animals to take care of and whether you have a car will influence personal decisions.
Urban outages for extended periods are typically caused by major storms that can be anticipated seasonally or a week in advance, while rural outages for extended periods often last longer and are caused by smaller storms. Rural outages of short durations are also more frequent than analogous urban outages and can occur independently of storms with no advance warning.
For very rural settings (dirt road, end of the power line) like where I grew up, we could expect a 7+ day outage at least once a decade over the last three decades. My parents bought a generator after experiencing one of those in December after an ice storm. They keep sufficient gas on hand to run the generator for a week and they're able to keep the gas fresh because it's also needed to run the chainsaws, weed-eater, and mower. They have their own well and septic system, so they're not subject to frozen municipal pipes like we observed in Texas this winter. They also have a wood stove for heat and a gas stove for cooking, neither of which relies on electricity. Shorter (6 hr to 2 day) outages are also common in that area (5-10/yr), so the generator is extremely convenient to have on hand.
For very urban settings, the probability of these events is low enough and often comes with enough advance warning that I'd advise evacuation instead. This doesn't replace the need for having a few day's worth of food and fresh water for surprises, but it does take you out of the (predicted) path of hurricanes and the like. I assess the probability of a major outage as so much lower in urban environments that I'm willing to pay the higher cost of vigilance and evacuation in the rare case of an outage instead of getting a generator and figuring out how to keep fresh gas on hand.
comment by pharadae · 2021-05-17T13:48:14.338Z · LW(p) · GW(p)
According to this table (which only includes providers big enough that they are obligated to file a form when an outage occurs), there were 5 outages in Boston from 2000-2014, from which only one was longer than 3 days (by a few hours).
Could be a good starting point to deduce a probability, if you can find the ratio of total providers vs the number of big providers in the table. But it looks like one event in 15 years, in which case I would not bother to secure it, if there are no other reasons (e.g. a medical device needing power or better insurance rates or something).
But: the generator can be used for other things like camping or other out-of-home activity as well, so if you're into that, might be worth buying one after all. Especially since you're splitting the cost with the rest of your housemates.
comment by Zian · 2021-05-16T21:40:35.757Z · LW(p) · GW(p)
You could look for something that can provide a more relevant reference set for your situation. For example, you point out that power outages have different probability distributions based on your location in time and space.
You could also look at others' revealed preferences.
My direct answer your question of estimating an outage for the average person in the US over the next 10 years is that the question is not very useful.
I'll flesh this comment out with a specific example to show what I meant with the first two paragraphs as I have time to do so. By publishing the comment early, I intend to provide some quick value and prevent computer bugs from eating the post.
Goal:
p(>3d outage for a residential location in the next 10 years in downtown San Diego, CA)
Thought Process:
Sources of power outage information:
Potential Primary Sources:
- Angry articles and social media posts about extended power outages in the last 10 years
- Other studies of power outages in San Diego County, the City of San Diego, the ZIP code containing downtown San Diego, or the census tract(s) that comprise downtown San Diego
- Raw counts of power outages in San Diego County, the City of San Diego, the ZIP code containing downtown San Diego, or the census tract(s) that comprise downtown San Diego
- Reports of telecom outages
- Reports of datacenter or server outages
Likely Locations of the Information:
- Local newspapers (searchable via databases)
- Reddit.com (searchable via Reddit and Google)
- Patch.com (Google and site-search)
- Local online-only newspapers (searchable via Google and site-search)
- San Diego Gas & Electric
- California Public Utilities Commission
- California Air Resource Board
- Just ask the data source directly
Revealed Preferences:
- Type of power redundancy in use by self-interested entities that want to always have power
- City of San Diego
- County of San Diego
- Local public safety agencies
- Local datacenters
- Telecommunications companies
- Hospitals
- Transit agencies
- Jails
- Sources of information about the revealed preferences:
- Satellite imagery
- RFPs, purchase orders, and financial statements
- Just ask them
From the CPUC:
SDG&E had 68.64 SAIDI minutes in 2019 (data is available going back to 1997) excluding MED. There were 122.96 SAIDI minutes including MED.
Assuming that ">3 day outage" = a MED, then we can do a little algebra.
Given:
SAIDI = Total minutes every customer was without power due to sustained outages / total number of customers
SAIDI without MED = Total minutes every customer was without power due to sustained outages - total MED minutes / total number of customers
68.64 = (Min - Med) / C
122.96 = Min/C
MED minutes = 1358 * # of customers / 25
Since we want to know the p for a given customer, then we further calculate:
MED minute / customer in a year = 1358/25 * # of customers / # of customers
= 54.32 minutes
Therefore:
p = 1.033E-4 that any particular minute will be without power during a major power outage in San Diego, CA
Over the span of 10 years, you'd expect to sit through just over 9 hours of lonely extended darkness.
From a sewage treatment plant RFP:
The "[fuel] tank shall hold 3 days of diesel fuel storage at 70% generators load" for the "two Owner Supplied Trailer Mounted 2MW Caterpillar XQ2000 backup generators".
If we could find the power consumption of the Penasquitos Sewer Pump Station, then we could calculate (3 * amount of fuel consumed at 70% load of a 2MW Caterpillar XQ2000 generator * 2) / (daily power consumption) to find the # of expected consecutive blackout days.
Let's pretend that # is "3" and simplistically assume that it corresponds to 3 days of doom per year. We'll also multiply by 2 as an extra safety factor because the City can probably get fuel easier than normal people.
p = 3 days / 365 days * 2
= 0.016
Replies from: jkaufman↑ comment by jefftk (jkaufman) · 2021-05-16T22:58:08.894Z · LW(p) · GW(p)
I don't quite understand how your analysis fits together, but notes on two pieces:
Assuming that ">3 day outage" = a MED, then we can do a little algebra.
"MED" is "Major Event Day" (definition, context). My stats aren't that great, but I think what they're doing is assuming a log normal distribution of outages and then counting any day that's 2.5 standard deviations worse than average as a "Major Event Day". So roughly two days a year (0.6% of days) should count as MEDs. What this means is that if you have a very reliable power company you will have a lower threshold for declaring an MED than someone with a less reliable one.
3 days of diesel fuel storage ... the City can probably get fuel easier than normal people.
My interpretation is that they will be able to get their generator tanks refilled within three days even in most emergencies. This does not guarantee that the blackout has ended, though.