Minor interpretability exploration #1: Grokking of modular addition, subtraction, multiplication, for different activation functions
post by Rareș Baron · 2025-02-26T11:35:56.610Z · LW · GW · 13 commentsContents
  Introduction
    TL;DR results
  Methods
  Results
    Operations
    Activation functions
  Discussion
  Conclusion
  Acknowledgements
None
13 comments
Epistemic status: small exploration without previous predictions, results low-stakes and likely correct.
Edited to implement feedback [LW · GW]by Gurkenglas which has unearthed unseen data. Thank you!
Introduction
As a personal exercise for building research taste and experience in the domain of AI safety and specifically interpretability, I have done four minor projects, all building upon code previously written. They were done without previously formulated hypotheses or expectations, but merely to check for anything interesting in low-hanging fruit. In the end, they have not given major insights, but I hope they will be of small use and interest for people working in these domains.
This is the first project: extending Neel Nanda’s modular addition network [LW · GW], made for studying grokking, to subtraction and multiplication, as well as to all 6 activation functions of TransformerLens (ReLU, 3 variants of GELU, SiLU, and SoLU plus LayerNorm).
The modular addition grokking results have been redone using the original code, while changing the operation (subtraction, multiplication), and the activation function.
TL;DR results
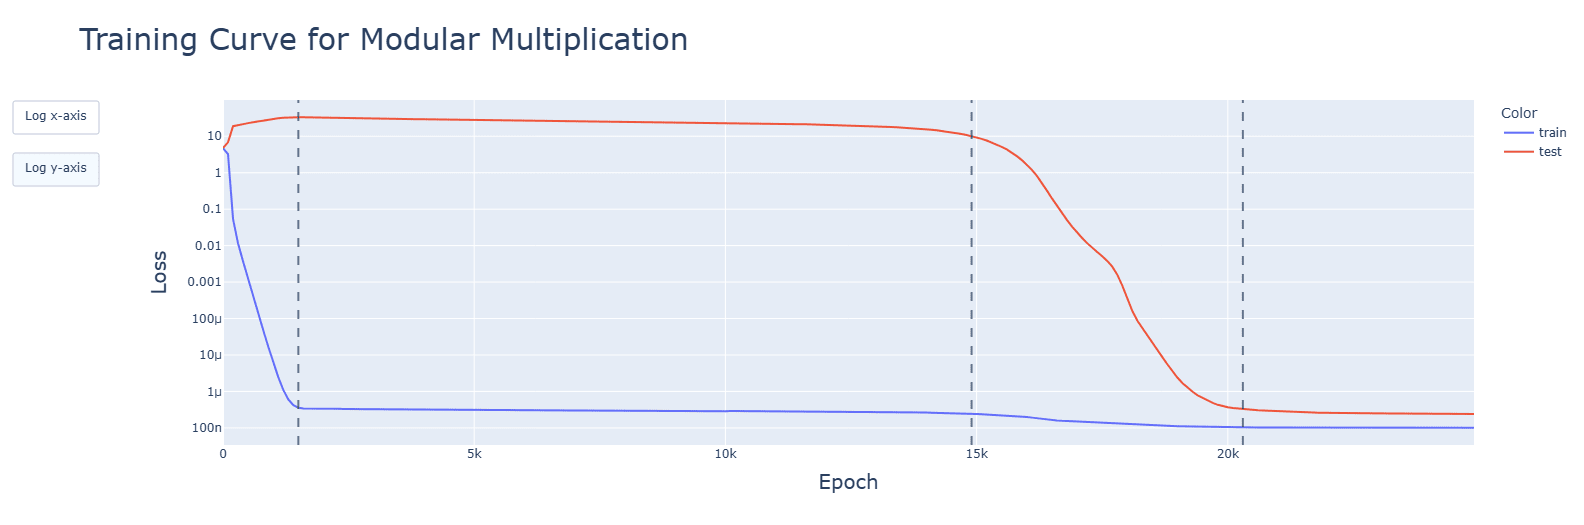
- Subtraction does implement the same Fourier transform-based "clock" algorithm. Multiplication, however, does not.
- GELU greatly hastens grokking, SiLU only slightly.
- LN messes up the activations and delays grokking, otherwise leaving the algorithm unchanged.
Methods
The basis for these findings is Neel Nanda’s grokking notebook. All modifications are straight-forward.
All resulted notebooks, extracted graphs, and word files with clean, tabular comparisons can be found here.
Results
Operations
General observations for the three operations[1]:
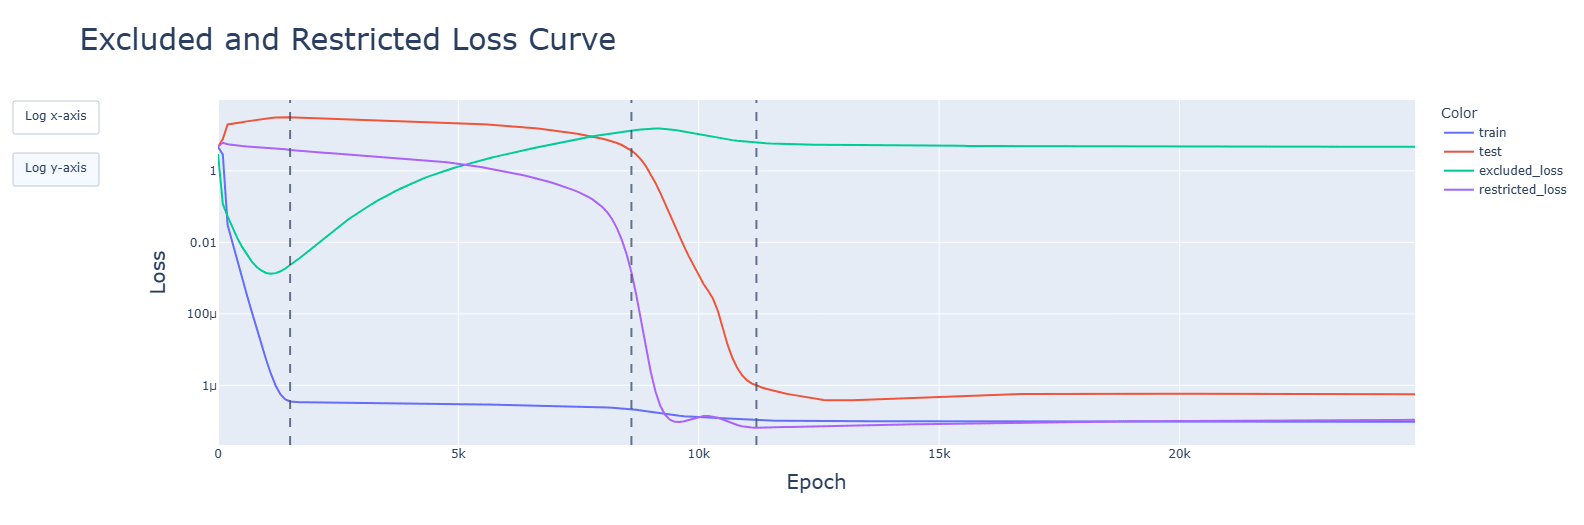
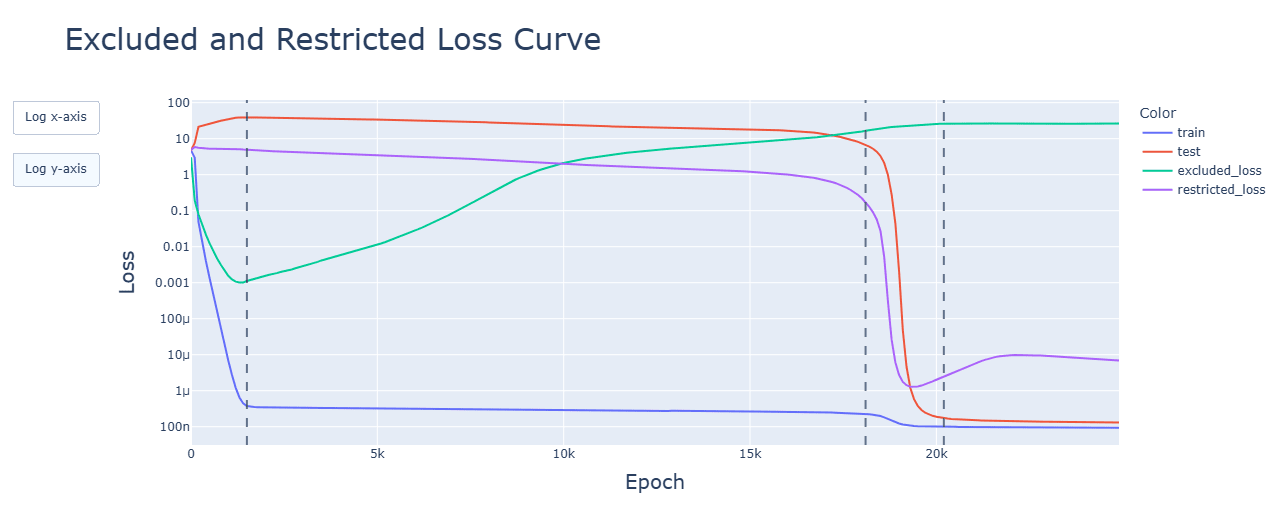
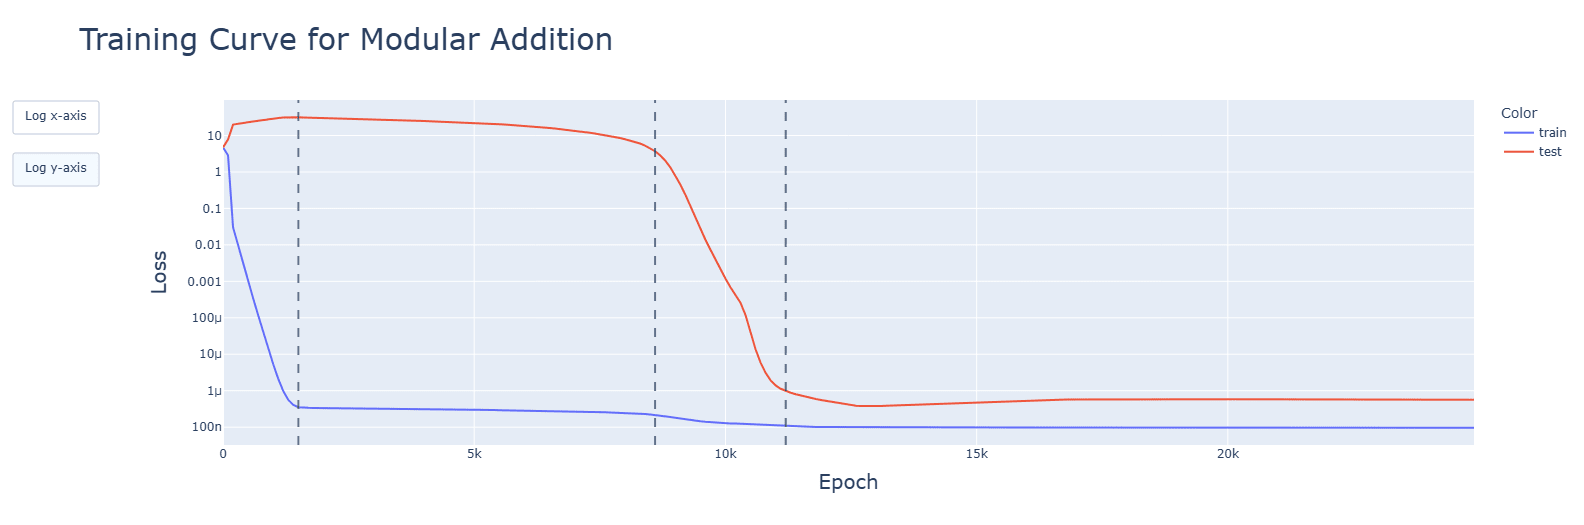
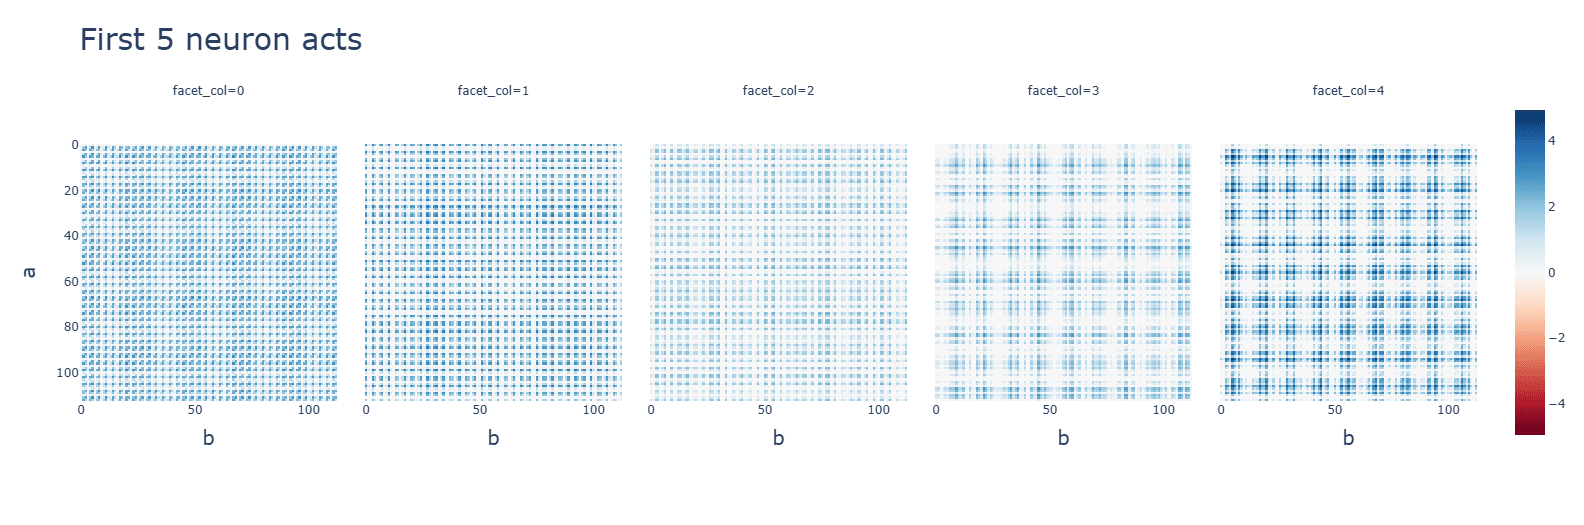
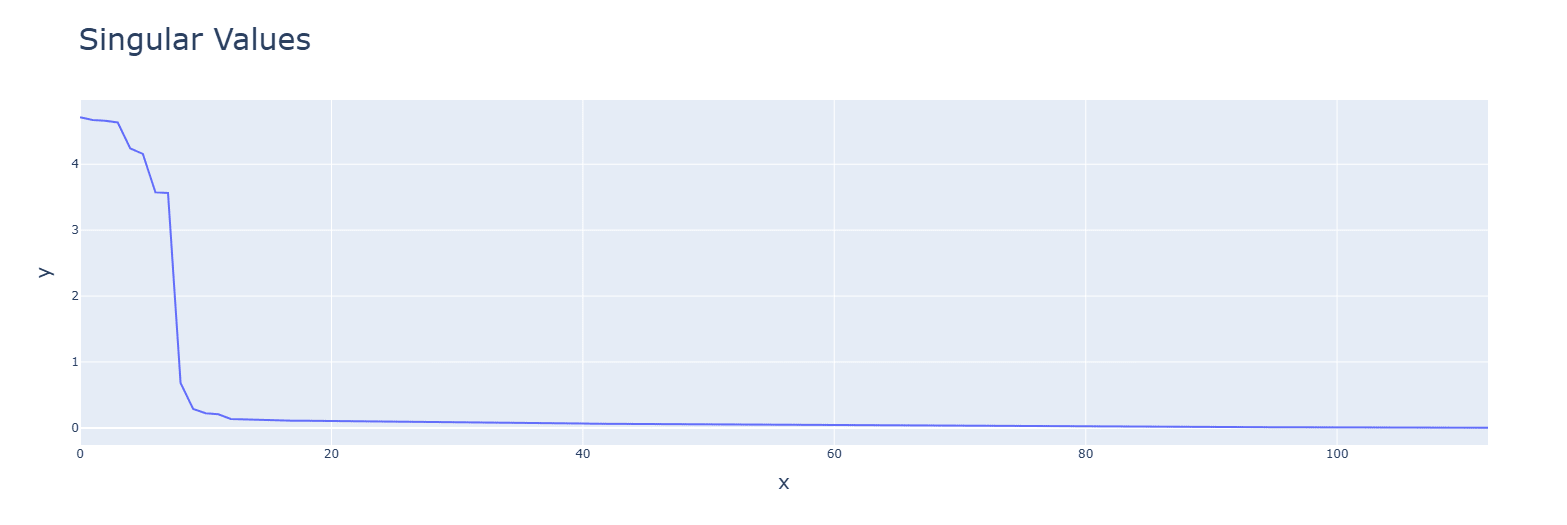
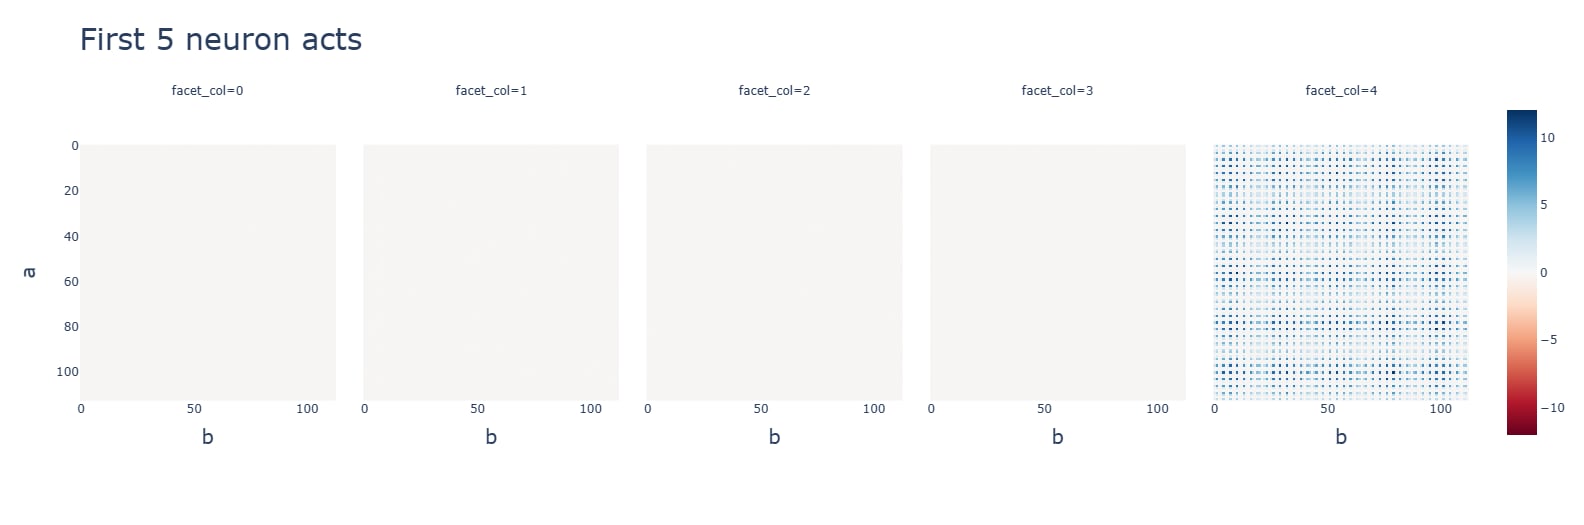
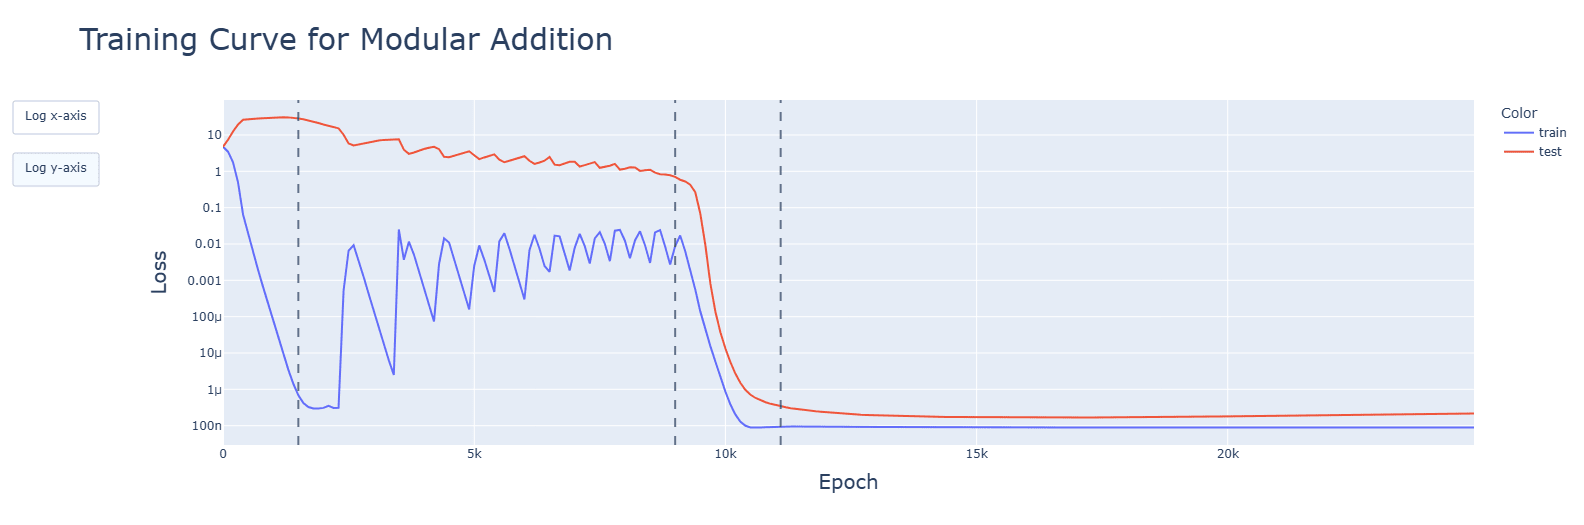
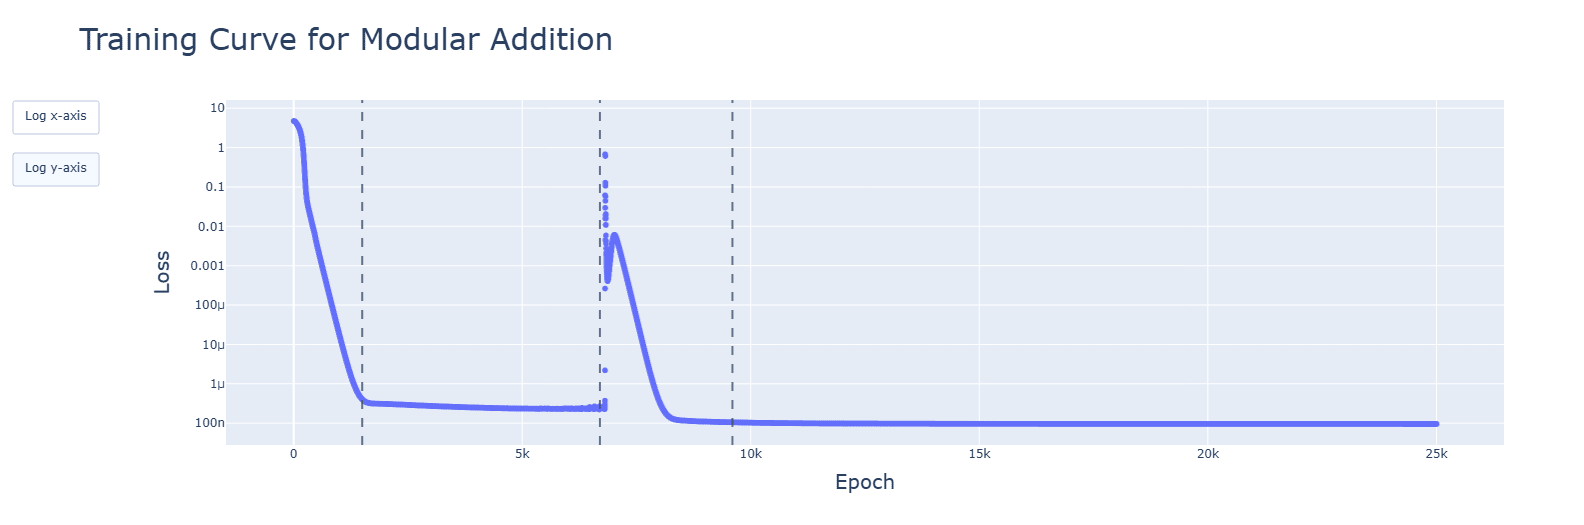
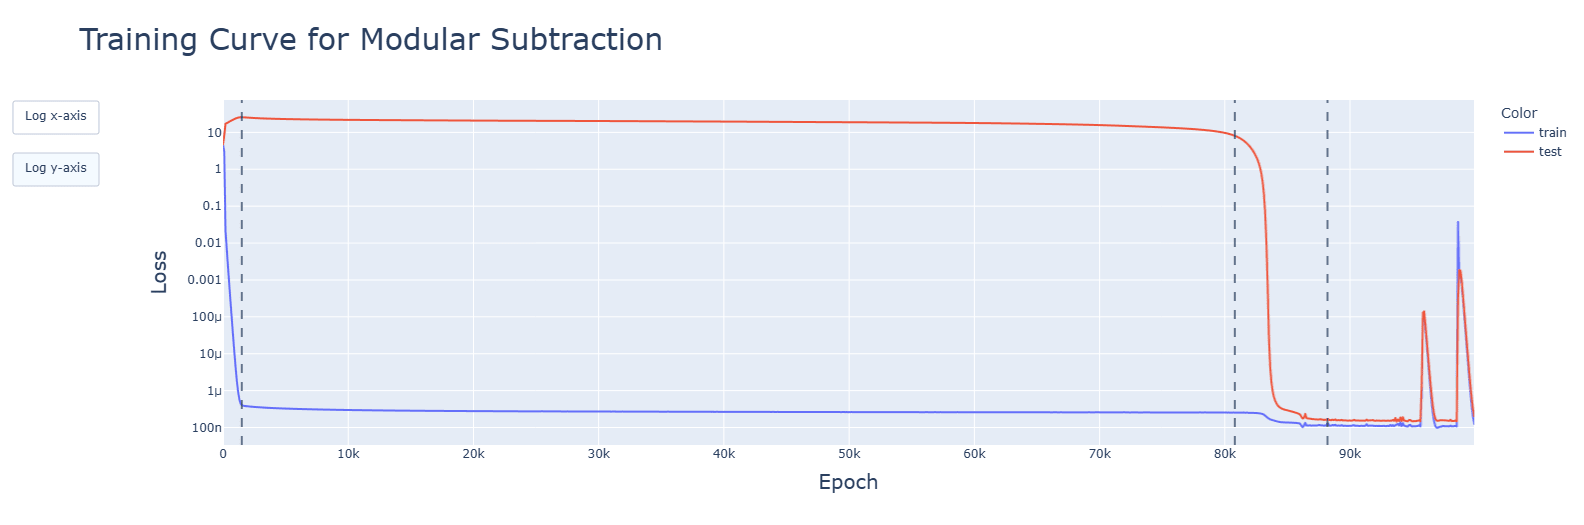
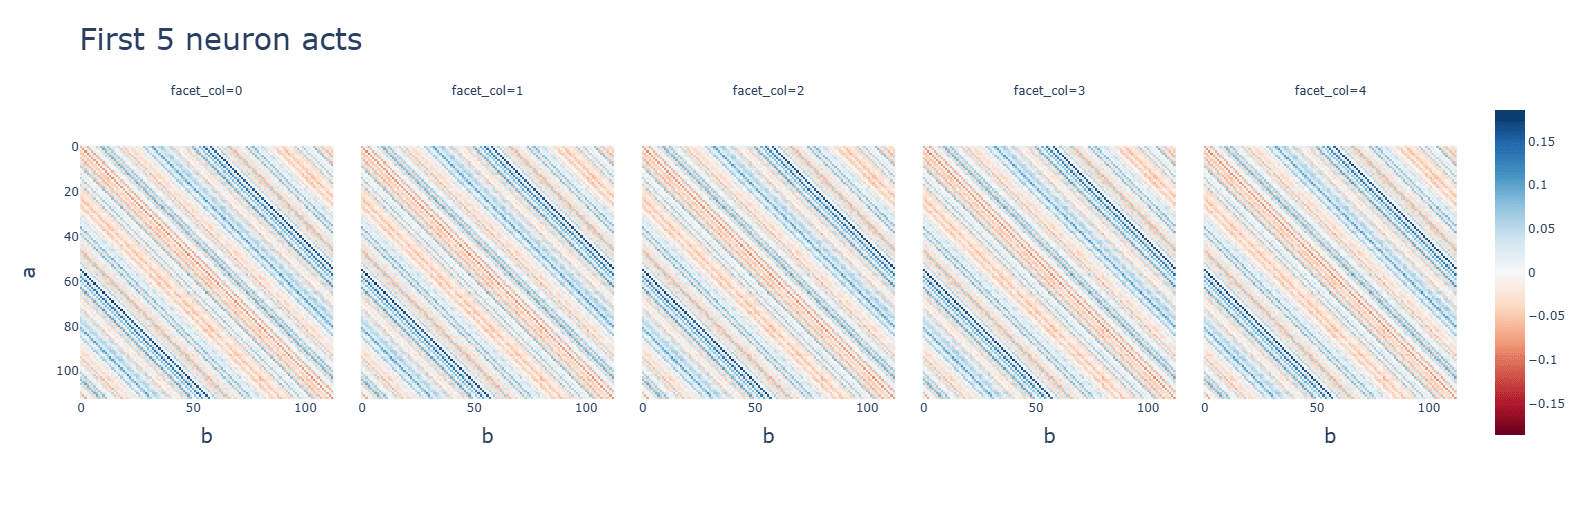
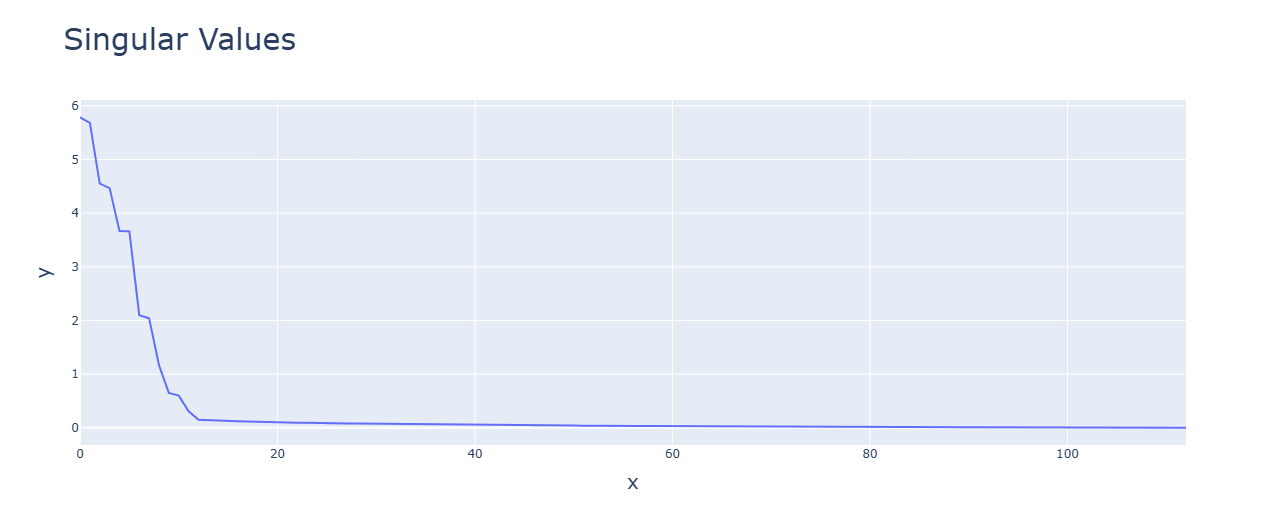
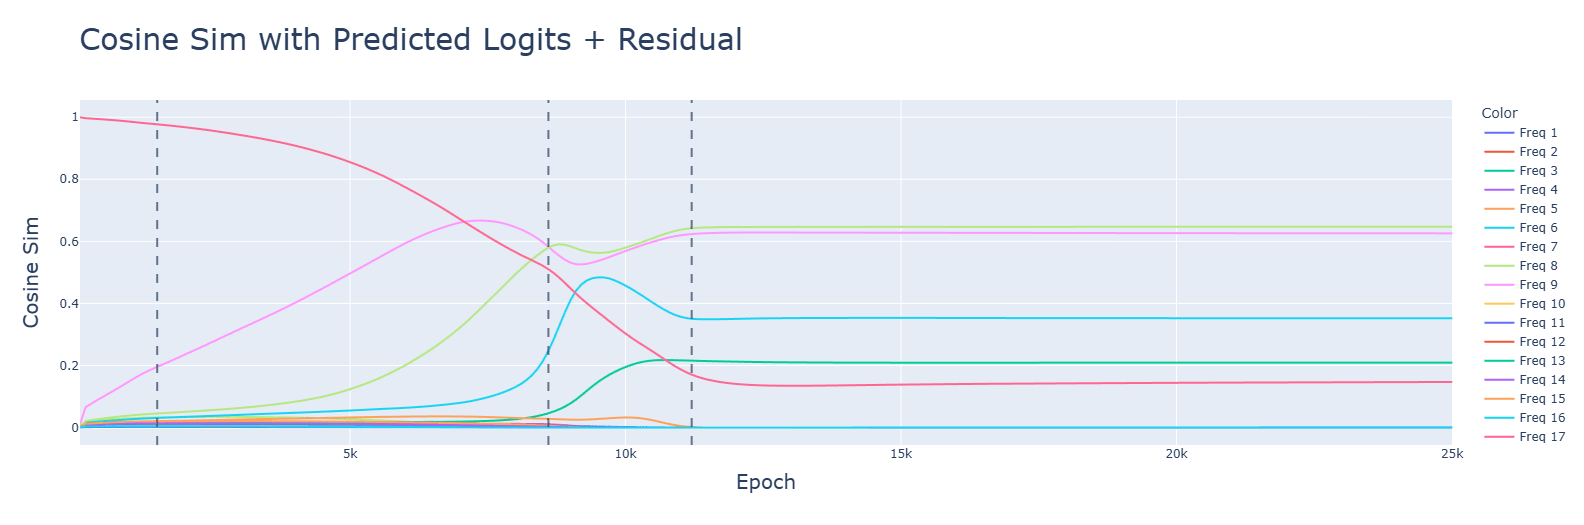
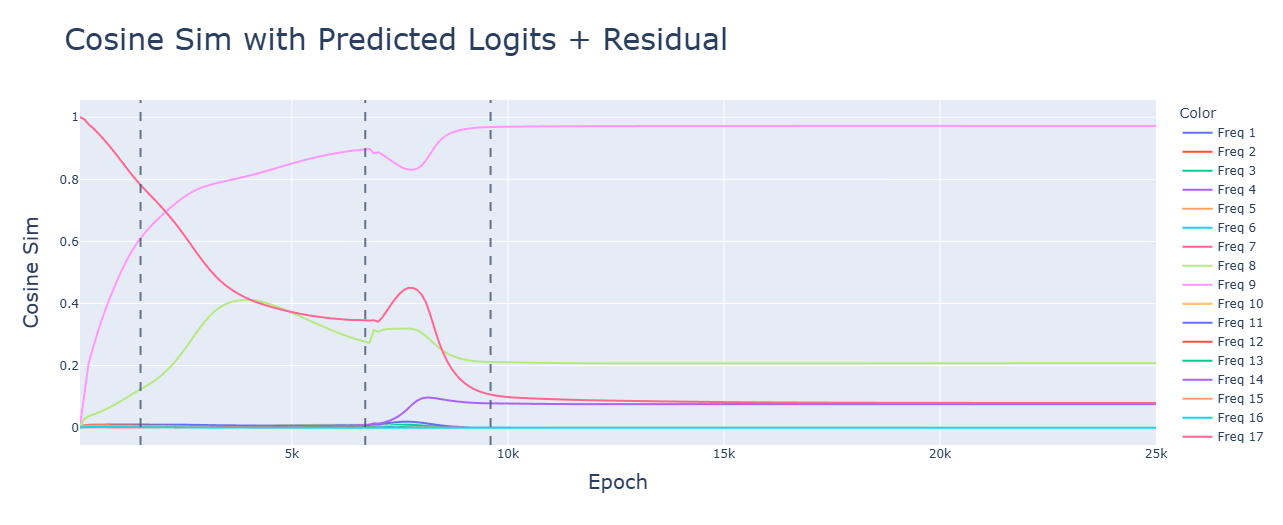
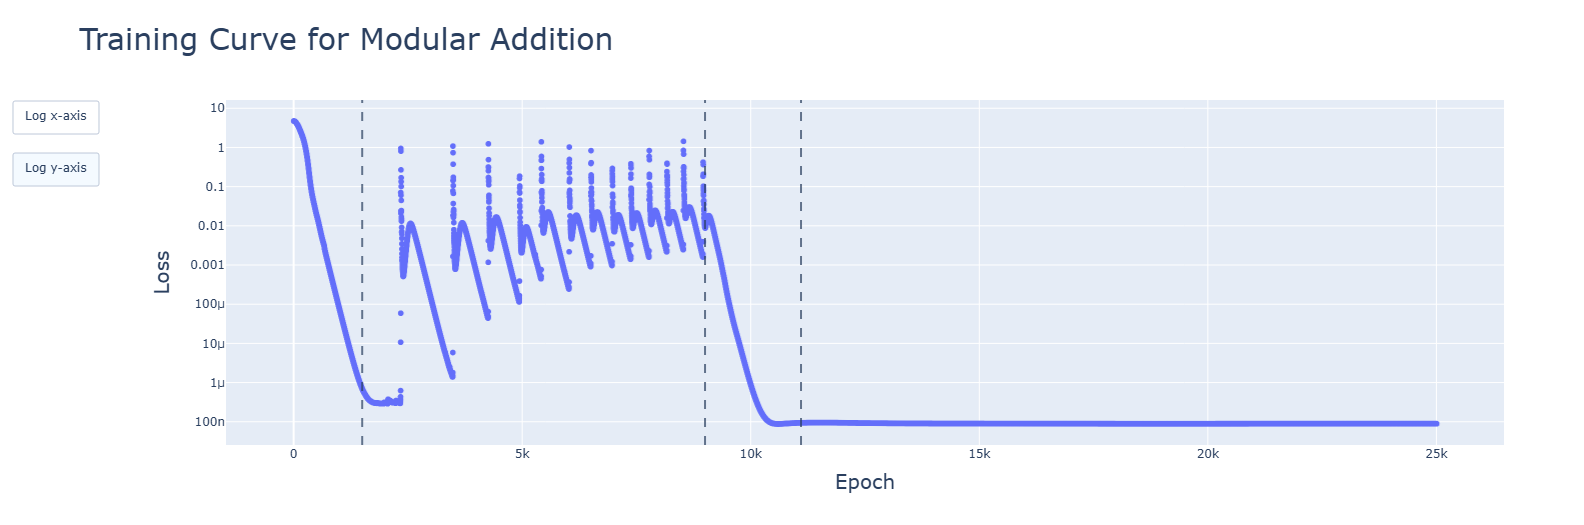
- Developments for relevant aspects of the network (attention heads, periodic neuron activations, concentration of singular values, fourier frequencies) happened (details below) and were accelerated during the clean-up phase. Spikes seen in the training graphs were reflected, but did not have long-lasting impact. Interactive animated plots are in the additional notebooks in the drive.
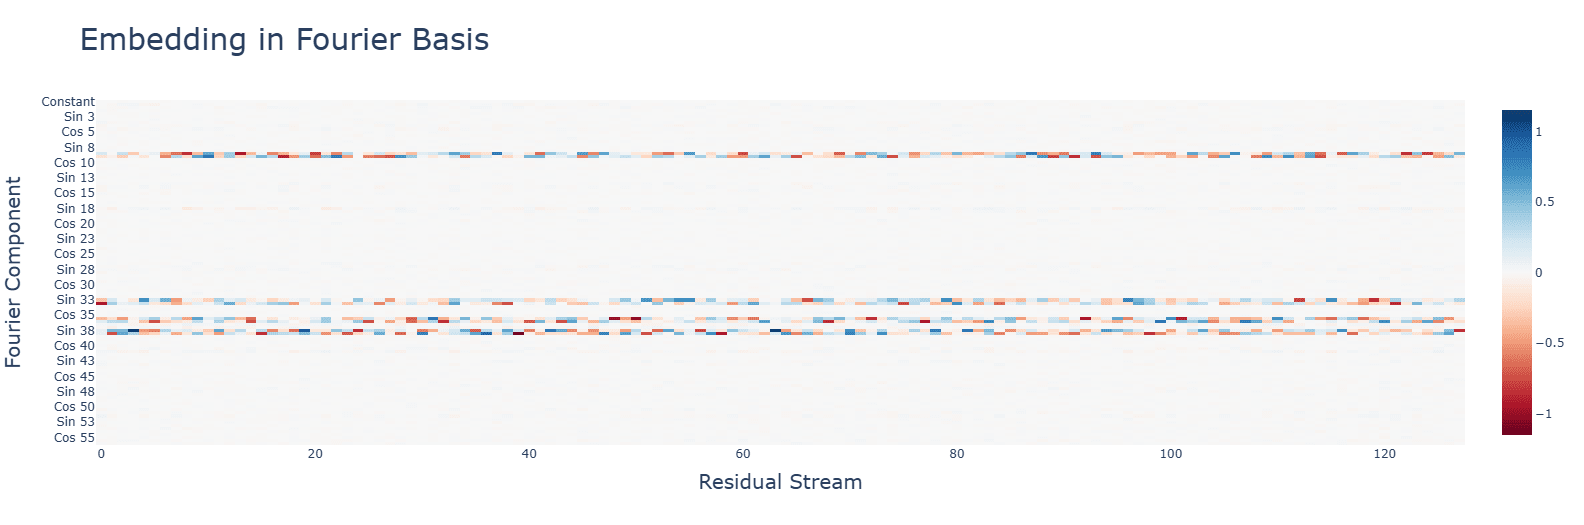
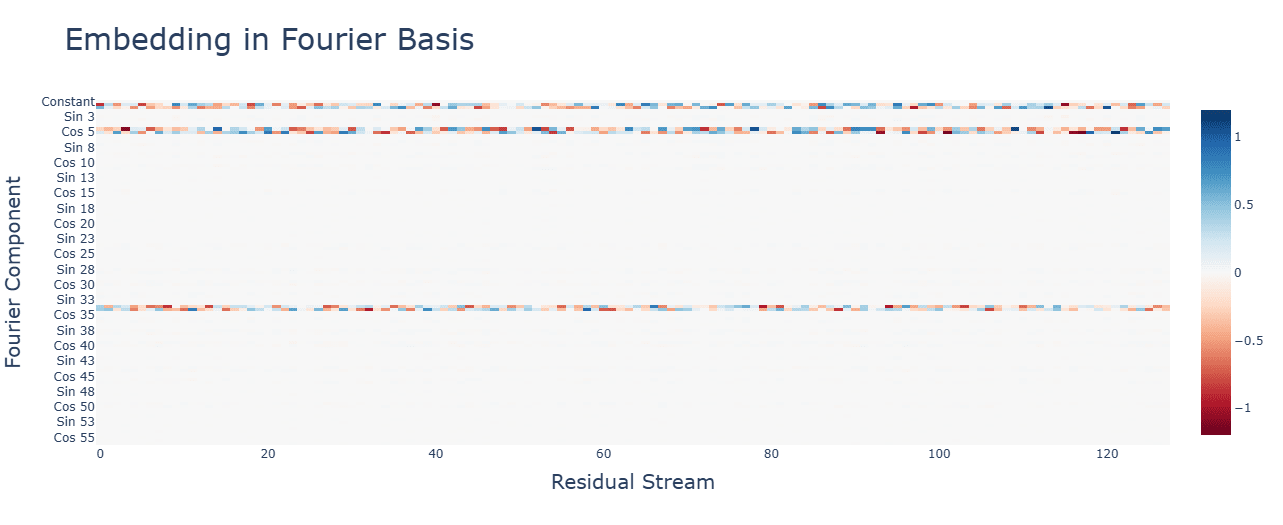
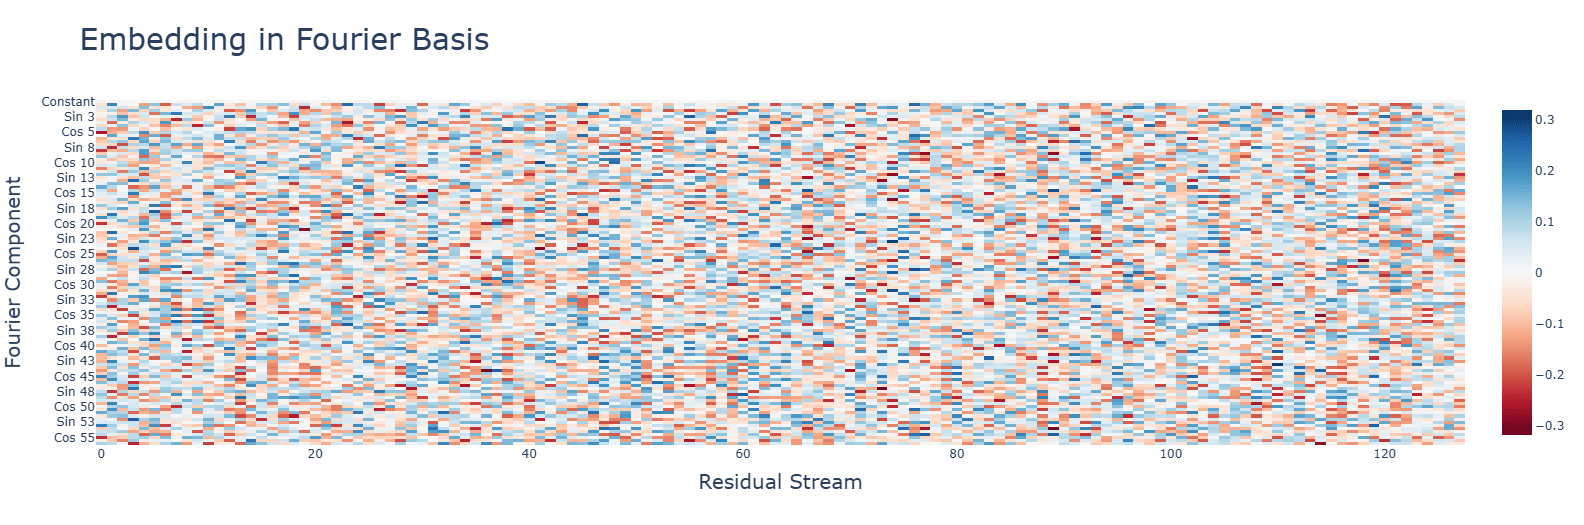
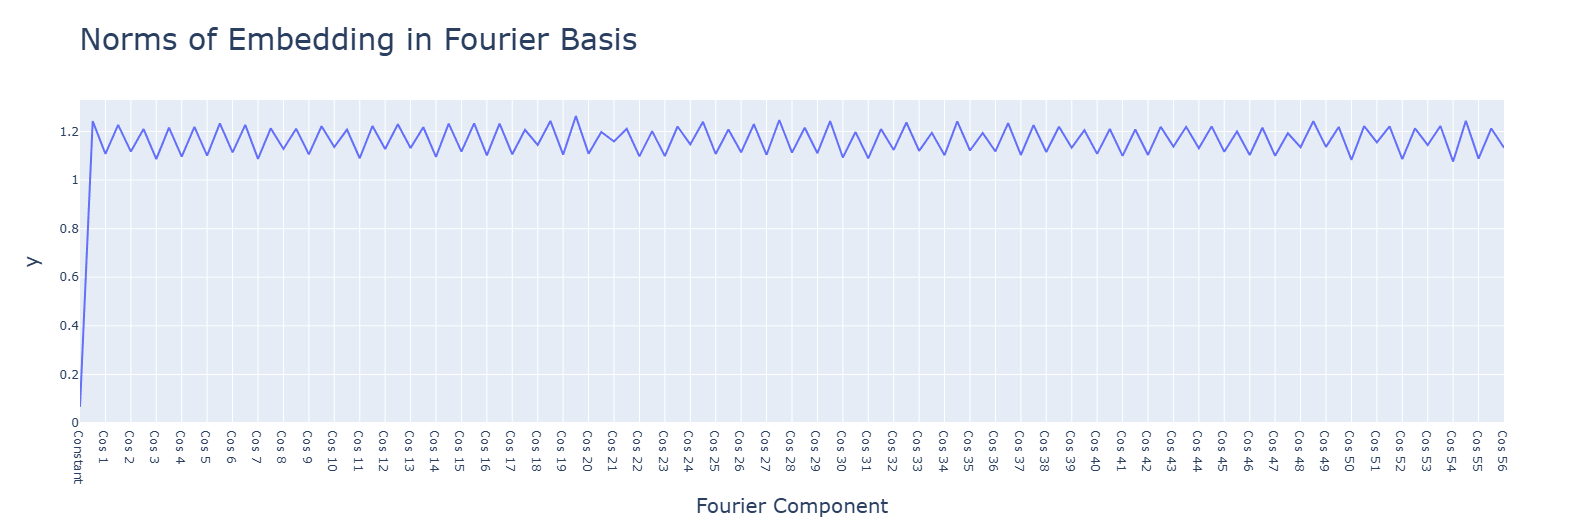
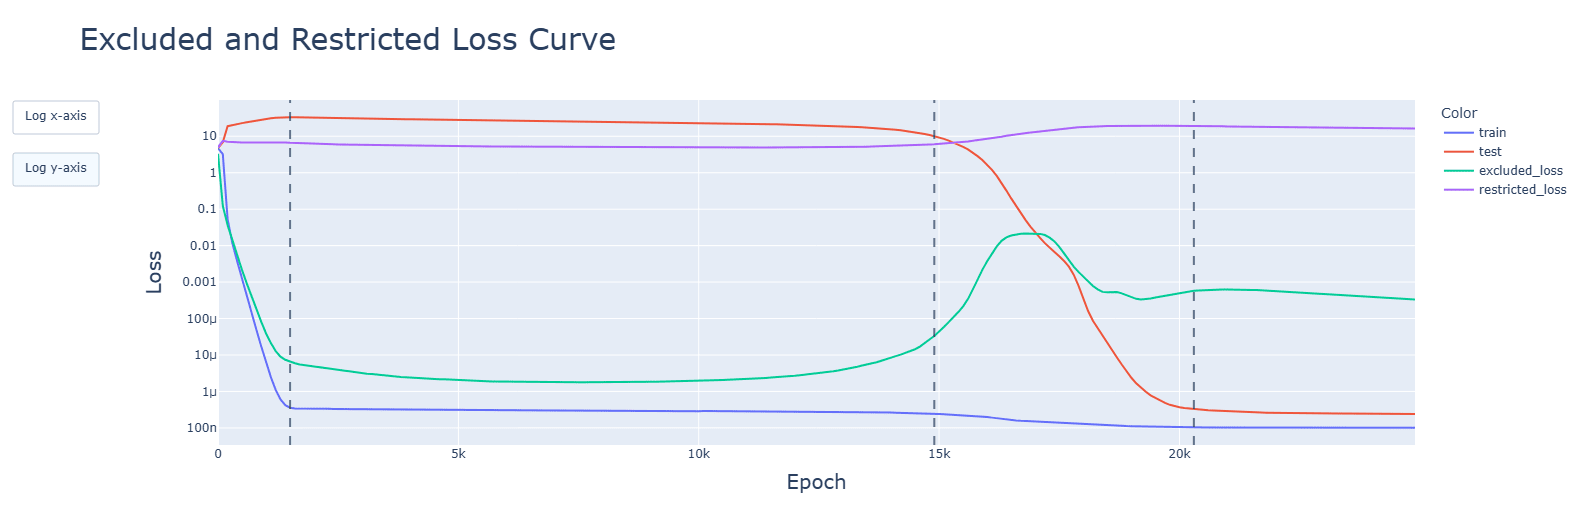
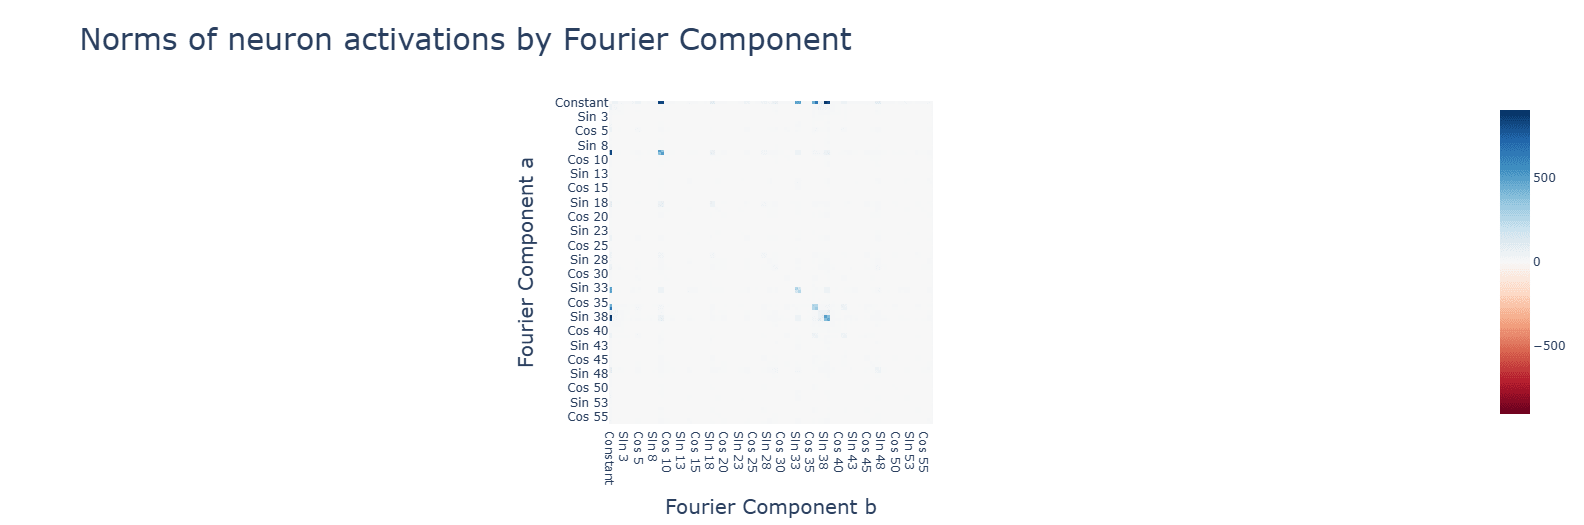
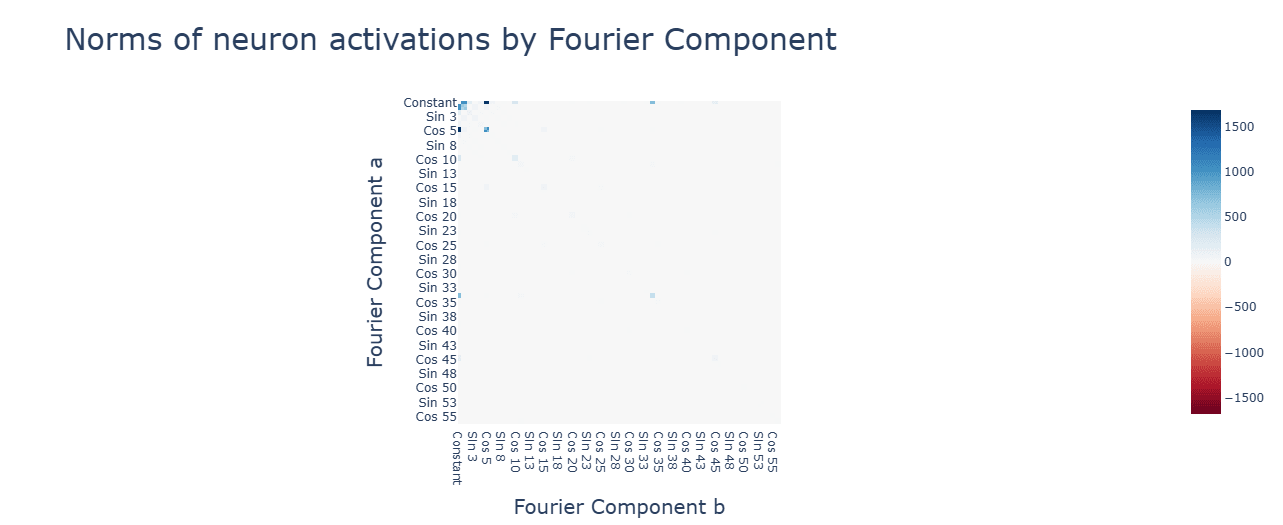
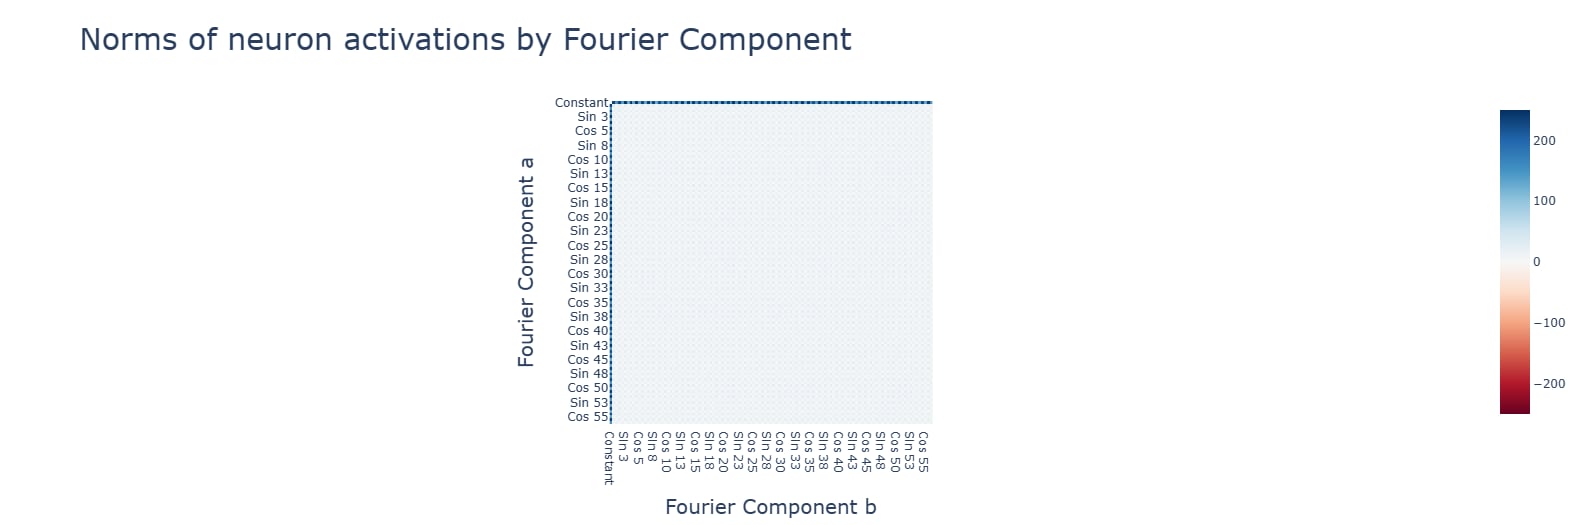
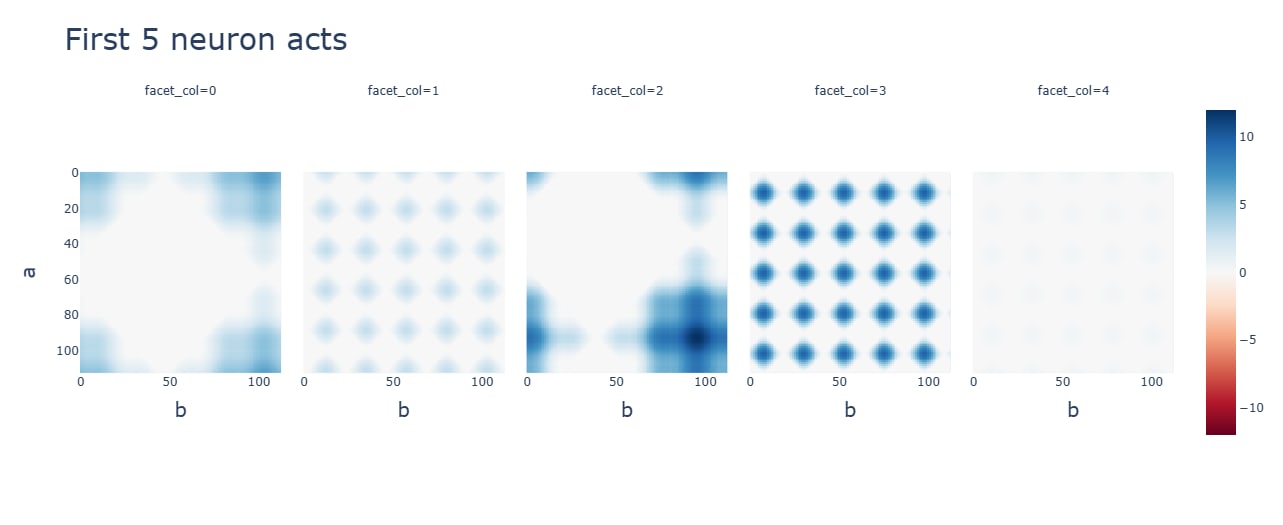
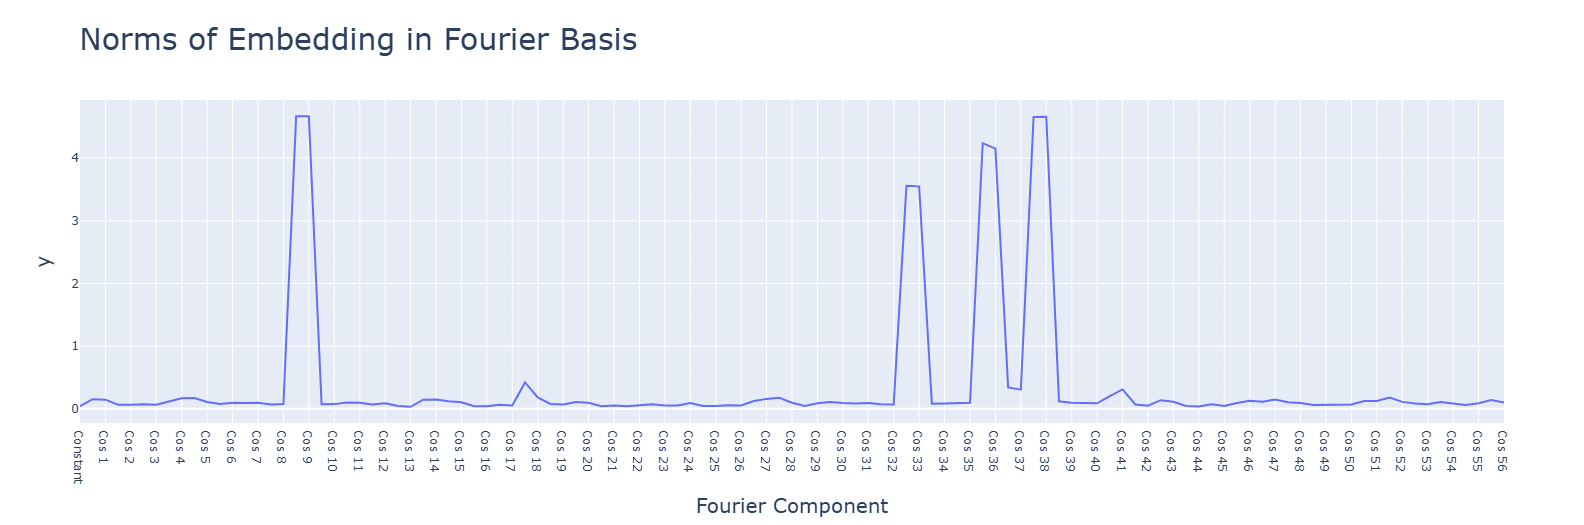
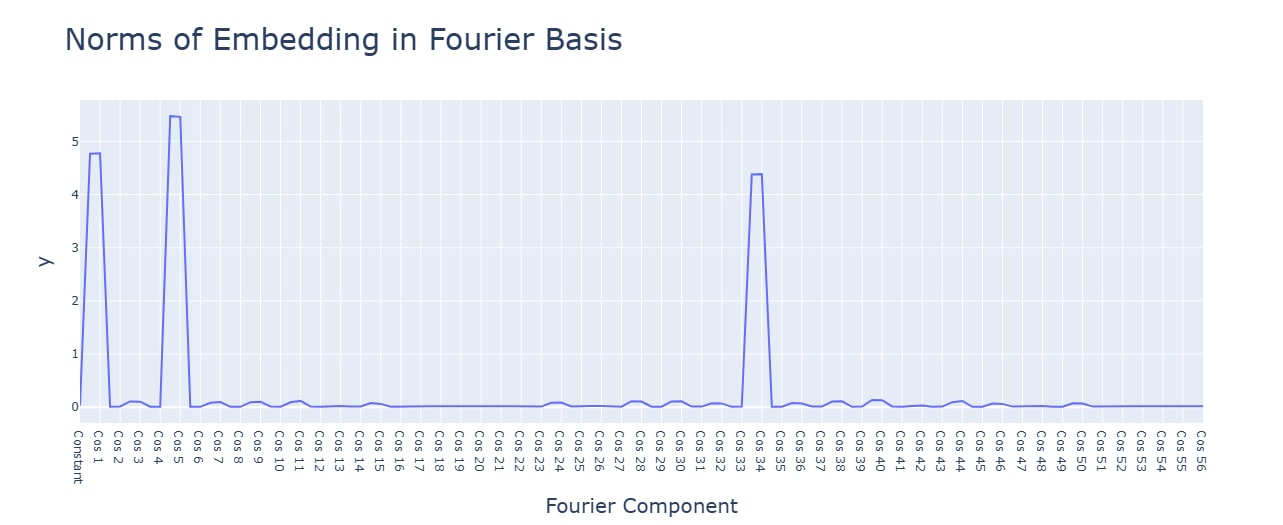
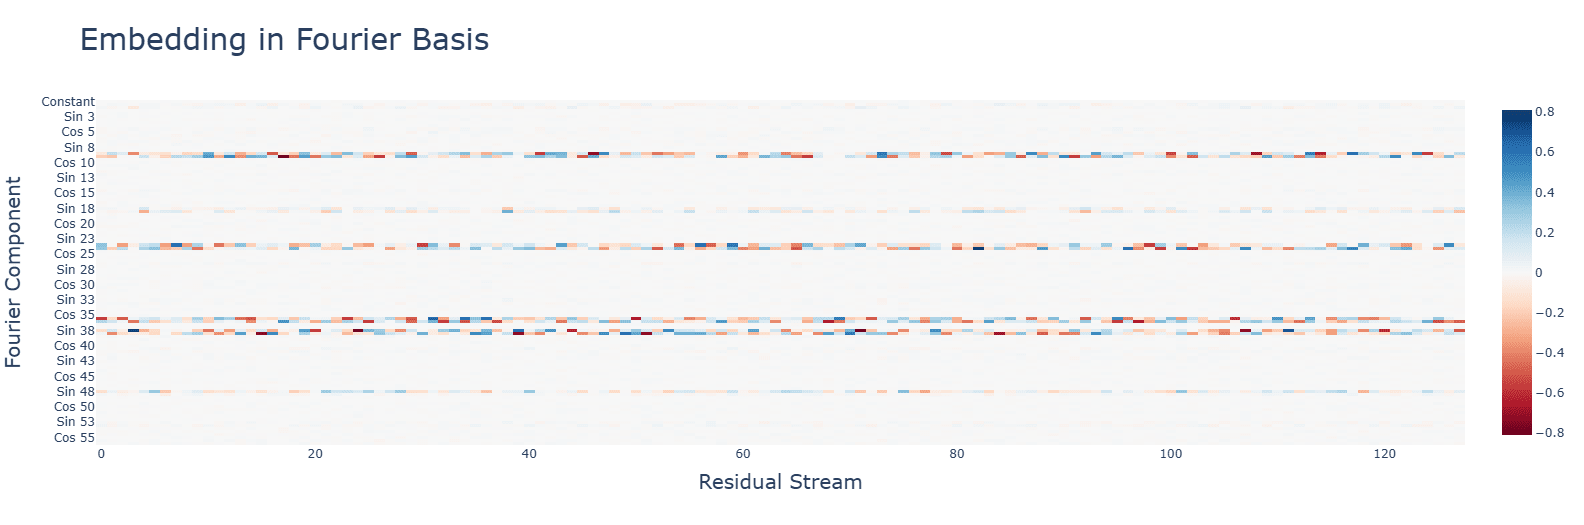
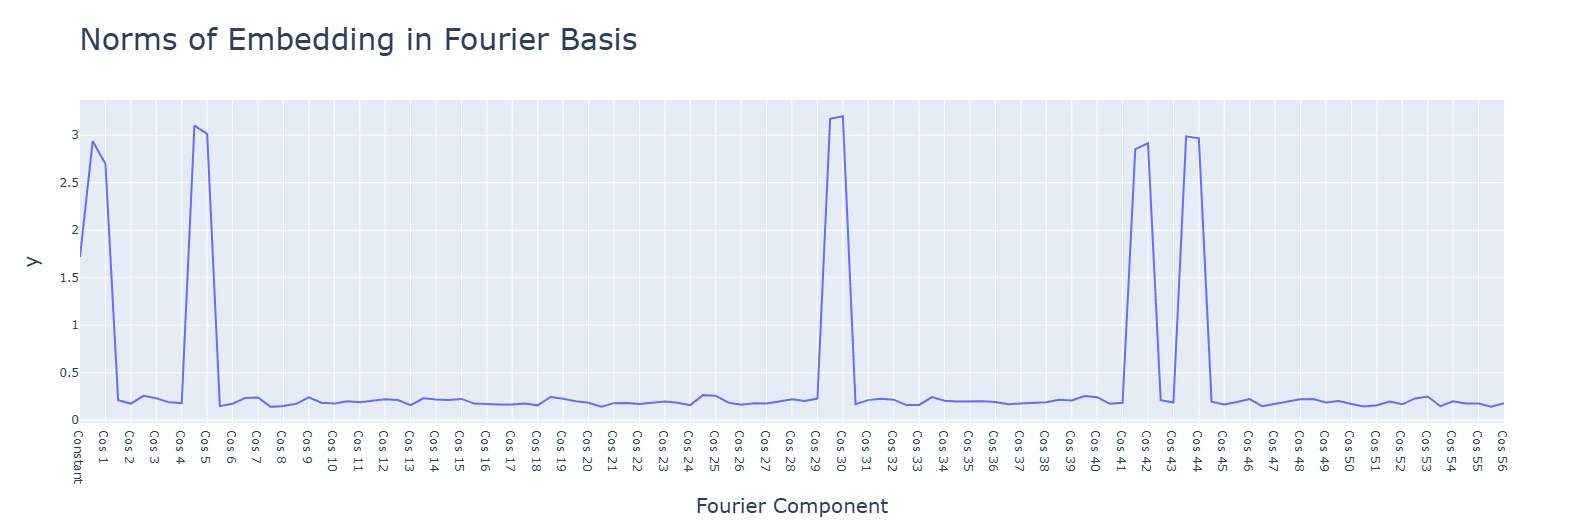
Subtraction uses the same Fourier algorithm. Multiplication has a random-looking Fourier basis and does not use a Fourier algorithm of any kind. For multiplication, ablating any frequency (in this case, the same 5 for addition) hurts performance across the board, and activations are mostly for the constant terms. Interestingly, during the clean-up phase, the fourier frequencies for multiplication are no longer random, but uniform.
Discussion: The fundamentally multiplicative aspect of neural networks might be an explanation, but this seems confusing and requires further research.
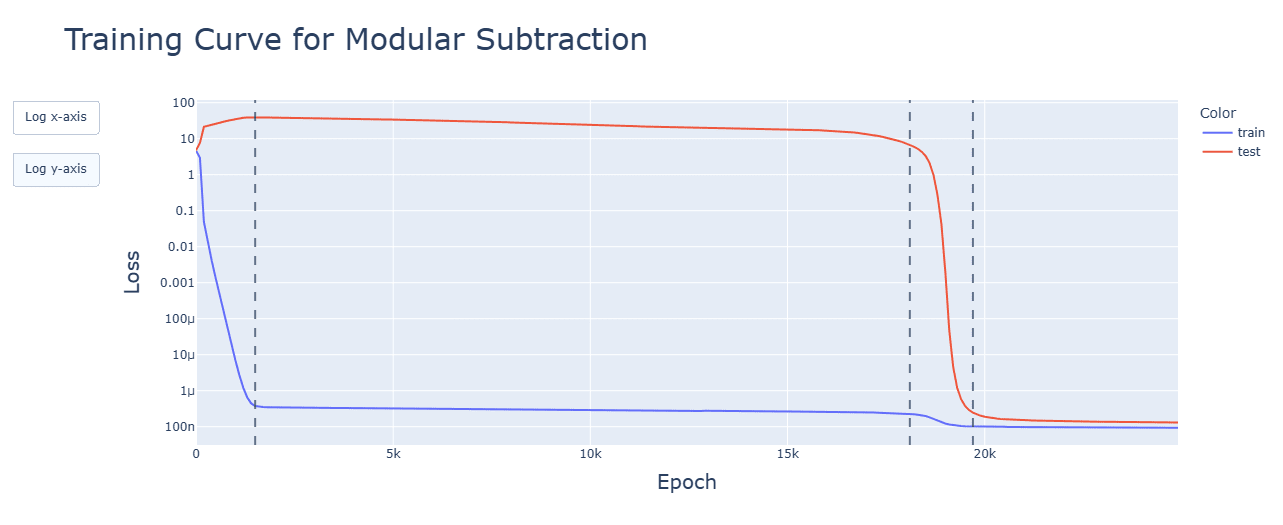
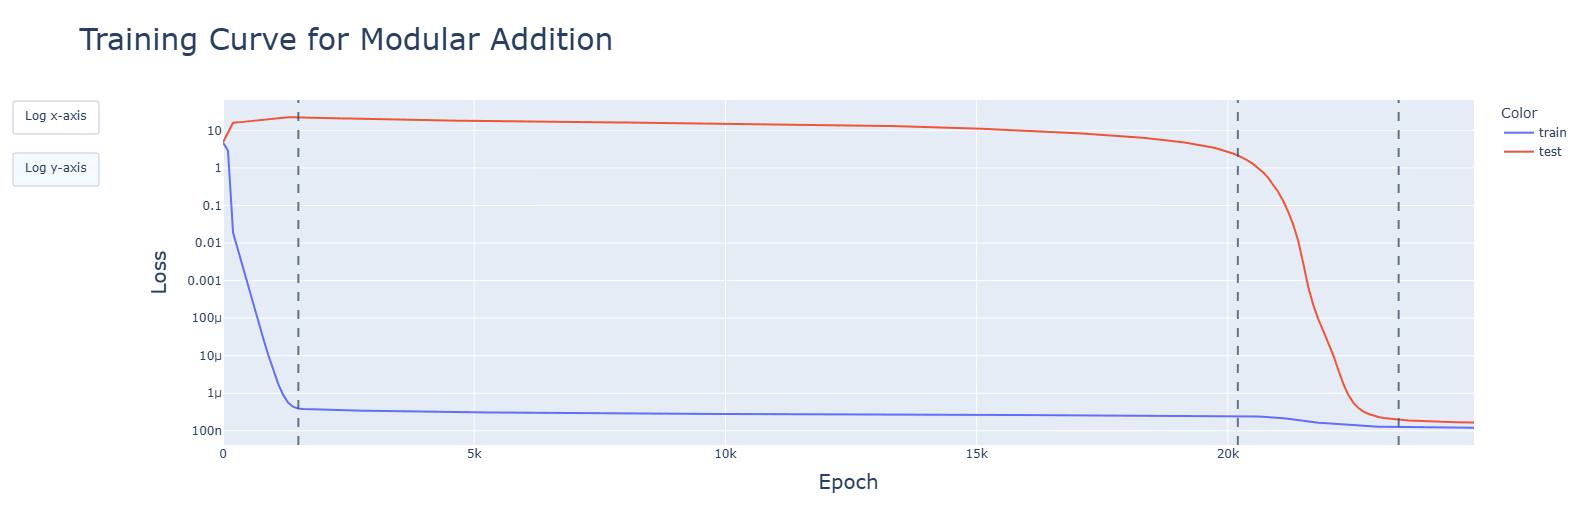
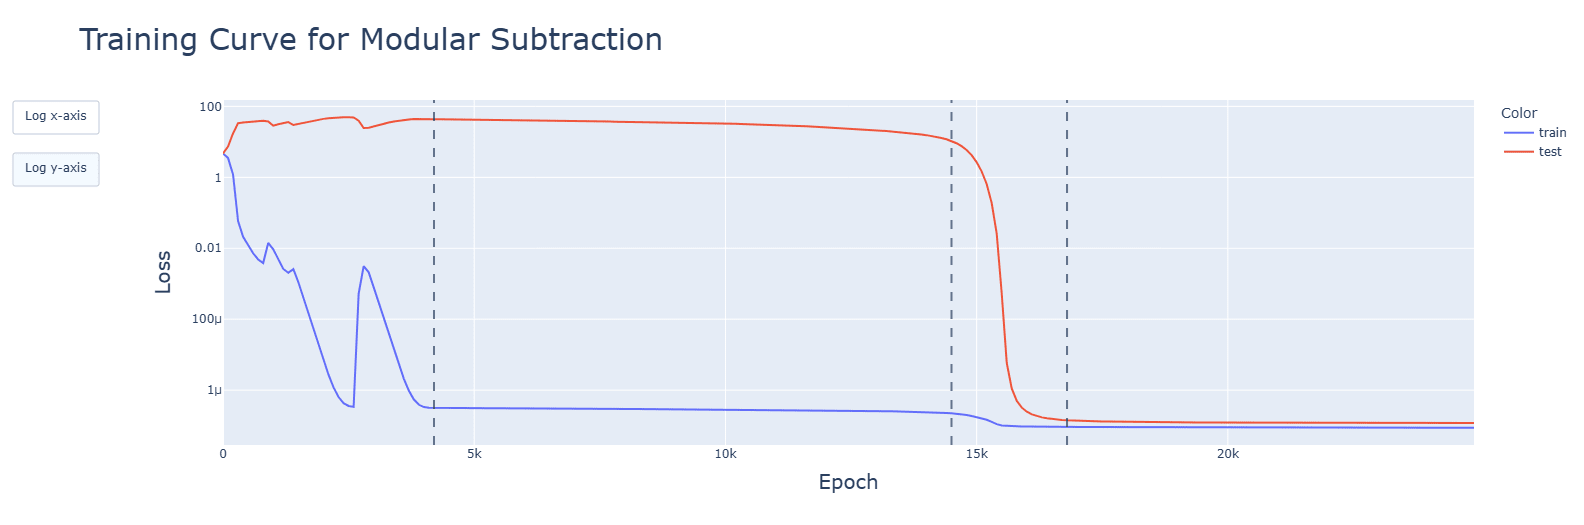
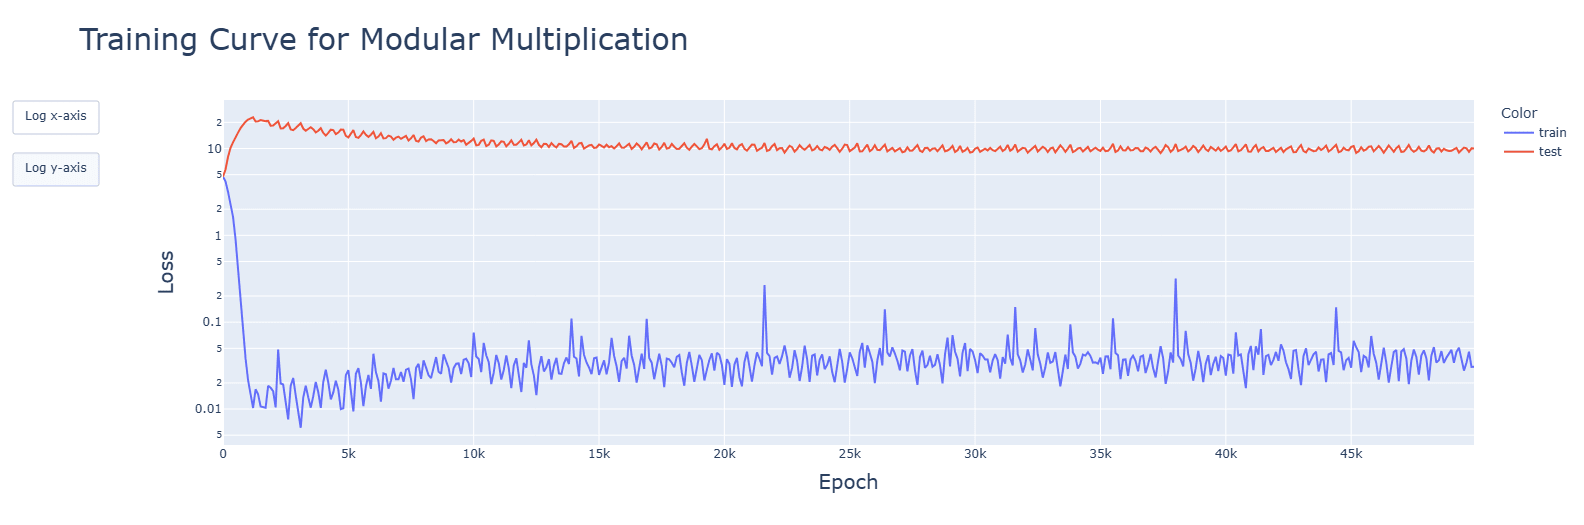
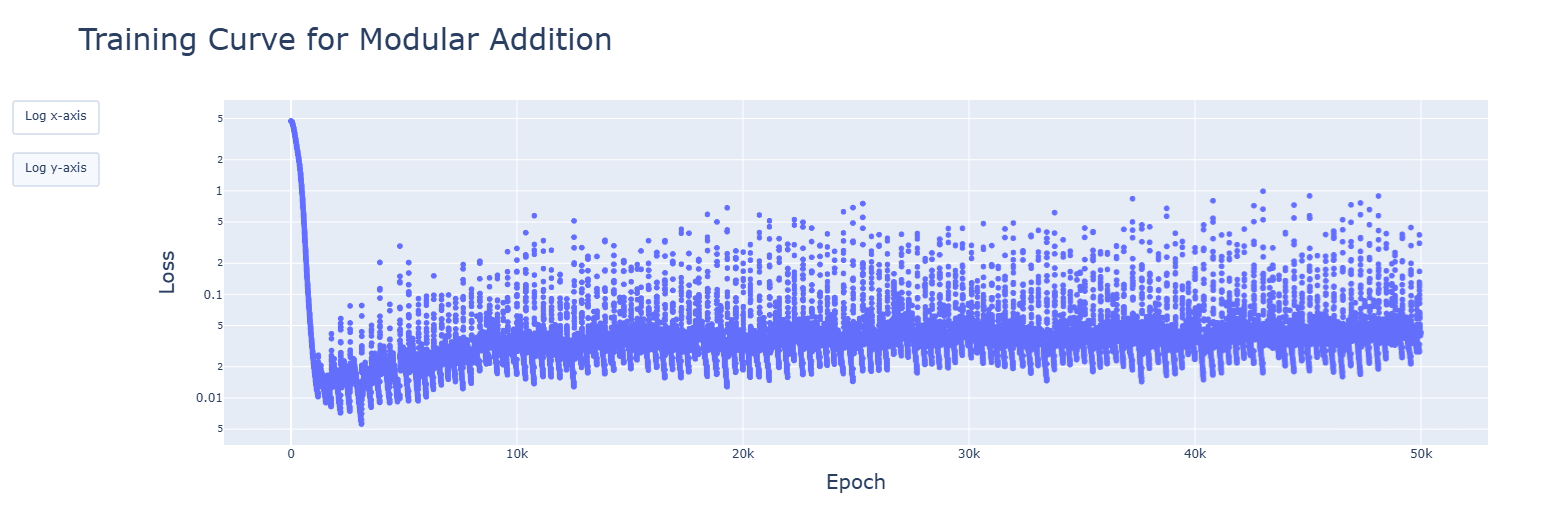
Subtraction and multiplication grok later than addition. Subtraction's clean-up phase is faster, however.
Discussion: Negative results for addition and the increased influence of the mod respectively are likely to blame (cosines are still used, after all).
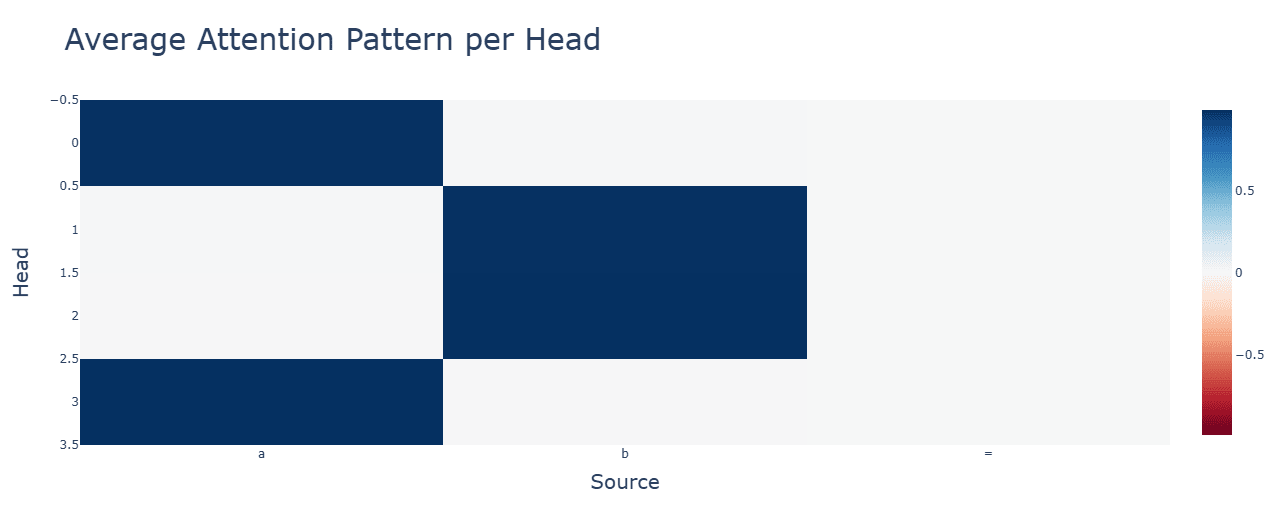
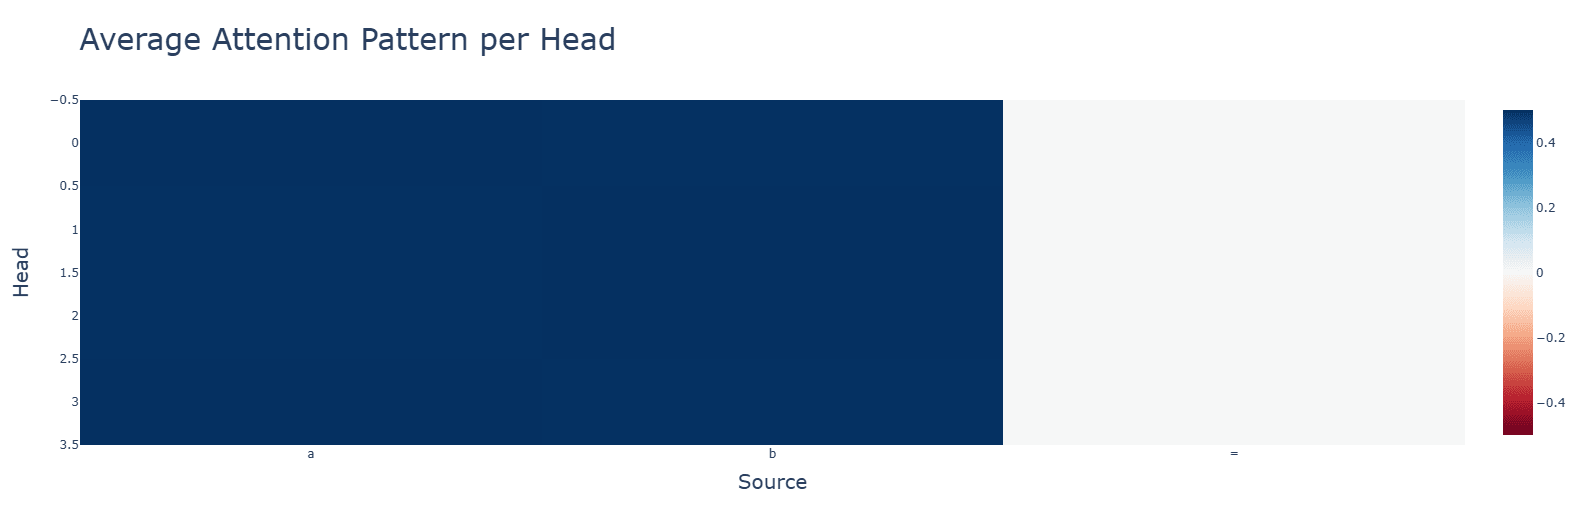
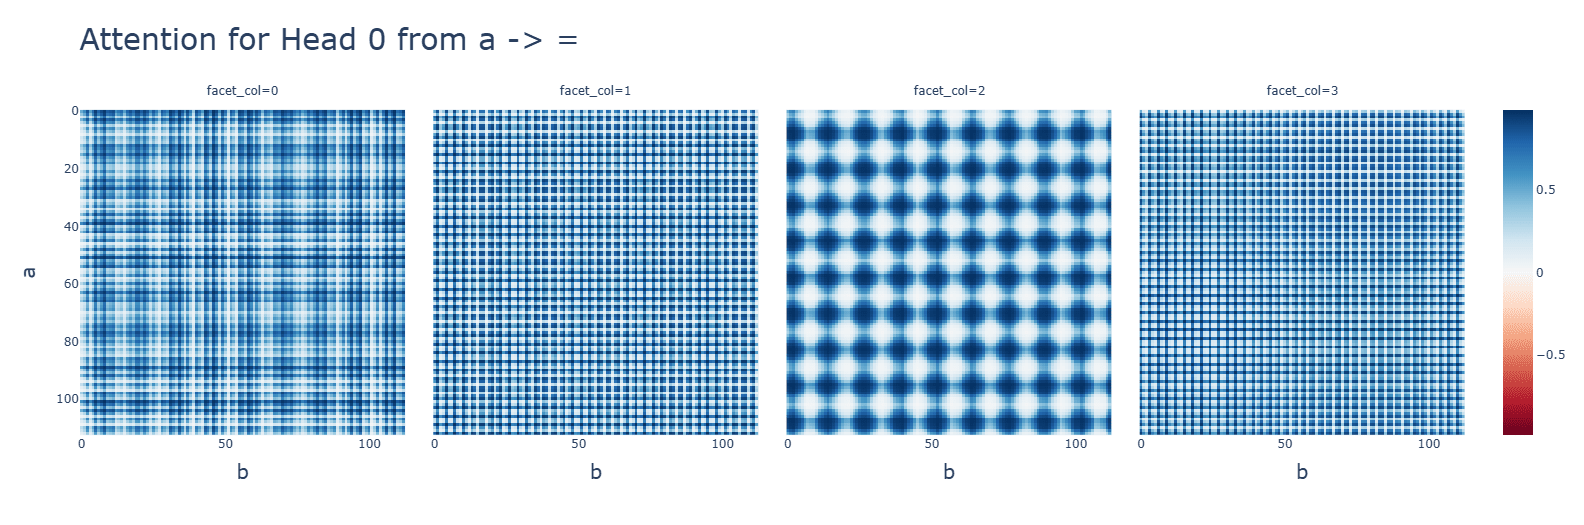
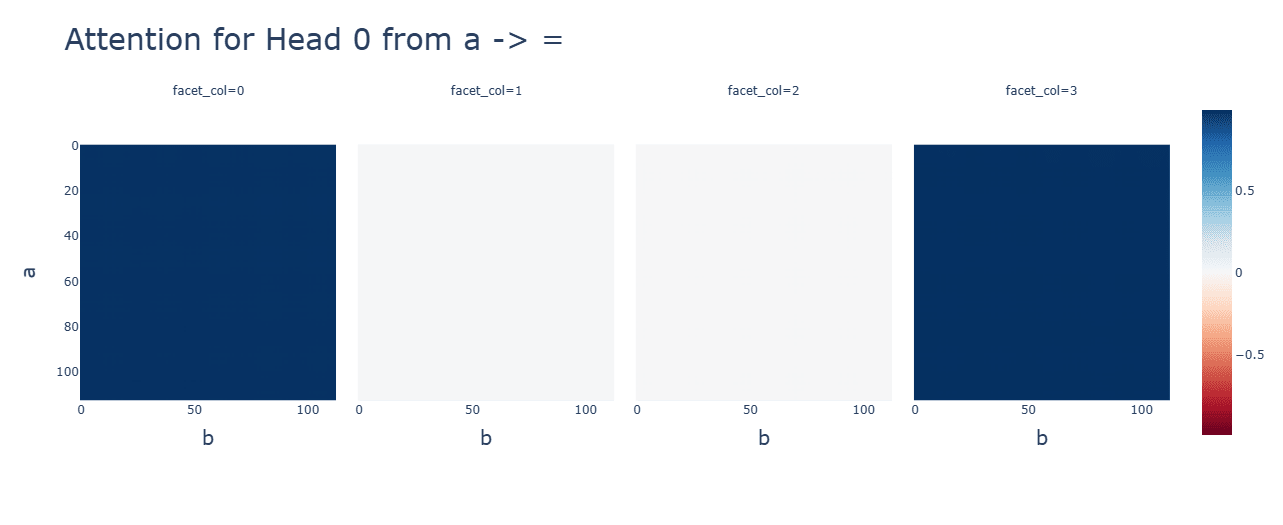
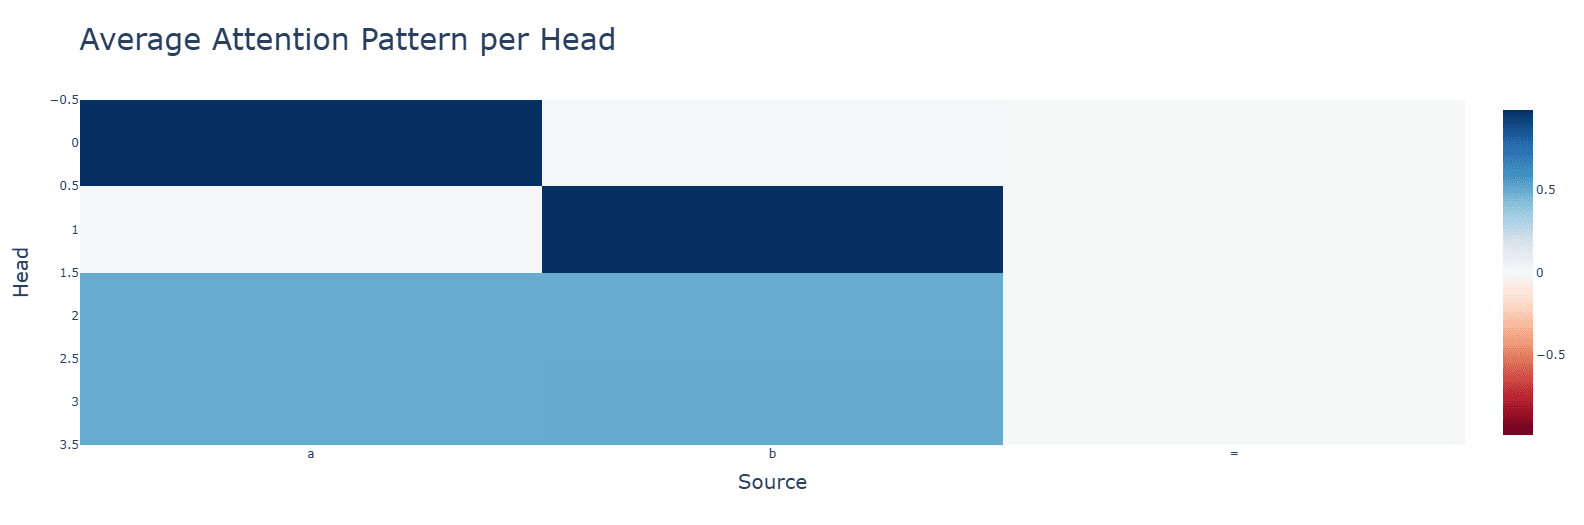
Attention is what we would expect.
Subtraction (bottom) makes some attention heads completely useless and others uniformly very high. Neuron activations, however, are more clustered.
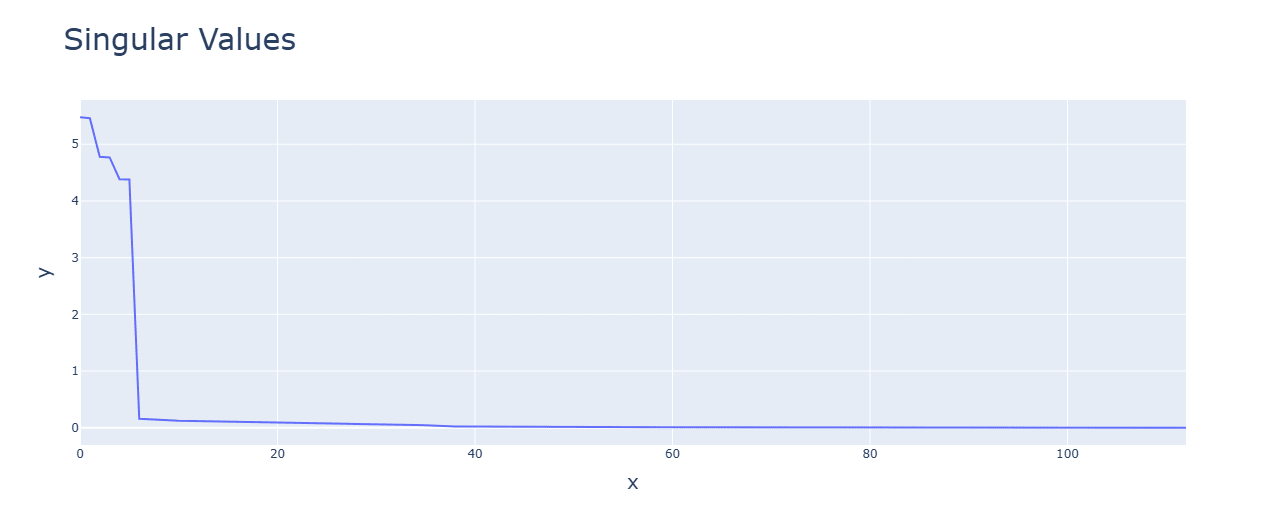
Discussion: Smaller values given by the subtraction operations might be the cause.Subtraction (bottom) has tighter singular values and uses higher frequencies (one is out of graph).
Discussion: Likely for similar reasons as the above.
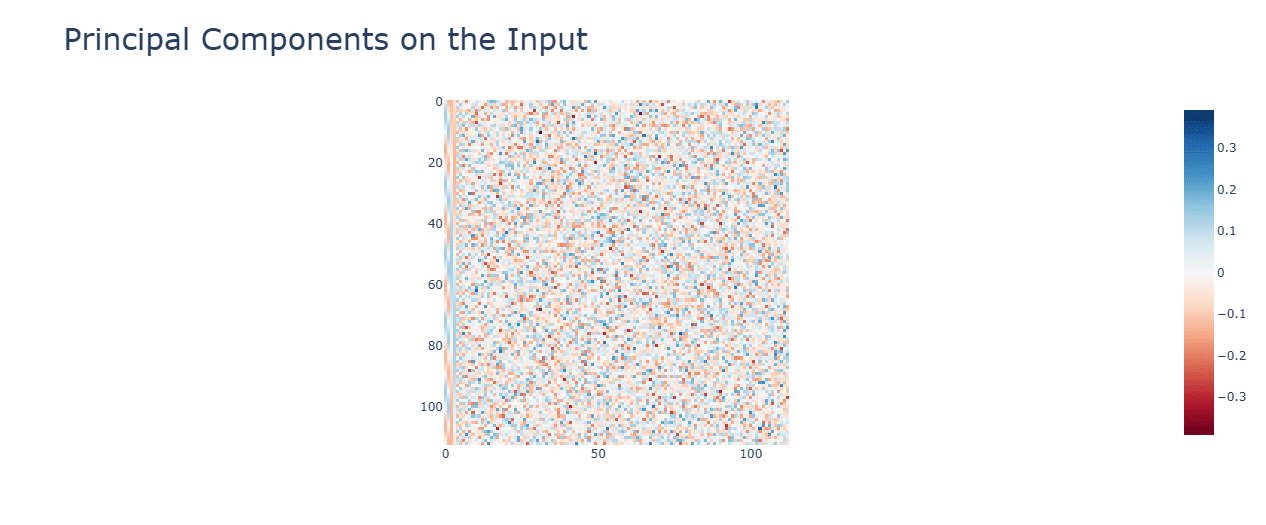
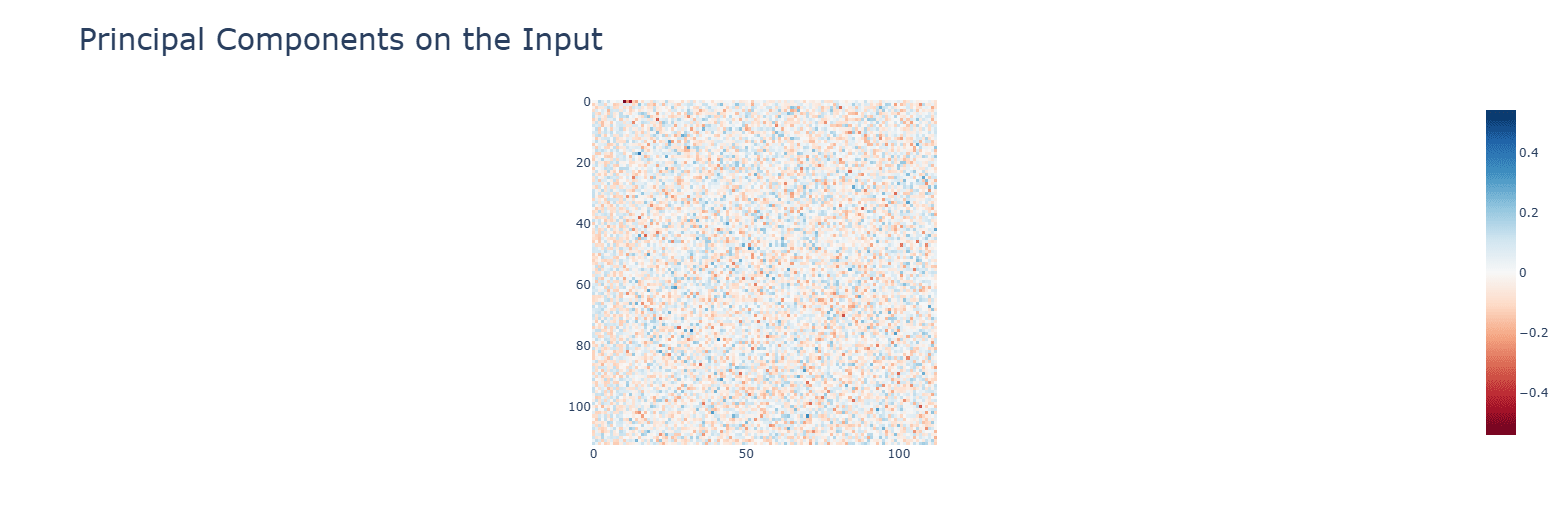
Multiplication has smaller values for the principal components. with a single concentrated term.


Activation functions
Specific observations for the activation functions (ReLU, the three GELUs, SiLU, SoLU with LayerNorm) - they apply for all operations unless otherwise specified:
- GELU variants (gelu_fast, gelu_new) grok very slightly later than GELU. Besides that, no other relevant differences (all discussions will be about the standard GELU from this point on).
LN messes up the activations and delays grokking severely, but otherwise the same algorithm is implemented.
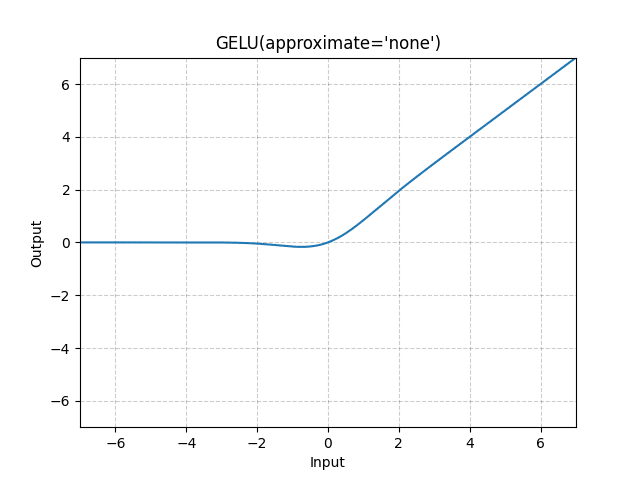
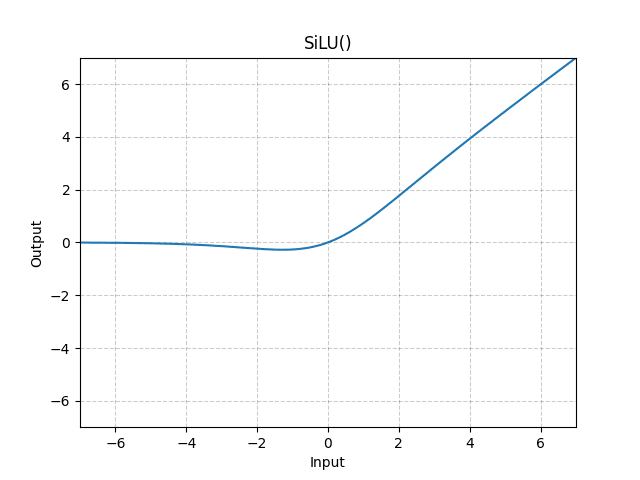
SiLU (top) and especially GELU (bottom) hasten grokking.
Discussion: Could the greater freedom afforded by the structure of the functions, smoothness and quadratic aspect help the Fourier circuit formation (or the non-Fourier of multiplication)?
For addition, GELU has a large spike in testing loss before the cleanup phase. For subtraction, this appears during memorisation.
Discussion: This is likely related to the negative values – they need more sorting out during cleanup than for ReLU, which does not deal with them, but are necessary for subtraction and thus appear during memorisation.SiLU makes memorization take longer. GELU, despite being similar, does not.
Discussion: Perhaps limiting the negative values that give outputs different from 0 is relevant here (GELU is softly capped at -1, SiLU at -2).
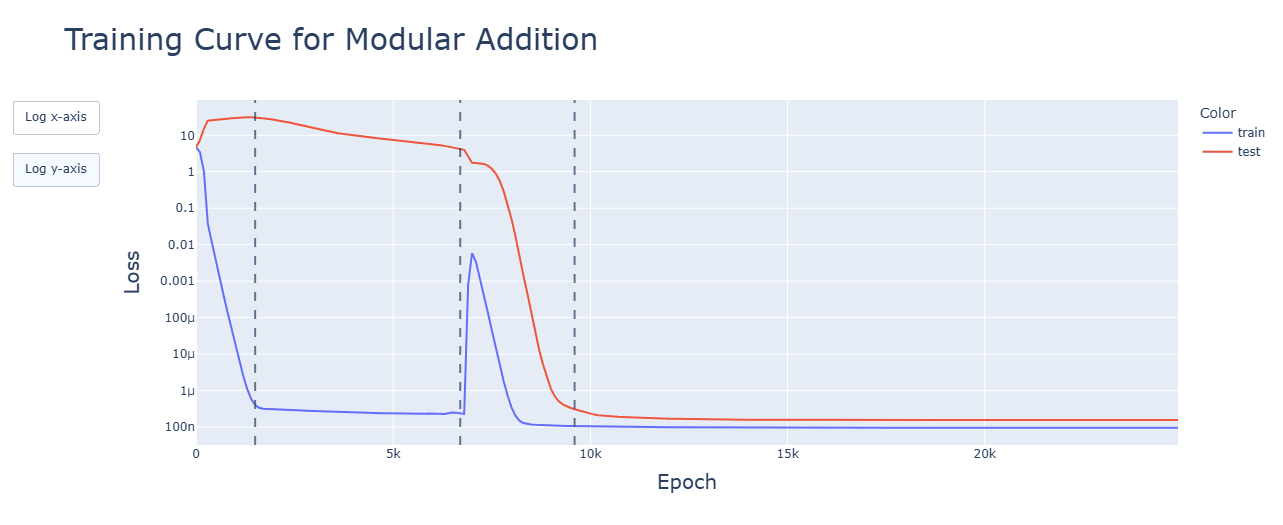
For addition, SiLU gives large jittery spikes and increasing test loss during the circuit formation phase. For subtraction and multiplication, this appears during memorisation.
Discussion: Similar reasons to the above might apply. For SiLu, the slingshot effect might be in play with the large spikes, but why it does not happen to GELU is confusing. This may require further research.SoLU gives large spikes after cleanup is done (slingshot effect?).
SoLU subtraction has interesting diagonal patterns for neuron activations. Some are negative.
SoLU weakly encourages constant frequencies, perhaps needed to smooth the transition beyond LN.
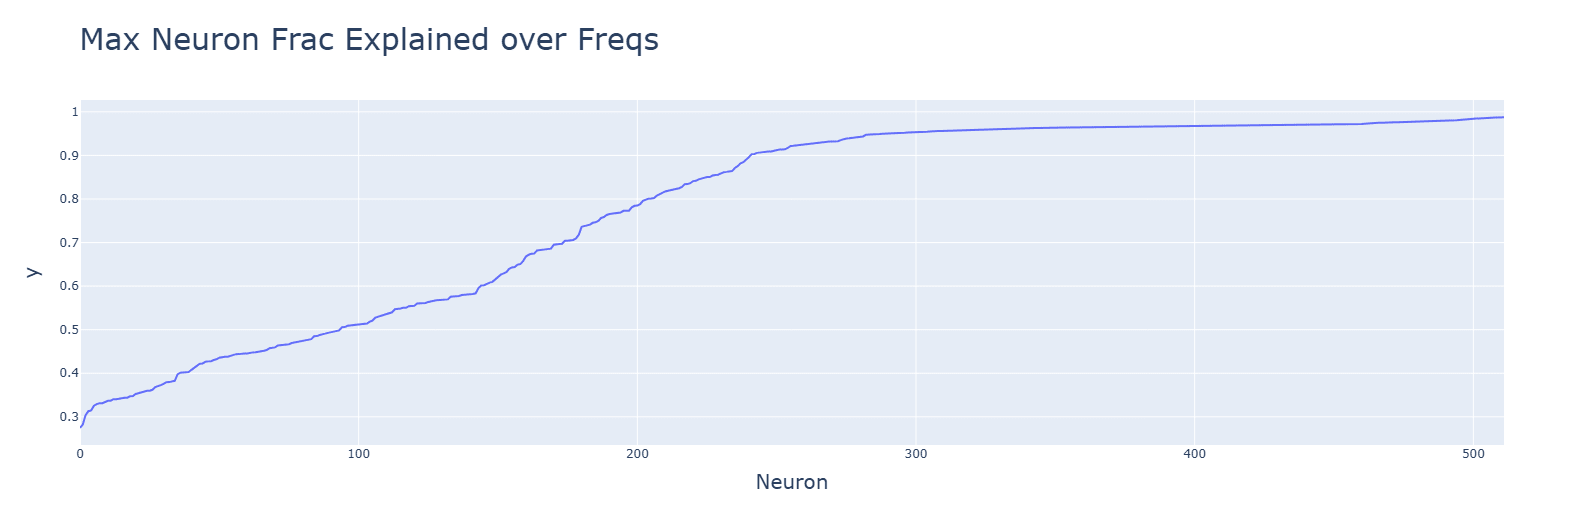
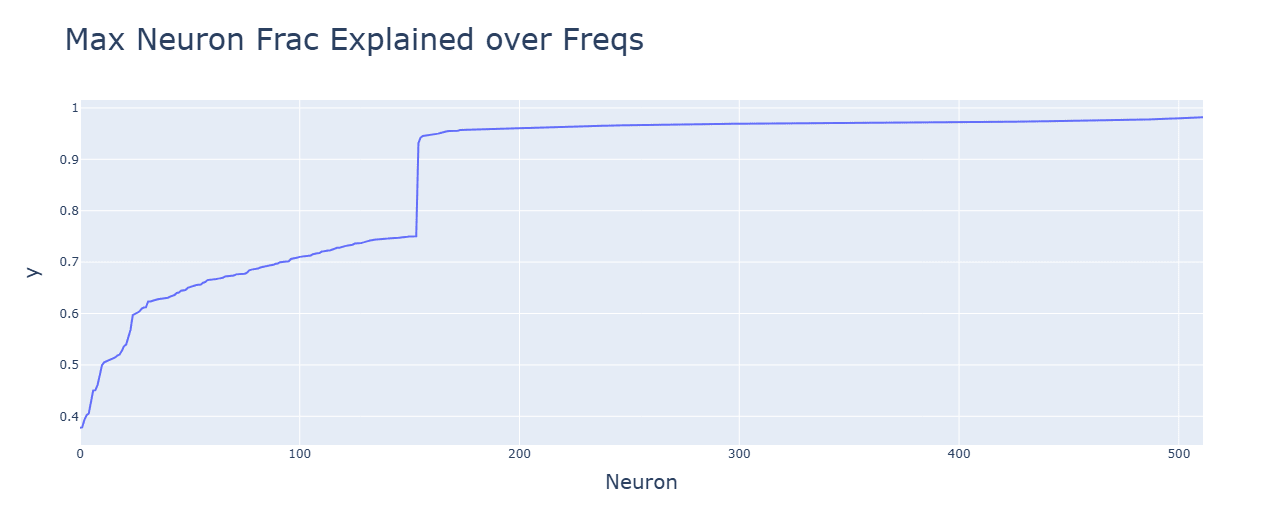
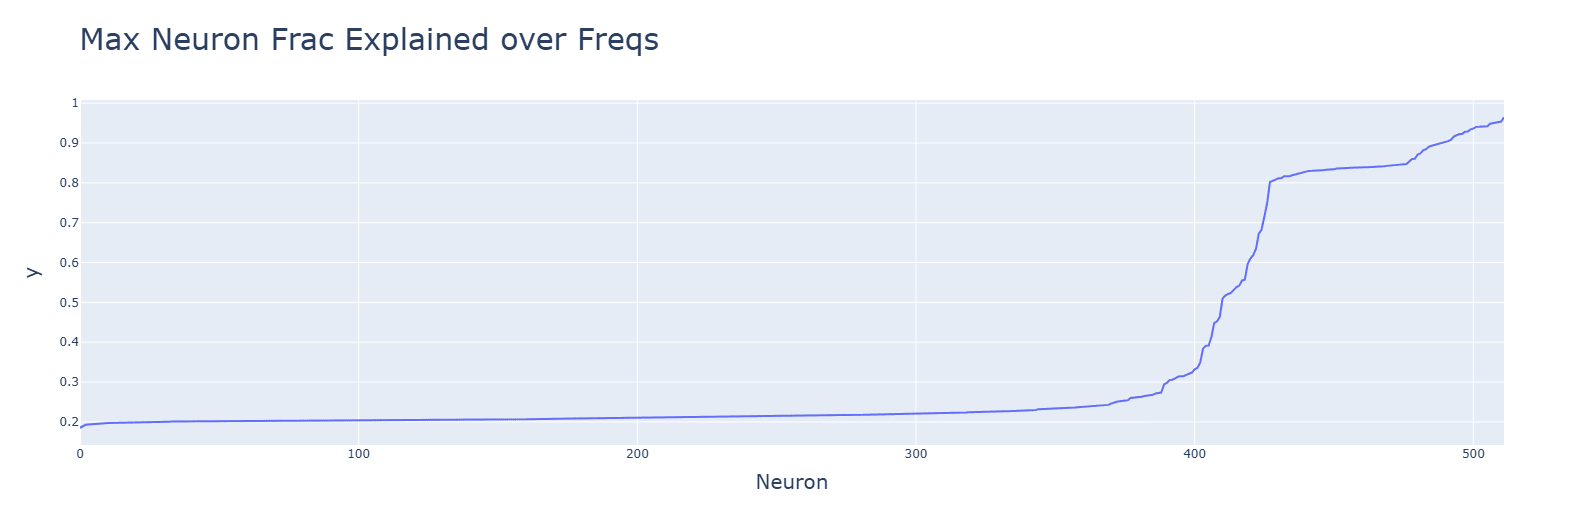
GELU (bottom) has tighter singular values and makes more neurons explained by the frequencies.
Discussion: Its smoother, quadratic nature likely helps the Fourier algorithm.
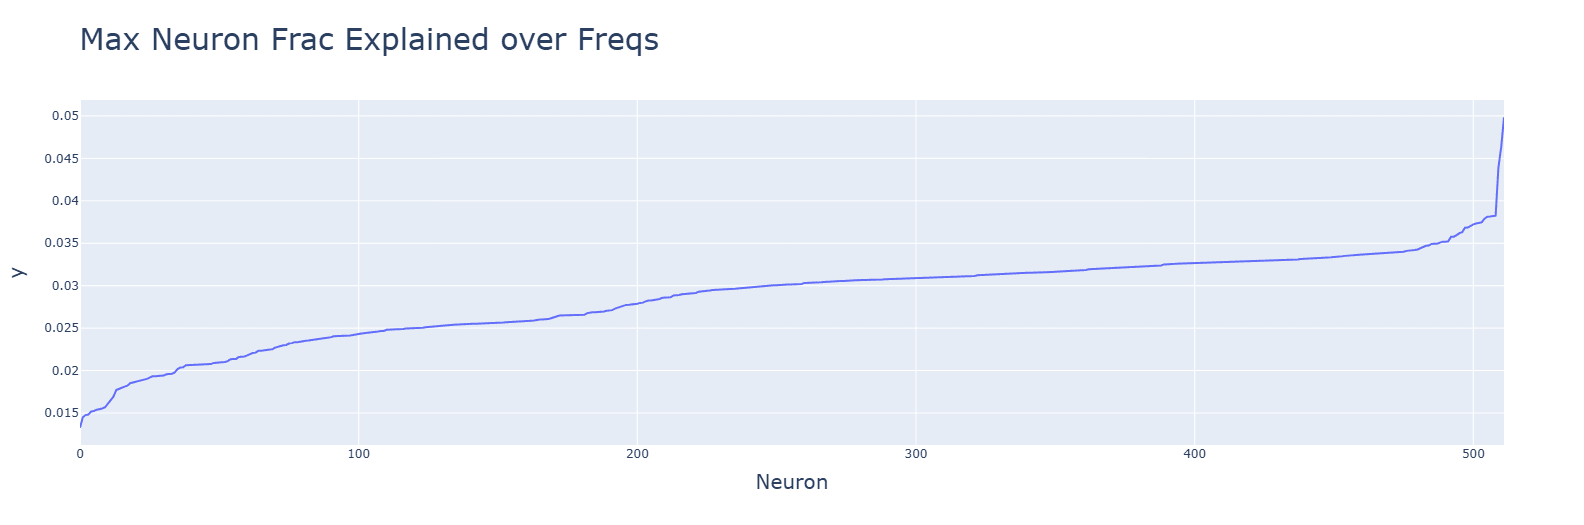
Neurons for SoLU (top) and especially of multiplication (bottom) are poorly explained by the frequencies.
Discussion: Deviations from the Fourier algorithm are to blame.
GELU (bottom) reduces the residual loss. It seems to help pick out better frequencies than ReLU (top).


Discussion
Checking if the modular addition Fourier-based algorithm appears for other simple arithmetic operations is a small test of universality. Extending the work to other activation functions used in transformers is similar.
GELU hastens grokking, though it makes the process messier. The quadratic, smooth, negative aspect of the function is a large help in forming circuits.
That multiplication does not use the Fourier algorithm is a problem for universality, though the fact that NNs can do multiplication innately means this is likely not an issue or relevant bits of evidence against it.
Other interpretability hypotheses are untouched by this. We also have yet another confirmation that LN hinders interpretability.
Conclusion
Multiplication does not use a Fourier algorithm, and GELU helps grokking. More research might be needed for multiplication and its algorithm.
Acknowledgements
I would like to thank the wonderful Neel Nanda et al. for starting this research direction, establishing its methods, and writing the relevant code.
- ^
The graphs are for ReLU, though these observations apply to all functions. Graphs are, in order: addition, subtraction, multiplication.
13 comments
Comments sorted by top scores.
comment by Gurkenglas · 2025-02-26T13:59:54.325Z · LW(p) · GW(p)
Some of these plots look like they ought to be higher resolution, especially when Epoch is on the x axis. Consider drawing dots instead of lines to make this clearer.
Replies from: Rareș Baron↑ comment by Rareș Baron · 2025-02-26T14:12:41.086Z · LW(p) · GW(p)
I will keep that in mind for the future. Thank you!
I have put all high-quality .pngs of the plots in the linked Drive folder.
↑ comment by Gurkenglas · 2025-02-26T22:30:06.332Z · LW(p) · GW(p)
...what I meant is that plots like this look like they would have had more to say if you had plotted the y value after e.g. every epoch. No reason to throw away perfectly good data, you want to guard against not measuring what you think you are measuring [LW · GW] by maximizing the bandwidth between your code and your eyes. (And the lines connecting those data points just look like more data while not actually giving extra information about what happened in the code.)
Replies from: Rareș Baron↑ comment by Rareș Baron · 2025-02-27T15:10:11.988Z · LW(p) · GW(p)
Apologies for misunderstanding. I get it now, and will be more careful from now on.
I have re-run the graphs where such misunderstandings might appear (for this and a future post), and added them here. I don't think I have made any mistakes in interpreting the data, but I am glad to have looked at the clearer graphs.
Thank you very much!
Replies from: Gurkenglas↑ comment by Gurkenglas · 2025-02-27T15:53:24.881Z · LW(p) · GW(p)
I'm glad that you're willing to change your workflow, but you have only integrated my parenthetical, not the more important point. When I look at https://res.cloudinary.com/lesswrong-2-0/image/upload/f_auto,q_auto/v1/mirroredImages/tzkakoG9tYLbLTvHG/lelcezcseu001uyklccb, I see interesting behavior around the first red dashed line, and wish I saw more of it. You ought to be able to draw 25k blue points in that plot, one for every epoch - your code already generates that data, and I advise that you cram as much of your code's data into the pictures you look at as you reasonably can.
Replies from: Rareș Baron↑ comment by Rareș Baron · 2025-02-27T18:58:02.663Z · LW(p) · GW(p)
I am sorry for being slow to understand. I hope I will internalise your advice and the linked post quickly.
I have re-done the graphs, to be for every epoch. Very large spikes for SiLU were hidden by the skipping. I have edited the post to rectify this, with additional discussion.
Again, thank you (especially your patience).
Replies from: Gurkenglas↑ comment by Gurkenglas · 2025-02-28T12:43:43.496Z · LW(p) · GW(p)
Having apparently earned some cred, I will dare give some further quick hints without having looked at everything you're doing in detail, expecting a lower hit rate.
- Have you rerun the experiment several times to verify that you're not just looking at initialization noise?
- If that's too expensive, try making your models way smaller and see if you can get the same results.
- After the spikes, training loss continuously increases, which is not how gradient descent is supposed to work. What happens if you use a simpler optimizer, or reduce the learning rate?
- Some of your pictures are created from a snapshot of a model. Consider generating them after every epoch, producing a video; this way increases how much data makes it through your eyes.
↑ comment by Rareș Baron · 2025-03-06T11:14:08.719Z · LW(p) · GW(p)
For 1 and 2 - I have. Everything is very consistent.
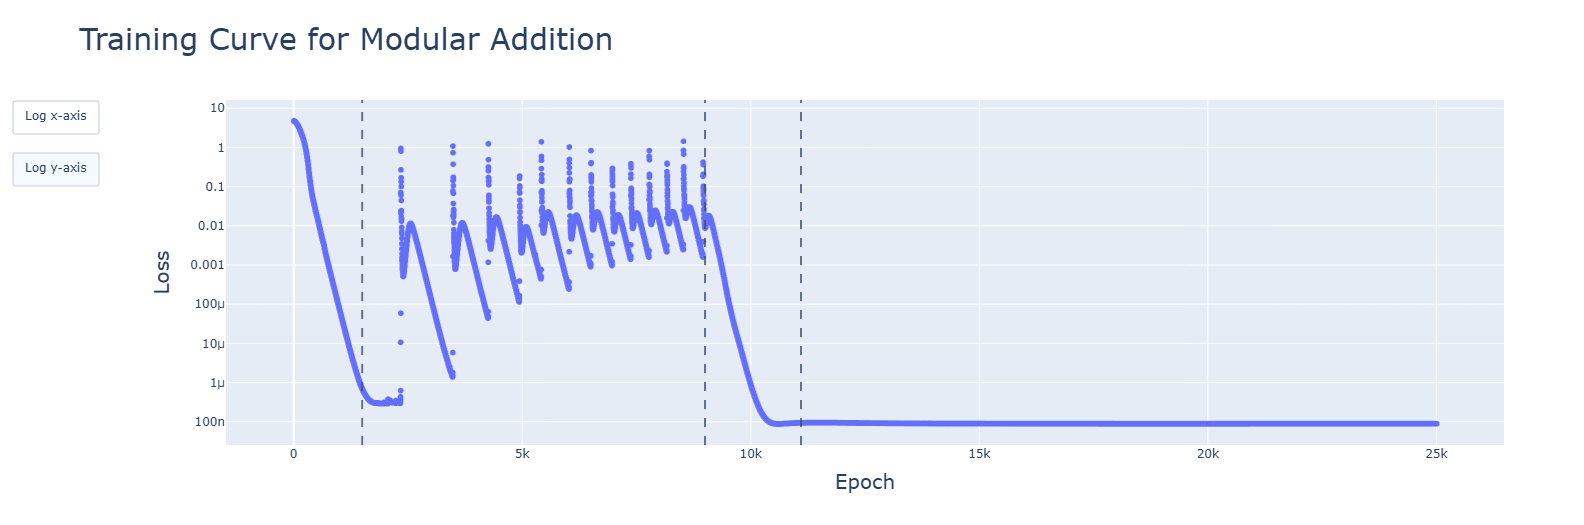
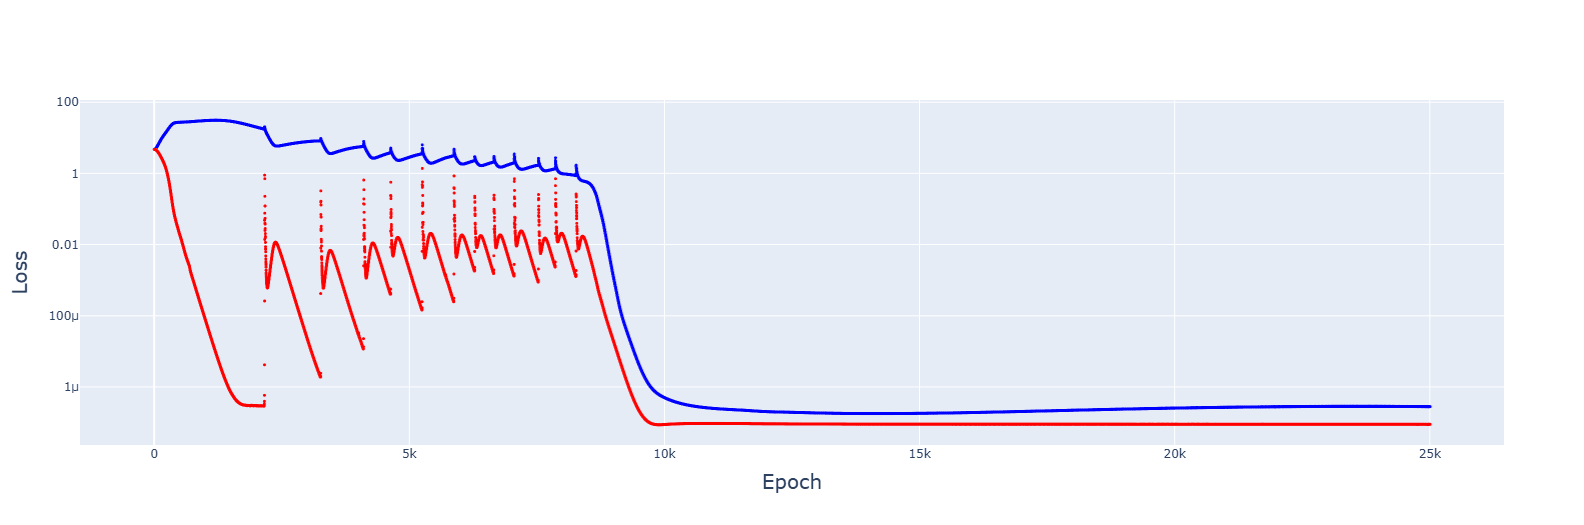
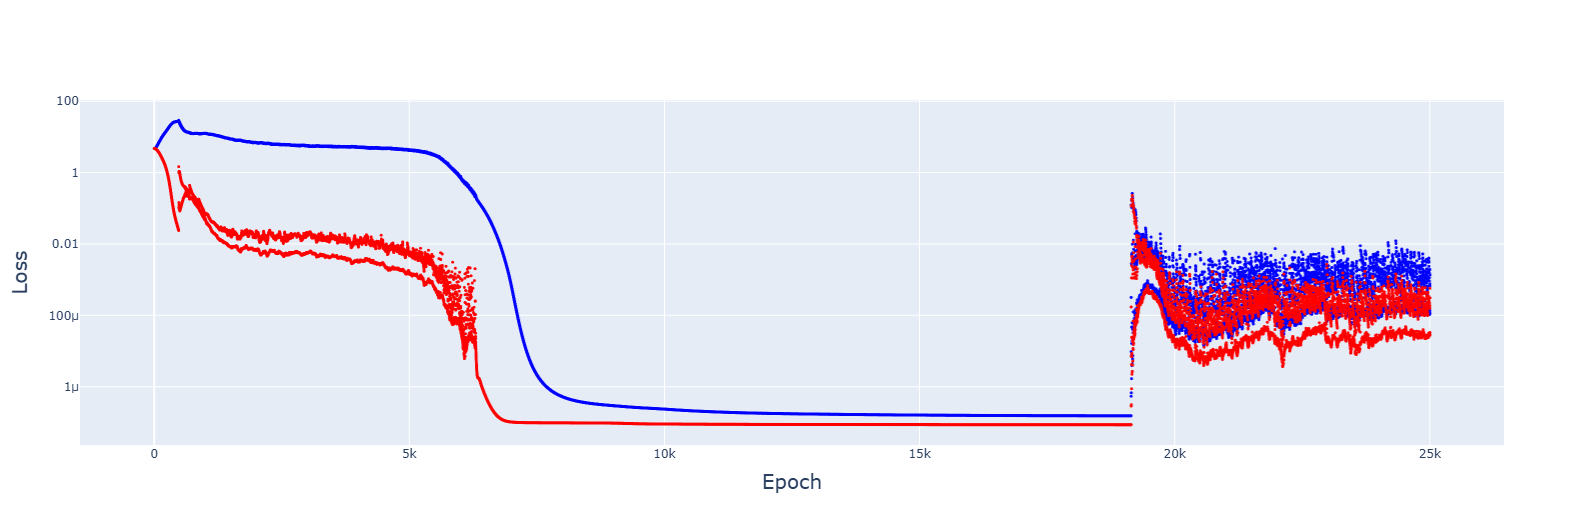
For 3, I have tried several optimizers, and they all failed to converge. Tweaking the original AdamW to reduce the learning rate lead to very similar results:
For 4, I have done animations for every model (besides the 2 GELU variants). I saw pretty much what I expected: a majority of relevant developments (fourier frequencies, concentration of singular values, activations and attention heads) happened quickly, in the clean-up phase. The spikes seen in SiLU and SoLU_LN were visible, though not lasting. I have uploaded the notebooks to the drive folder, and have updated the post to reflect these findings. Thank you very much, again!
↑ comment by Gurkenglas · 2025-03-06T12:06:49.865Z · LW(p) · GW(p)
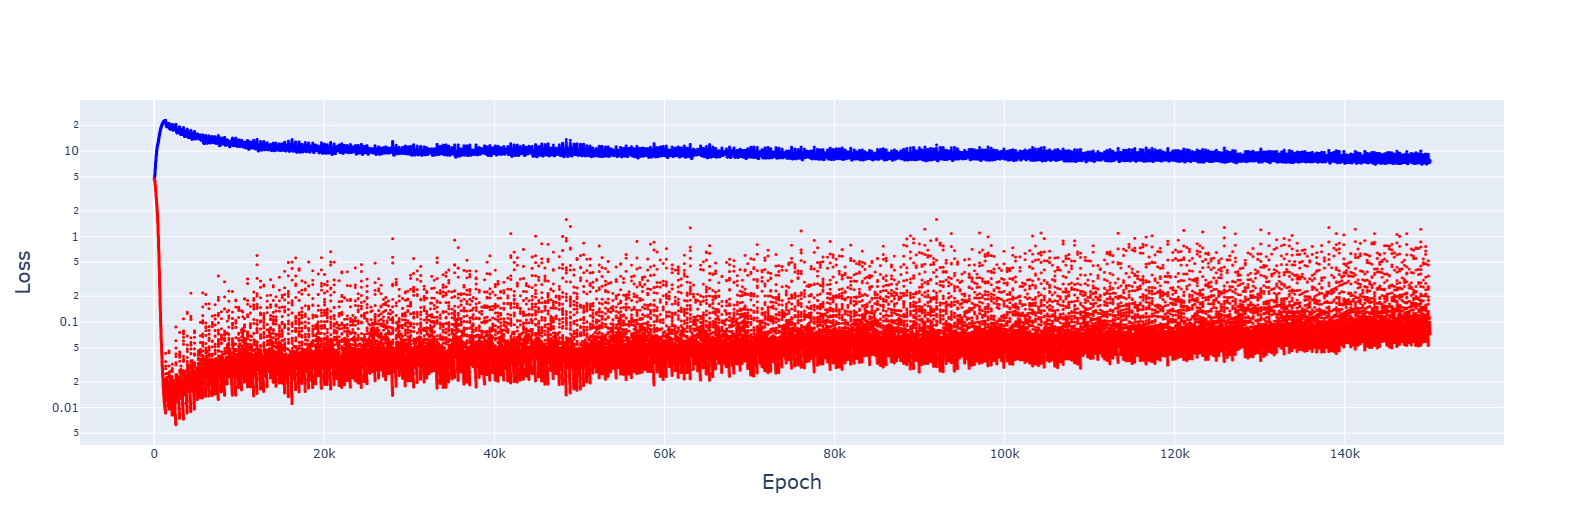
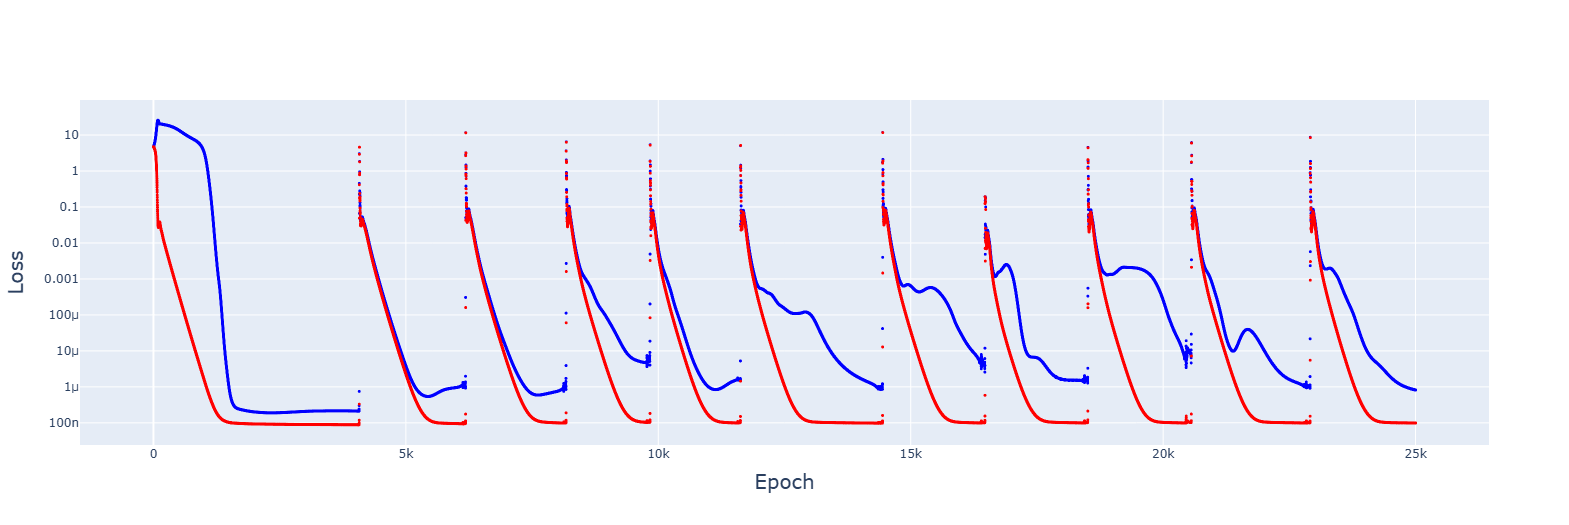
My eyes are drawn to the 120 or so downward tails in the latter picture; they look of a kind with the 14 in https://39669.cdn.cke-cs.com/rQvD3VnunXZu34m86e5f/images/2c6249da0e8f77b25ba007392087b76d47b9a16f969b21f7.png/w_1584. What happens if you decrease the learning rate further in both cases? I imagine the spikes should get less tall, but does their number change? Only dot plots, please, with the dots drawn smaller, and red dots too on the same graph.
I don't see animations in the drive folder or cached in Grokking_Demo_additional_2.ipynb (the most recent, largest notebook) - can you embed one such animation here?
Replies from: Rareș Baron↑ comment by Rareș Baron · 2025-03-07T13:36:27.859Z · LW(p) · GW(p)
I have uploaded html files of all the animation so they can be interactive. The corresponding training graphs are in the associated notebooks.
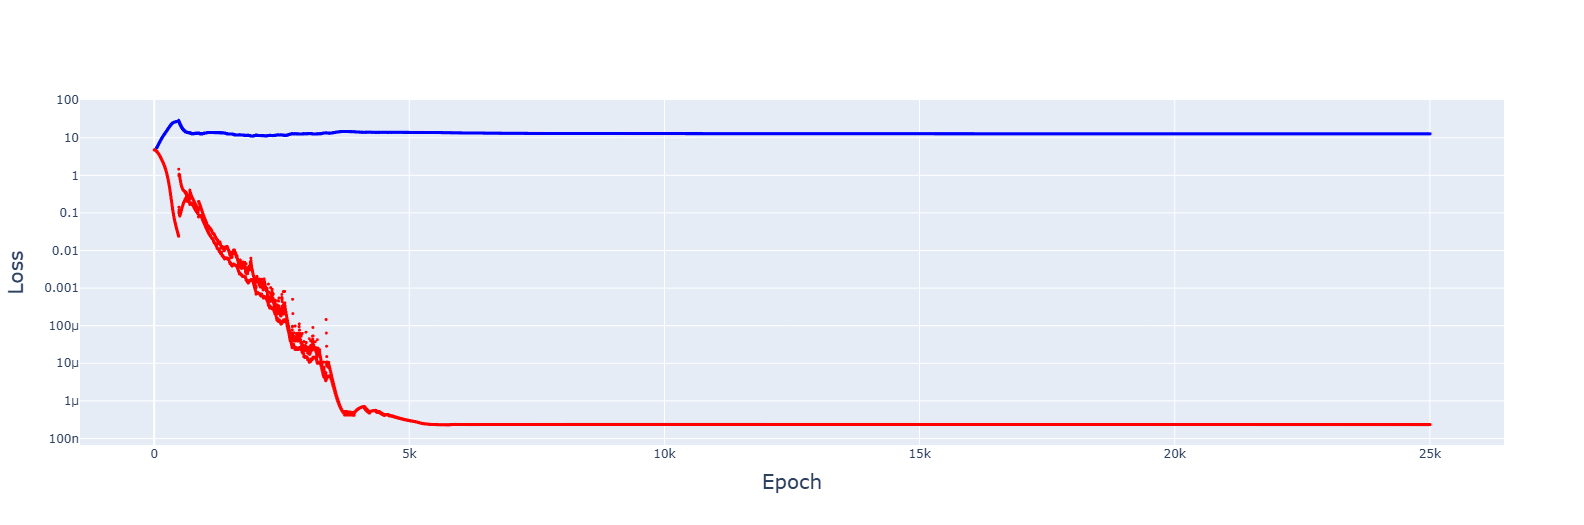
The original learning rate was 1e-3.
For 5e-4, it failed to converge:
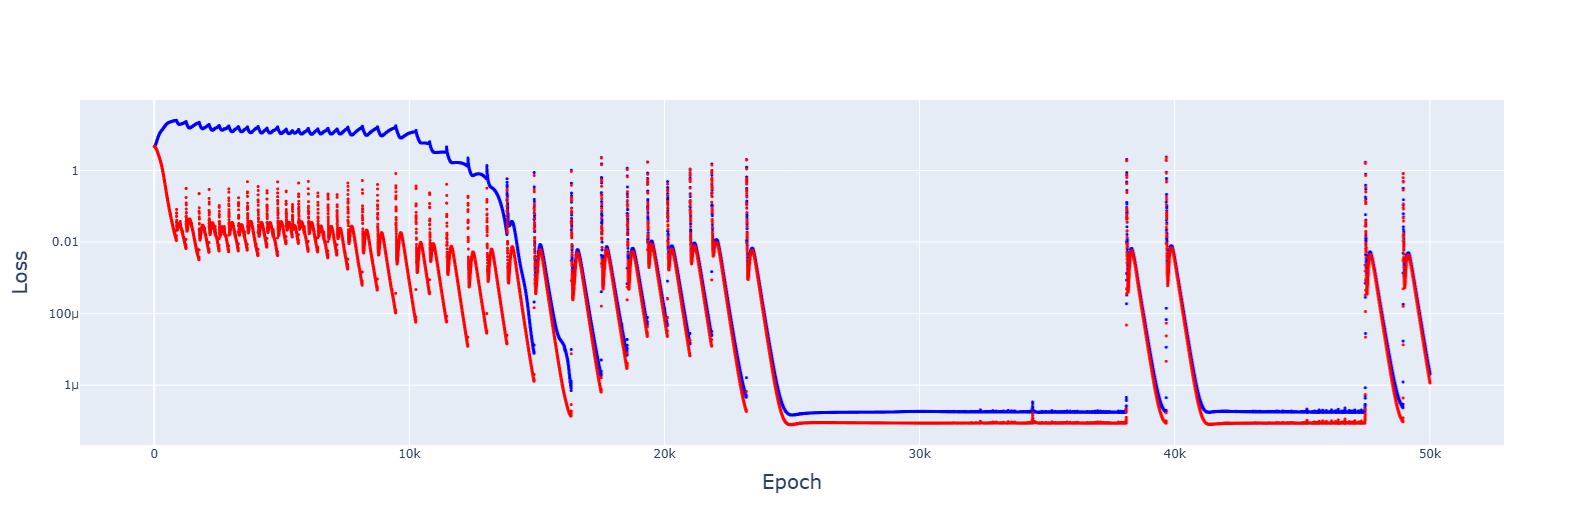
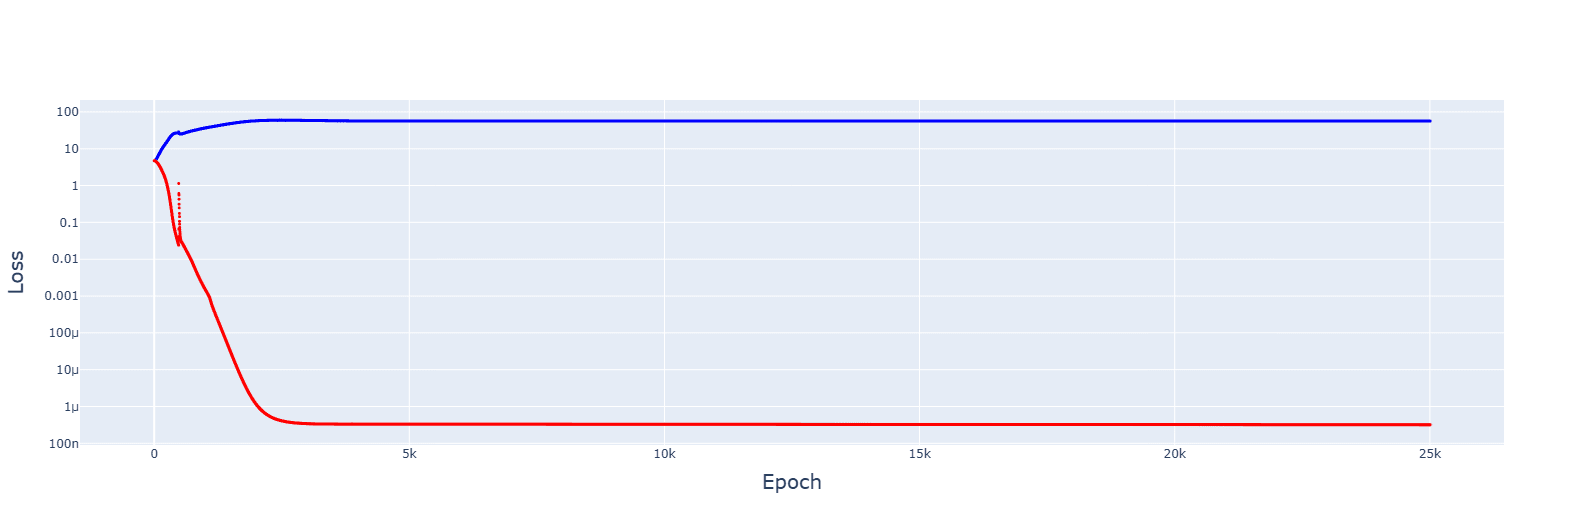
For 8e-4, it did converge, and the trajectory was downwards this time:

↑ comment by Gurkenglas · 2025-03-08T11:11:35.485Z · LW(p) · GW(p)
Oh, you're using AdamW everywhere? That might explain the continuous training loss increase after each spike, with AdamW needing time to adjust to the new loss landscape...
Lower learning rate leads to more spikes? Curious! I hypothesize that... it needs a small learning rate to get stuck in a narrow local optimum, and then when it reaches the very bottom of the basin, you get a ~zero gradient, and then the "normalize gradient vector to step size" step is discontinuous around zero.
Experiments springing to mind are:
1. Do you get even fewer spikes if you increase the step size instead?
2. Is there any optimizer setup at all that makes the training loss only ever go down?
2.1. Reduce the step size whenever an update would increase the training loss?
2.2. Use gradient descent instead of AdamW?
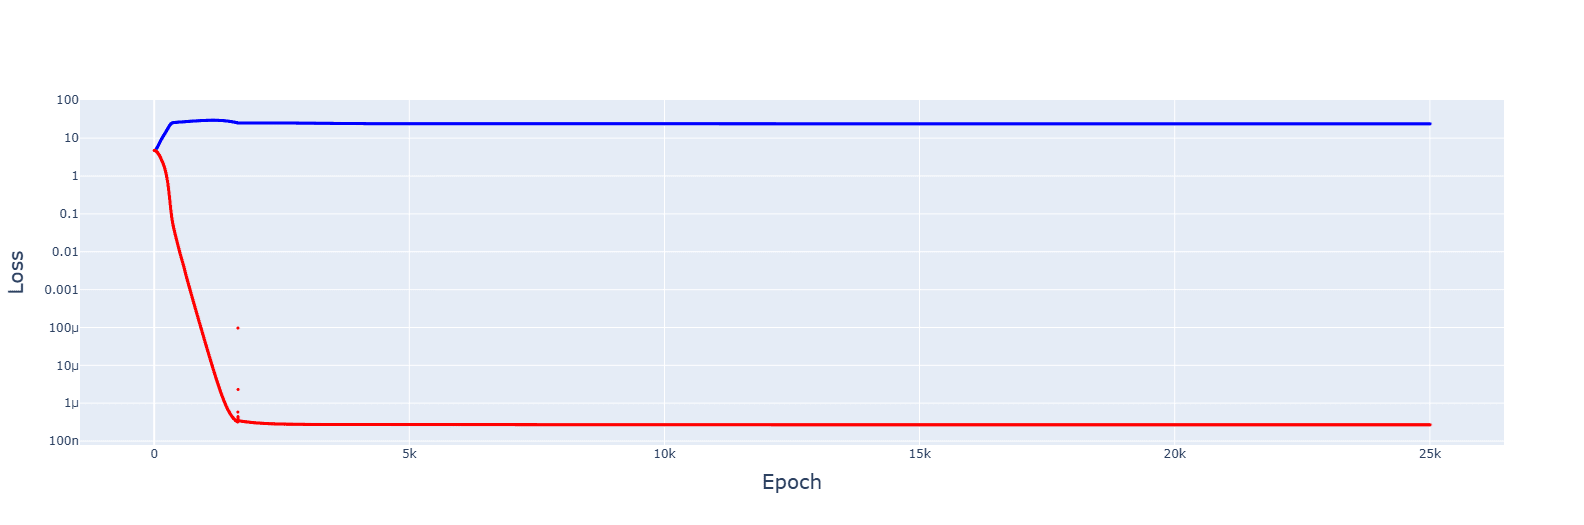
↑ comment by Rareș Baron · 2025-03-08T17:12:15.709Z · LW(p) · GW(p)
Your hypothesis seems reasonable, and I think the following proves it.
1. This is for 5e-3, giving no spikes and faster convergences:
2. Gradient descent failed to converge for multiple LRs, from 1e-2 to 1e-5. However, decreasing the LR by 1.0001 when the training error increases gave this:
It's messy, and the decrease seems to turn the jumps of the slingshot effect into causes for getting stuck in sub-optimal basins, but the trajectory was always downwards. Increasing the rate of reduction decreased spikes but convergence no longer appeared.
An increase to 2. removed the spikes entirely.
↑ comment by Rareș Baron · 2025-03-08T17:10:39.184Z · LW(p) · GW(p)
Your hypothesis seems reasonable, and I think the following proves it.
1. This is for 5e-3, giving no spikes and faster convergences:
2. Gradient descent failed to converge for multiple LRs, from 1e-2 to 1e-5. However, decreasing the LR by 1.0001 when the training error increases gave this:
It's messy, and the decrease seems to turn the jumps of the slingshot effect into causes for getting stuck in sub-optimal basins, but the trajectory was always downwards. Increasing the rate of reduction decreased spikes but convergence no longer appeared.
An increase to 2. removed the spikes entirely.