[UPDATED] COVID-19 cabin secondary attack rates on Diamond Princess
post by Bucky · 2020-03-18T22:36:06.099Z · LW · GW · 5 commentsContents
  Introduction
  Data
  Method
  Results
  Discussion
  Conclusion
None
5 comments
Update 19/03/20: Inspired by johnswentworth's comment [LW(p) · GW(p)], I implemented a multinomial distribution on the 4-berth cabin result. Taking this additional information into account the model shows reduced likelihood of secondary attack rates of >0.9.
Introduction
Jimrandomh recently showed [LW · GW] how we have no real idea about the household secondary attack rates of COVID-19.
The Diamond Princess data showed that the proportion of passengers infected with COVID-19 increased with cabin occupancy.
It occurred to me that this data could be used to infer the cabin secondary attack rates.
Data
I eyeballed the data in figure 2 in the report linked above.
There were 6 COVID-19 cases in single passenger cabins which looks like ~8% infection rate so there were ~75 passengers in single cabins.
For double cabins the numbers are 485/2425 = 20%.
For triple cabins 27/129 = 21%.
For 4-berth 18/60 = 30%.
(all numbers are per person, rather than per cabin)
These numbers add up to 2,689 total passengers which is slightly more than 2,646 actually included but this is close as eyeballing is likely to get me.
Method
I implemented a model with 2 variables:
1. The background rate of infection without sharing a cabin (just from being on the ship).
2. An additional rate of infection for each infected person an individual shared a cabin with.
Given those two variables I was able to create predicted infection rates for each size of cabin by calculating the probability of the number of initial cases in a cabin (before secondary attack) and then the probability of each result after applying secondary attacks.
I created 2 models, one where I only included secondary attack and another where the victim of the secondary attack could in turn cause a tertiary attack on any remaining healthy members of the cabin. Tertiary attack may not have been possible (or somewhat suppressed) by the quarantine and/or other factors.
Importantly the secondary attack rate as used by me here is “probability of contracting COVID-19 for each person in the cabin who had COVID-19”. So if you live with 2 infected people then you have a higher probability of contracting than if you just lived with 1. In 4-berth cabins having even one person infected gives a high probability of at least one of the remaining people being infected at which point the other 2 have a higher chance (when allowing for tertiary attack).
Even with a relatively low attack rate per person, it ends up being likely that many people in a 4-berth cabin will end up infected. For instance with a 0.3 secondary attack rate there is a >30% chance of all 4 people getting it from a single incoming case. A 0.5 secondary attack rate brings this up to >70% chance
These models were used to create likelihoods for the results actually witnessed via a binomial distribution.
As this model isn’t computationally expensive I just brute-force calculated the likelihood over a number of possible values of the 2 variables. I then integrated across the background rate to give the likelihood function of the secondary attack rate.
Results
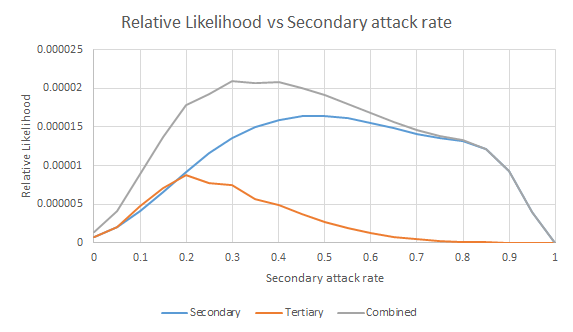
The likelihoods of the secondary attack rates for the two models are shown in the figure below. I’ve also included a combined likelihood based on equal confidence in both models.
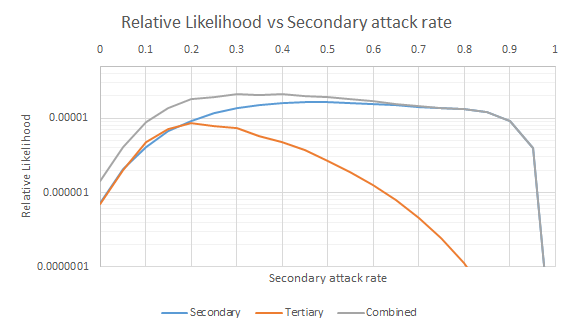
And on a log axis:
This is slightly frustrating – there is a large range of secondary attack rates which fit the data adequately.
The most noticeable thing is that a very low secondary attack rate appears to be ruled out. Only 7% of the likelihood is below 0.15 and 3% below 0.1. This goes against the results from the papers analysed in jimrandomh's post (0.1 and 0.15)
The large range of possible values is caused in large part by the relatively small sample size for all except 2-berth cabins.
Discussion
There are some potential confounders here, for instance 2-berth cabins are probably mainly couples whereas 4 berth are relatively more likely to include children. I don't expect these effects to be very large (couples and their children will all have close contact) but hopefully someone will point out any potential larger confounders in the comments if there are any.
It is also not certain that cabin secondary attack rates convert directly to household secondary attack rates although my personal expectation is that they wouldn't be too far off.
Most of these secondary attack values are very bad news for larger households. Plenty of presymptomatic transmission [LW · GW] means that if one person gets it then at least one more person will likely get it before anyone is aware that they have. So if someone does become symptomatic then isolating from each other is likely to be as important as being careful around the patient.
Isolating from each other when no-one has symptoms is likely a very costly exercise as it would need to be maintained for months but the bigger the household the more benefit is to be gained from taking care.
My impression from looking at the virus growth rate data from various countries is that massively improving hygiene and implementing social distancing can increase the doubling time by a factor of 2 (I hope to write this up in the coming days). If it can similarly halve secondary attack rate then this could be hugely important in large households to prevent a single case infecting the entire house.
Note that as jimrandomh said, leaving a household with a sick patient in order to avoid contracting COVID-19 is a bad idea.
If people tried to move out when their housemates got sick, they wouldn't lower their own risk much, but they would spread it wherever they moved to.
Conclusion
Cabin secondary attack rates of COVID-19 on the Diamond Princess were not able to be confirmed precisely. It is unlikely that the rate was very low (<0.2) and as a result additional infections are likely, especially in larger cabins.
If this can be extrapolated to households then particularly larger households may struggle to prevent additional infections after the first household member is infected.
5 comments
Comments sorted by top scores.
comment by jimrandomh · 2020-03-19T01:22:56.007Z · LW(p) · GW(p)
Thank you, this is exactly the sort of clever analysis I was hoping people would come up with when I wrote my post.
This site has floor-plan images of Diamond Princess cabins, from which we can make a few inferences about cabin occupancy. Most of the cabin layouts contain a single bed which fits two people, so two-person cabins will almost exclusively couples sharing a bed. If I assume the rate at which people in single-person cabins get infected (8%) is the rate of infection outside the cabin, and that the higher rate of infection in two-person cabins is caused entirely by within-cabin secondary transmission, then it looks like each person would have to infect their partner an average of 1.5 times each. This also tells us that the transmission rate between elderly couples sharing a bed is likely to be extremely high, and also that people in single-person cabins must be different in some way--perhaps they spent less time in the ship's common areas.
Three- and four-person cabins seem harder to interpret. These would originally have been couples with children, but there aren't many children aboard as of Feb 5th, and they probably moved people around to free up single cabins for extra-vulnerable people and for confirmed cases that they needed to isolate.
Replies from: Bucky↑ comment by Bucky · 2020-03-19T10:30:41.241Z · LW(p) · GW(p)
If I assume the rate at which people in single-person cabins get infected (8%) is the rate of infection outside the cabin, and that the higher rate of infection in two-person cabins is caused entirely by within-cabin secondary transmission, then it looks like each person would have to infect their partner an average of 1.5 times each. This also tells us that the transmission rate between elderly couples sharing a bed is likely to be extremely high, and also that people in single-person cabins must be different in some way--perhaps they spent less time in the ship's common areas.
This was my original thought too. However, as the 8% is based on only 6 positive cases it isn't a very precise figure.
As an example, the maximum likelihood for any pair of variables for my models comes at background infection rate of 0.133, secondary attack rate=0.55 with no tertiary attack (I didn't mention this in the OP for fear of people taking the 0.55 to be especially relevant). In this case the probability of getting 6 or fewer infections in 1-berth cabins would be 0.11 - unlikely but not massively so.
The corresponding probabilities for 2, 3 and 4-berth cabins are 0.68, 0.14 and 0.50. Those 4 numbers seem fairly random, suggesting that there's no need to stipulate base rates which vary based on cabin size to explain the data.
In truth I suspect that there may be differences in the base rate between cabin sizes but wouldn't have known in advance which size would have had a higher base rate. With only 4 data points even using 2 variables in the model is pushing it - if I used anymore I could have explained almost anything!
***
Edit: Section below is no longer endorsed
Regarding the effect of quarantine measures, only 115 of the 536 passenger infections analysed had onset after the quarantine started. Figure 1 here suggests to me that almost all of the infections occurred before quarantine and onset was delayed by incubation period.
comment by johnswentworth · 2020-03-20T17:33:41.875Z · LW(p) · GW(p)
I went back-and-forth with Bucky a bit, looked at the formulas, and I now think the current graph is correct. The main surprising thing was that the likelihood isn't sharper; apparently there's actually pretty few 1-berth cabins, so we don't have a sharp estimate for the background infection rate. Most of the uncertainty in the secondary rate is tightly coupled to the uncertainty in the background rate.
comment by johnswentworth · 2020-03-18T23:00:06.861Z · LW(p) · GW(p)
That graph looks fishy. Wouldn't a secondary attack rate of 1 mean that everyone in a cabin with someone sick catches it immediately? Shouldn't that be deterministically ruled out by the data, and therefore have exactly-zero likelihood?
Also, in general, seeing likelihood graphed on a linear scale makes me think something is very wrong.
Maybe a bug somewhere?
Replies from: Bucky↑ comment by Bucky · 2020-03-18T23:34:36.243Z · LW(p) · GW(p)
attack rate = 1 within a cabin would be everyone catches it at some point (but not necessarily immediately) provided that someone brings it in in the first place - its a rate per sick person rather than per unit time. I don't have data on whether this is the case although I doubt it.
Technically I suppose having 18 cases in 4-berth cabins does rule that out. My model isn't sophisticated enough to catch something like that - I look at average illness rate as an input to the binomial distribution, I never check whether the total number is likely. Adding that complexity might help narrow down the true secondary attack rate.
I've added a log graph.