GDP per capita in 2050
post by Hauke Hillebrandt (hauke-hillebrandt) · 2024-05-06T15:14:30.934Z · LW · GW · 8 commentsThis is a link post for https://hauke.substack.com/p/gdp-per-capita-in-2050
Contents
8 comments
8 comments
Comments sorted by top scores.
comment by Algon · 2024-05-06T15:47:13.920Z · LW(p) · GW(p)
This looks cool and I want to read it in detail, but I'd like to push back a bit against an implicit take that I thought was present here: namely, that GDP takes into account major technological breakthroughs. Let me just quote some text from this article: What Do GDP Growth Curves Really Mean? [LW · GW]
Replies from: hauke-hillebrandtMore generally: when the price of a good falls a lot, that good is downweighted (proportional to its price drop) in real GDP calculations at end-of-period prices.
… and the way we calculate real GDP in practice is to use prices from a relatively recent year. We even move the reference year forward from time to time, so that it’s always near the end of the period when looking at long-term growth.
Real GDP Mainly Measures The Goods Which Are Revolutionized Least
Now let’s go back to our puzzle about growth since 1960, and electronics in particular.
The cost of a transistor has dropped by a stupidly huge amount since 1960 - I don’t have the data on hand, but let’s be conservative and call it a factor of 10^12 (i.e. a trillion). If we measure in 1960 prices, the transistors on a single modern chip would be worth billions. But instead we measure using recent prices, so the transistors on a single modern chip are worth… about as much as a single modern chip currently costs. And all the world’s transistors in 1960 were worth basically-zero.
1960 real GDP (and 1970 real GDP, and 1980 real GDP, etc) calculated at recent prices is dominated by the things which are expensive today - like real estate, for instance. Things which are cheap today are ignored in hindsight, even if they were a very big deal at the time.
In other words: real GDP growth mostly tracks production of goods which aren’t revolutionized. Goods whose prices drop dramatically are downweighted to near-zero, in hindsight.
When we see slow, mostly-steady real GDP growth curves, that mostly tells us about the slow and steady increase in production of things which haven’t been revolutionized. It tells us approximately-nothing about the huge revolutions in e.g. electronics.
↑ comment by Hauke Hillebrandt (hauke-hillebrandt) · 2024-05-06T16:44:54.123Z · LW(p) · GW(p)
Yeah I actually do cite that piece in the appendix 'GDP as a proxy for welfare [LW · GW]' where I list more literature like this. So yeah, it's not a perfect measure but it's the one we have and 'all models are wrong but some are useful' and GDP is quite a powerful predictor of all kinds of outcomes:
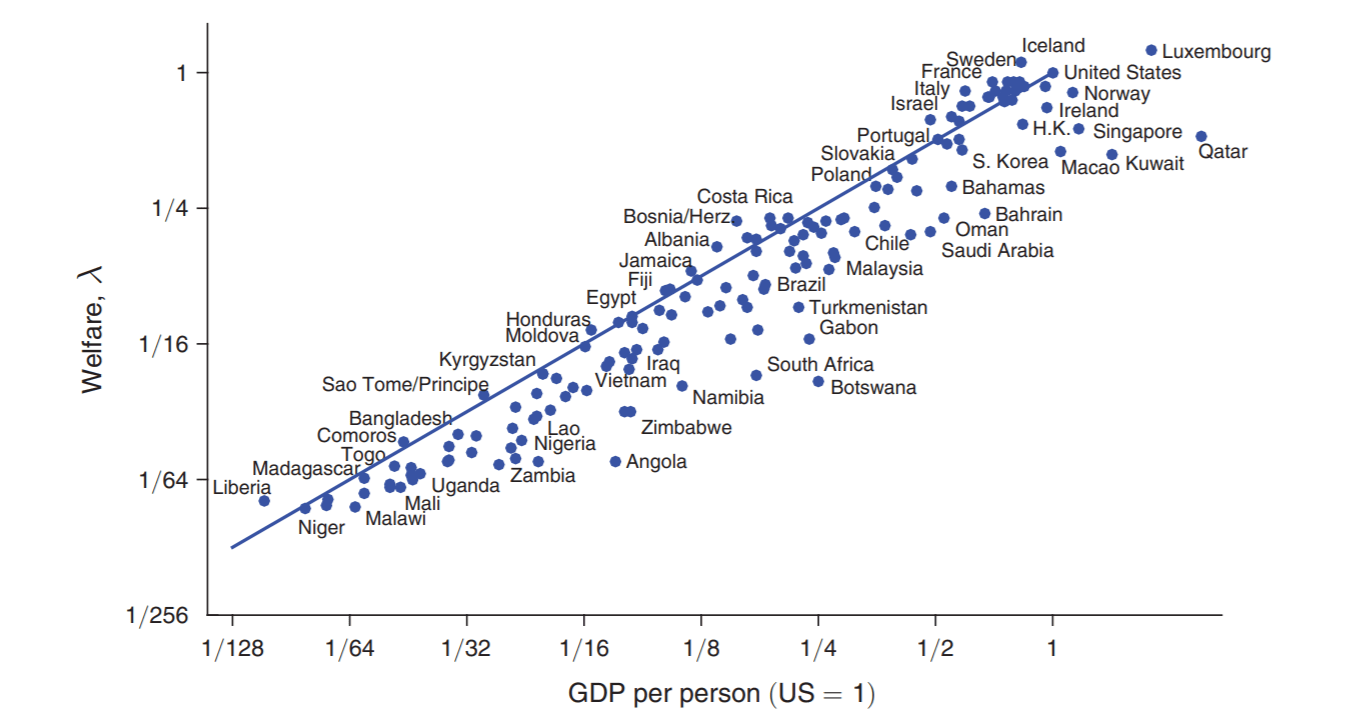
In a 2016 paper, Jones and Klenow used measures of consumption, leisure, inequality, and mortality, to create a consumption-equivalent welfare measure that allows comparisons across time for a given country, as well as across countries.[6]
This measure of human welfare suggests that the true level of welfare of some countries differs markedly from the level that might be suggested by their GDP per capita. For example, France’s GDP per capita is around 60% of US GDP per capita.[7] However, France has lower inequality, lower mortality, and more leisure time than the US. Thus, on the Jones and Klenow measure of welfare, France’s welfare per person is 92% of US welfare per person.[8]
Although GDP per capita is distinct from this expanded welfare metric, the correlation between GDP per capita and this expanded welfare metric is very strong at 0.96, though there is substantial variation across countries, and welfare is more dispersed (standard deviation of 1.51 in logs) than is income (standard deviation of 1.27 in logs).[9]
GDP per capita is also very strongly correlated with the Human Development Index, another expanded welfare metric.[10] If measures such as these are accurate, this shows that income per head explains most of the observed cross-national variation in welfare. It is a distinct question whether economic growth explains most of the observed variation across individuals in welfare. It is, however, clear that it explains a substantial fraction of the variation across individuals.
Replies from: Algon↑ comment by Algon · 2024-05-06T17:22:40.460Z · LW(p) · GW(p)
Although GDP per capita is distinct from this expanded welfare metric, the correlation between GDP per capita and this expanded welfare metric is very strong at 0.96, though there is substantial variation across countries, and welfare is more dispersed (standard deviation of 1.51 in logs) than is income (standard deviation of 1.27 in logs).[9]
I checked the paper and it looks like they're comparing welfare by "how much more would person X from the US have to consume to move to another country i?" Which results in equations like this:
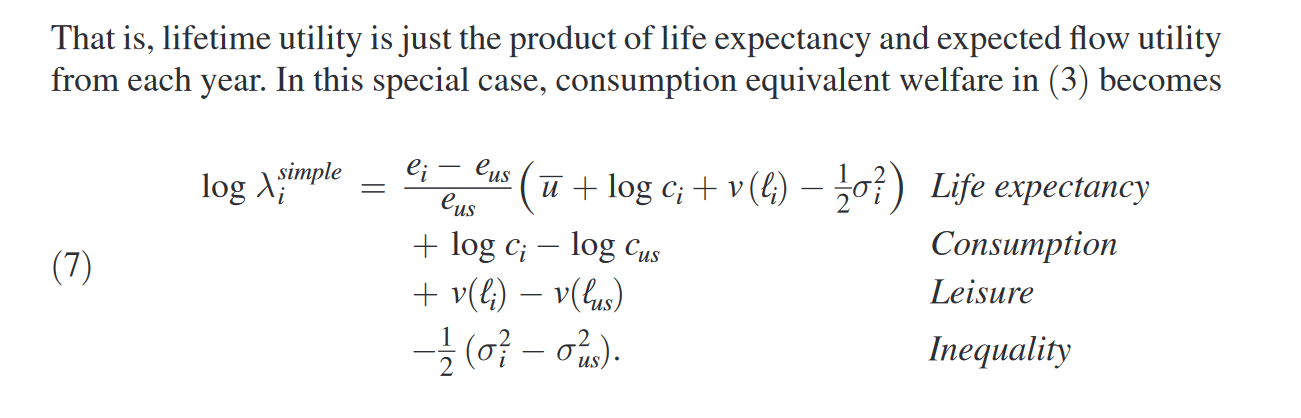
which says what the factor , should be in terms of differences in life expectancy, consumption, lessure and inequality. So I suppose it isn't suprising that it's quite correlated with GDP, given the individual correlations at play here, but I am suprised that it is so strongly correlated since I'd expect e.g. life expectancy vs gdp to correlate at maybe 0.8[1]. Which is a fair bit weaker than a 0.96 correlation!
Replies from: hauke-hillebrandt↑ comment by Hauke Hillebrandt (hauke-hillebrandt) · 2024-05-06T17:44:11.062Z · LW(p) · GW(p)
I checked. It's 0.67.
This seems to come from European countries.
Replies from: Algon↑ comment by Algon · 2024-05-06T18:17:41.448Z · LW(p) · GW(p)
Good point. I grabbed the dataset of gdp per capita vs life expectancy for almost all nations from OurWorldInData, log transformed GDP per capita and got a correlation of 0.85.
comment by AnthonyC · 2024-05-06T22:10:57.678Z · LW(p) · GW(p)
I think there's a good chance the degree to which the world of 2050 looks different to the average person might have very little to do with GDP.
On the one hand, a large chunk of the GDP growth I expect will come from changes in how we produce, distribute, and use energy and chemicals and water and food and steel and concrete etc. But for most people what will mostly feel the same is that their home is warm in winter and cool in summer, and they can get from place to place reasonably easily, and they have machines that do their basic household chores.
On the other hand, something like self-driving cars, or augmented or virtual reality, or 3D printed organs, could be hugely tranaformative for society without necessarily impacting GDP growth much at all.
comment by ChristianKl · 2024-05-06T21:42:30.694Z · LW(p) · GW(p)
Survival vs self-expression: Survival values prioritize security over liberty. Those with survival values tend to be more homophobic, uninterested in political action, distrustful of outsiders, and less happy. As people transition from industrial to knowledge societies, their sense of agency increases and they move towards self-expression values.
To me, the empiric status of that claim feels quite unclear. Is that your personal opinion? Is it a general pattern for which there's existing data?
↑ comment by Hauke Hillebrandt (hauke-hillebrandt) · 2024-05-07T07:27:00.273Z · LW(p) · GW(p)
Yes, good catch, this is based on research from the World Value Survey - I've added a citation.