High Stock Prices Make Sense Right Now
post by johnswentworth · 2020-07-03T20:16:53.852Z · LW · GW · 27 commentsContents
  What About That Formula?
None
27 comments
I’ve been seeing a lot of comments lately about how the financial markets have gone completely wonky, efficient markets hypothesis looks crazy right now, etc. I don’t currently trade actively and haven’t run a lot of numbers, but just in terms of big-picture qualitative behavior, high stock prices make a lot of sense right now. This post is an informal explanation of why.
First, let’s forget about the efficient market price formula (i.e. price = expected sum of discounted future cash flows, ). I’ll talk about that a bit at the end, but it’s so widely and severely misunderstood that I’d need a whole post just to correct misconceptions. Instead, we’ll start from first principles: financial capital is a good, just like any other good. Its price is determined by supply and demand, just like any other good.
When stock prices are high, that means financial capital is cheap for companies: they can get a lot of capital by issuing a lot of stock. High stock price = cheap capital. Likewise with bonds: when bond prices are high, yields are low, meaning companies can borrow capital very cheaply.
What makes the cost of financial capital move? Well, the usual supply-and-demand reasoning:
- If people suddenly find themselves with lots of extra savings to invest, that means the supply of financial capital increases, and the cost of financial capital should fall (i.e. stock prices rise).
- If people expect lower returns in the future, they will want to invest less, so the supply of financial capital decreases, and the cost of financial capital should rise (i.e. stock prices fall).
- If there’s a credit crunch and companies suddenly need to borrow lots of money on short notice, then the demand for financial capital increases, so the cost of financial capital should rise (i.e. stock prices fall).
- If many companies are suddenly flush with cash, then the demand for financial capital decreases, so the cost of financial capital should fall (i.e. stock prices rise).
This should all be pretty intuitive, and you can probably brainstorm a few more examples along these lines.
Now, what’s been going on lately, and how does it fit into this picture?
Expectations of future earnings are generally down (although mostly just in the short term). Many companies suddenly need to borrow money in order to stay in business until the storm passes. On their own, these two factors should both push stock prices down: supply of financial capital should be low, and demand for financial capital should be high.
The size of both of these changes are big, but not too far out of line with a normal business cycle slowdown. They are significant, but not huge by historical standards. On the other hand, there has been one ridiculously huge delta which utterly dwarfs any fast change we’ve seen in economic fundamentals in the last seventy years:
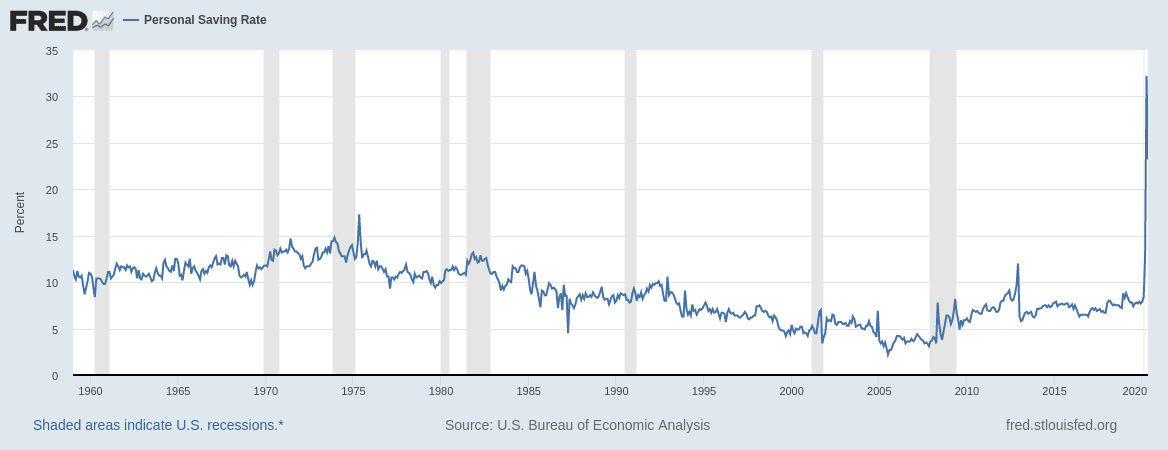
That’s the personal savings rate - the amount people save, relative to their disposable income. Given how the modern financial system works, that’s basically the supply of financial capital. It quadrupled in a month.
Even if people were nervous enough about the recovery to allocate half as large a share of marginal savings to stocks as they were a year ago, even if real disposable income were down (it’s actually up, courtesy of stimulus payments), that would still be a near-2x increase in marginal savings allocated to stocks. That jump in the personal savings rate is ridiculously larger than any change in economic fundamentals in living memory; it shouldn’t be surprising if it completely dominates market behavior.
What About That Formula?
Warning: more math and jargon past this point.
Ok, now we’ve talked about first principles. Hopefully it all makes intuitive sense. How does it square with ?
The key questions are: what’s that discounting rate R, and what distribution is the expectation over?
Many people will say it’s the “risk-free rate”, i.e. yield on Treasury bonds, but those same people will outright admit that this does not actually work. It predicts prices far higher than actual stock prices, and says that people ought to sell treasuries in order to buy stock. Obviously people don’t do that, because we’re not risk-neutral (nor should we be). The whole notion of R being the risk-free rate is based on a dumb argument that nobody actually buys.
Some people who’ve seen some math finance may talk about the “risk-neutral distribution” and corresponding discount rate. These are great tools for pricing derivatives, but they’re severely underdetermined for problems like “determine stock price from fundamentals”. They just assert the existence of some distribution and discount rate which make the formula work; they say nothing at all about what the distribution and rate should be.
To get a proper foundation for the pricing formula, we need to go to financial economics. John Cochrane (aka The Grumpy Economist) has a pretty decent book on the subject; he gives the economist’s simplest version of the pricing formula at the very beginning:
Here the “discount rate” for the timestep is the magic expression . What is that?
- is the amount the investor consumes at time - i.e. if this is a retirement portfolio, it’s the amount taken out.
- is the investor’s single-time-step utility function, and is its derivative with respect to amount consumed.
- is the investor’s own discount factor, i.e. how much they value consumption tomorrow relative to today.
Note that I keep saying “the investor” here - this formula is for one single investor! We don’t need to assume that all investors are expected discounted utility maximizers. If any investor acts like an expected discounted utility maximizer, then the formula applies for that investor’s discount rate, utility function, and expectations. The formula comes directly from the investor's own utility-maximization condition.
(Side-note: I actually don’t like the formulation in which the investor has an explicit time-discount with consumption each time step; I prefer to have the investor just maximize expected utility at some far-future timestep with exogenous cash-flows along the way, as a more accurate model of something like e.g. a retirement fund. For current purposes, the results are quite similar. Take-away: the things we’re saying here are not too highly sensitive to the model setup.)
Now, if you followed that, you’re probably thinking “Huh?? That means prices have to satisfy different efficient pricing formulas for different investors. But they’re the same prices!”. That’s right. The trick is, each investor will adjust their portfolio and their consumption to make their equation hold. This formula isn’t for predicting prices, it’s for predicting how much of each asset the investor holds going into the next timestep.
If we want to use the formula to predict prices, then we have two options.
- The hard (but right) way: compute the whole equilibrium for all the investors.
- The easier (but unreliable) way: notice that the consumption, distribution and discount rate for most investors seem to follow pretty stable patterns, then assume that those patterns hold and ask what price that implies.
Most usages of the pricing formula are ultimately equivalent to the second, with various flavors of first-order corrections thrown in. That works as long as the investor fundamentals are stable, but if there’s a big change in investor characteristics - like, say, a giant jump in the savings rate (i.e. a drop in consumption) - then obviously it falls apart.
27 comments
Comments sorted by top scores.
comment by paulfchristiano · 2020-07-03T22:05:25.056Z · LW(p) · GW(p)
I think people's annual income is on average <20% of their net worth ($100T vs $20T), maybe more like 15%.
So 2 months of +20% savings amounts to <1% increase in total savings, right?
If that's right, this doesn't seem very important relative to small changes in people's average allocation between equities/debt/currency, which fluctuate by 10%s during the normal business cycle.
Normally I expect higher savings rates to represent concern about having money in the future, which will be accompanied by a move to safer assets. And of course volatility is currently way up, so rational investors probably couldn't afford to invest nearly as much in stocks unless they were being compensated with significantly higher returns (which should involve prices only returning to normal levels as volatility falls).
Replies from: johnswentworth↑ comment by johnswentworth · 2020-07-03T23:18:38.978Z · LW(p) · GW(p)
I mentioned that I usually use a model with exogenous cash-flows, and this gets at the reason.
When I look at how most people around me manage their money, it does not look like "adjust allocations based on the business cycle". It looks like "keep savings in fixed-allocation retirement portfolio, or index fund, or just buy and hold for years". Most people don't actually trade much in response to market fluctuations; they trade when they have spare cash to invest or need to take out cash in order to pay bills. That doesn't mean their allocations don't change - e.g. if equity prices fall, then everyone who's simply bought-and-held will have a smaller proportion of their wealth in stocks without trading at all.
Of course, there's a whole industry full of professionals who do adjust more actively, but as a general rule traders on any timescale faster than years make money by forecasting the behavior of people trading larger amounts of money on slower timescales than them. The large-scale cash flows from everyday people are the "ground truth" which others make money by forecasting, whether explicitly or (more often) implicitly.
In short: it's mainly fund flows that drive overall prices, not vice-versa.
Note that the EMH is still compatible with this: the small fraction of active traders will still eat up any opportunities to beat the market. Those fund flows determine the behavior of the market which those traders are trying to beat - they determine the baseline.
Epistemic status on this: I don't have conclusive data, except in a few relatively-isolated markets (which are simpler to analyze). I trust the model because its qualitative predictions look much more realistic than a prices-drive-fund-flows model. For instance, one of my original big motivators of using a fund-flows-drive-prices model is that it directly predicts that price motion should usually look Brownian (to first order), whereas the usual models don't actually predict that - they just predict expectations, without actually saying anything about the shape of the distribution of moves.
Replies from: paulfchristiano↑ comment by paulfchristiano · 2020-07-04T00:09:02.642Z · LW(p) · GW(p)
I'd love to get evidence on that and it seems important.
Your position doesn't sound right to me. You don't need many people changing their allocations moderately to totally swamp a 1% change in inflows.
My guess would be that more than 10% of investors, weighted by total equity holdings, adjust their exposure deliberately, but I'd love to know the real numbers.
Replies from: dvasya↑ comment by dvasya · 2020-07-05T06:04:17.493Z · LW(p) · GW(p)
Regarding safer assets, when you put your money into a savings account (loan it to the bank), what is the bank to do with it? Presumably it has promised you interest. Or if you buy treasuries - someone must have sold them to you - what do they do now with all the cash? Just because you personally didn't put your money into stocks does't mean nobody else downstream from you did.
And because most securities aren't up for sale at any given time, a small fraction of market participants can have outsized effects on prices. Consider oil back in April: sure the "prices" turned "negative" when a few poor suckers realized they had forgotten to roll their futures to the next month back when everybody else did and could get stuck with a physical delivery, but how many barrels worth of contracts did actually change hands at those prices?
Not sure how this would support the OP's point specifically, but just wanted to point out that 1%-level things can sometimes have large manifestations in "prices", just because liquidity is finite.
comment by paulfchristiano · 2020-07-03T22:14:32.302Z · LW(p) · GW(p)
The main reason I'm personally confused is that 2 months ago I thought there was real uncertainty about whether we'd be able to keep the pandemic under control. Over the last 2 months that uncertainty has gradually been resolved in the negative, without much positive news about people's willingness to throw in the towel rather than continuing to panic and do lockdowns, and yet over that period SPY has continued moving up.
I'm making no attempt at all to estimate prices based on fundamentals and I'm honestly not even sure how that exercise is supposed to work. Interest rates are very low and volatility isn't that high so it seems like you would have extremely high equity prices if e.g. most investors were rational with plausible utility functions. But equity prices are never nearly as high as that kind of analysis would suggest.
Replies from: PeterMcCluskey, johnswentworth, snog toddgrass↑ comment by PeterMcCluskey · 2020-07-04T01:46:24.808Z · LW(p) · GW(p)
Two months ago, many investors predicted that unemployment would remain high for a long time, presumably because that's how a typical recession works. There's been a fair amount of evidence since then that employment is able to recover from this atypical downturn much faster than those investors expected.
That's not the whole story, but I'd guess it accounts for at least 1/3 of the SPY rise over the past 2 months.
↑ comment by johnswentworth · 2020-07-03T23:35:14.192Z · LW(p) · GW(p)
One comment on the low interest rates issue: I generally think about the equity premium puzzle via a Volker fence model. The institutions which own Treasuries (e.g. banks) do so with massive amounts of cheap leverage, and those are the only assets they're allowed to hold with that much leverage. For individuals without access to cheap leverage, it rarely makes sense to hold large amounts in Treasuries - stock returns are so much higher, because the cheap leverage of banks pushes down the returns on Treasuries. So we get this split model, where there's one class of investors which determines Treasury rates and a mostly-separate class which determines equity prices, with a regulatory barrier between the two (namely, bank leverage regulations).
Epistemic status: properly checking the numbers on this is still on my todo list, but the qualitative predictions look realistic and it matches how financial institutions actually work in practice.
Replies from: Wei_Dai, paulfchristiano↑ comment by Wei Dai (Wei_Dai) · 2020-07-05T06:17:19.446Z · LW(p) · GW(p)
The institutions which own Treasuries (e.g. banks) do so with massive amounts of cheap leverage, and those are the only assets they’re allowed to hold with that much leverage.
I'm curious about this. What source of leverage do banks have access to, that cost less than interest on Treasuries? (I know there are retail deposit accounts that pay almost no interest, but I think those are actually pretty expensive for the banks to obtain, because they have to maintain a physical presence to get those customers. I doubt those banks can make a profit if they just put those deposits into Treasuries. You must be talking about something else?)
Replies from: johnswentworth↑ comment by johnswentworth · 2020-07-05T18:17:37.188Z · LW(p) · GW(p)
The money markets are the main direct source of cheap (short-term) liquidity for banks; the relevant interest rates are LIBOR, fed funds, and repo. My current understanding is that retail deposits are ultimately the main source of funds in these markets - some banks (think Bank of America) specialize in retail and net-lend into the overnight money markets, while others net-borrow.
That money goes into Treasuries by default - i.e. whenever banks don't have anything higher-margin to put it into. That is a profitable activity, to my understanding, at least in the long term. It's borrowing short-term (overnight) and lending long-term (Treasury term), thereby getting paid to assume interest rate risk, which is exactly the main business of a bank.
In case people want to know more about this stuff, most of my understanding comes from Perry Mehrling's coursera course (which I recommend), as well as the first third of Stigum's Money Markets.
Replies from: Wei_Dai↑ comment by Wei Dai (Wei_Dai) · 2020-07-07T05:58:26.740Z · LW(p) · GW(p)
In case people want to know more about this stuff, most of my understanding comes from Perry Mehrling’s coursera course (which I recommend)
Thanks! I've been hoping to come across something like this, to learn about the details of the modern banking system.
↑ comment by paulfchristiano · 2020-07-04T00:18:48.828Z · LW(p) · GW(p)
My impression is that most individual investors and pension funds put a significant part of their portfolio into bonds.
Replies from: johnswentworth↑ comment by johnswentworth · 2020-07-04T00:30:50.335Z · LW(p) · GW(p)
True, though I would guess that bank holdings dwarf those, even looking at marginal investors. Banks not holding stocks is the more important side of this model, because that's the part which allows Treasury yields to be systematically lower than they "should" be compared to stocks.
↑ comment by snog toddgrass · 2020-07-03T23:48:39.802Z · LW(p) · GW(p)
Seeing if I understand. If Christiano is right about the pandemic we will see continued panic and lockdowns leading to high savings. High savings decrease the cost of fincap => stonks go up. So until we observe increased consumption (barring other crazy shit) we can expect continued high stock prices. So lockdowns continuing suggests a higher future SPY, lower.
I personally am investing in the long term (I'm young), so I am cool with risk. I do not want to buy into the SPY right now because it is so high. I'm considering buying stocks that have been hit hard in the short term but with have higher longterm expected value.
comment by PeterMcCluskey · 2020-07-04T02:33:07.320Z · LW(p) · GW(p)
That would make sense if the increase in savings was expected to be mostly permanent. But in this case, the savings rate seems likely to revert to normal in a year or so. Why aren't investors who see that selling enough now for stock prices to anticipate that return to normal?
My answer is that markets were fairly irrational in April, and have now mostly returned to expecting the economy to be back to normal in a year or two.
I see little reason to think that an unusually large fraction of stocks are overpriced.
However, I do see some puzzles when I look at a fairly select group of stocks with high market capitalization:
- Amazon
- Salesforce
- Apple
- Microsoft
- Home Depot
- Chipotle Mexican Grill
These and a modest number of similar companies have suspiciously high p/e ratios, and are big enough that a few dozen of them can be enough to make the S&P 500 overpriced, even if the majority of small-cap companies are underpriced.
Their prices are now saying that the pandemic did not cause harm. However, that might just be a continuation of a strange trend that was in place before the pandemic.
These stocks remind me of the Nifty Fifty of 50 years ago. Investors seem likely to be overconfident in these stocks, much as they were 50 years ago.
I also see some puzzles when I compare US stocks to other countries. Why do US stocks have high p/e ratios, high price/book ratios, etc, compared to countries which have handled the pandemic competently?
Replies from: johnswentworth, jmh↑ comment by johnswentworth · 2020-07-04T03:04:32.917Z · LW(p) · GW(p)
That would make sense if the increase in savings was expected to be mostly permanent. But in this case, the savings rate seems likely to revert to normal in a year or so. Why aren't investors who see that selling enough now for stock prices to anticipate that return to normal?
When one stock is overvalued relative to another stock, investors can buy the undervalued and sell the overvalued. When the entire market (including bonds) is "overvalued", that doesn't work - there's nothing to substitute into, and even an "overvalued" stock/bond is usually better than plain cash.
The relative price of two financial assets is mainly about expectations. The overall price level of the market is mainly about supply/demand of capital right now.
Replies from: FoggyTom, AlexSchell↑ comment by FoggyTom · 2020-07-04T03:52:27.627Z · LW(p) · GW(p)
I’d be curious to know what you think about the theory Fed asset purchases are driving the market.
The link between Fed balance sheet and stock prices isn’t tight, but there seems to be a fuzzy connection—stock returns were higher than long run average during QE1-3, then went sort of sideways for awhile after 3 ended, after 2016 the global economy was on a better footing and stocks rallied until QT ramped up enough to matter, draining liquidity and the 4Q18 “correction” followed by resumed rallying coincident with “stealth QE” to mitigate illiquidity in the repo market. Then we got the C19 sell off, followed by QE4 > QE1+2+3 and stocks are ripping again.
The transmission mechanism is obviously not banks using the cash to buy equities, but rather increased availability of credit lowerIng the cost of borrow for leveraged investors. When liquidity was draining, it wasn’t a problem for until it hit a critical threshold where the cost to borrow no longer justified levering long for the marginal bet. At this point, someone decides it might be prudent to tighten up the risk exposure, which is effected by selling stocks and repaying lenders. In theory that ought to lead the cost of borrow to adjust down, but institutional changes after the GFC have made banks more risk averse and it’s possible, after the disruptions in the repo market, they decided to derisk too and a cascade ensues. Then the Fed buys $4tr of assets, the banks are flush with reserves, stock valuations are lower and so is the cost of borrow. This changes the calculus for leveraged funds (including derivatives related to equities like SPX futures) and they flip from net sellers of stocks to cut risk in the sell off and maintain margin requirements to net buyers.
Of course if we want to go all Ockham, money printing = devaluation -> inflation causing real assets like equities to catch a bid.
Replies from: johnswentworth, zby↑ comment by johnswentworth · 2020-07-04T04:14:17.109Z · LW(p) · GW(p)
This is also something I have yet to study in depth, but the Fed model makes a lot of sense (specifically the capital structure substitution version). Under that model, companies generally use stock issues/buybacks paired with bond buybacks/issues to adjust how much of their funding is from stocks vs bonds, in order to maximize expected earnings per share. That creates a transmission mechanism between bonds and stocks, and is the main thing I'd think about for the sorts of stuff you're talking about.
More generally, I'm on board with Cochrane's money as stock theory, although I think he doesn't implement it quite right - the assets backing dollar value on a day-to-day basis are the SOMA portfolio, not the whole government's assets and cash flows.
↑ comment by zby · 2020-07-06T15:02:21.888Z · LW(p) · GW(p)
"money printing = devaluation -> inflation" - that is kind of obvious - I would start with asking what are the arguments against it. In 2008 it did not work that way - so it looks kind of disproved, but times are changing. The Ray Dalio recent blog posts suggest that the USD global reserve status might be at the end of its cycle. Another thing is that the US government debt it increasing and at some day it will reach one of two reinforcing thresholds: one where investors would start seeing it as dangerous (and demand higher rates) and the other where servicing that debt becomes burdensome and the US government would have to devalue it.
↑ comment by AlexSchell · 2020-07-06T11:54:26.968Z · LW(p) · GW(p)
even an "overvalued" stock/bond is usually better than plain cash
Wait, are you expecting positive total returns from stocks over the next few months? If so, this is very non-obvious from your post.
Replies from: johnswentworth↑ comment by johnswentworth · 2020-07-06T16:52:18.708Z · LW(p) · GW(p)
I pretty much always expect positive total returns from stocks. Nothing in the OP contradicts the EMH - predicting crashes in such a way that we could profit from it is still Hard. The correct discount rate to use in EMH pricing depends on capital supply and demand, but that discount rate is still generally positive. Just like high bond prices mean that the yield is close to zero, not negative, high stock prices mean that expected returns are close to zero, not negative. (This isn't always the case - e.g. negative interest rates in the European banks' overnight markets during the previous decade - but that requires some fairly unusual conditions to maintain.)
So, yes, I do expect positive total returns from stocks over the next few months, though not very high on average and with quite a bit of variance.
↑ comment by jmh · 2020-07-05T15:08:58.293Z · LW(p) · GW(p)
Do you make any adjustment on the PE evaluation, particularly for the top 4, in light of all the ways reported earning can be manipulated. I have not looked but would you have the same list if looking at things from a revenue based valuation or a free cash flow valuation?
Replies from: PeterMcCluskey↑ comment by PeterMcCluskey · 2020-07-05T15:45:29.402Z · LW(p) · GW(p)
When I mentioned p/e ratios, that was just a hasty simplification, not a description of how I generated the list. I looked at a variety of indicators, including free cash flow, revenues, forecasted earnings, and dividends. For Amazon and Salesforce, GAAP earnings imply extreme overvaluation, but are a bit misleading, and free cash flow provides a better measure (they still look overpriced, but not dramatically enough that I'm eager to short them). For the other 4 that I listed, p/e ratios look about as informative as the other measures.
comment by ryan_b · 2020-09-10T15:00:43.932Z · LW(p) · GW(p)
The hard (but right) way: compute the whole equilibrium for all the investors.
What would be the impact of using a representative sample of investors as a computation-saving measure? By this I mean:
- Look at the body of all of the investors
- Identify the different investor types (hedge funds, index funds, day traders, etc)
- Compute the whole equilibrium for a sample of investors that preserves the proportion of the investor types
I have a suspicion that investor types will correspond to the timelines over which they invest(?) but I am not sure that's how it works from an analysis standpoint.
Replies from: johnswentworth↑ comment by johnswentworth · 2020-09-10T16:54:30.345Z · LW(p) · GW(p)
That would be correct assuming that
- the sample is in fact representative, i.e. the investor types cover the large majority of the capital in the market, and
- investors within each type have "similar" behavior - ideally they can all be captured by a representative agent.
(We could also circumvent the need for representative agents by estimating the demand function of each investor class directly, but then with n assets we need to estimate a function from R^n to R^n rather than a function from R^n to R, so the data and computation requirements are dramatically higher. Also, at that point there aren't clear benefits to breaking out classes of investors in the first place.)
Investor types corresponding to timelines is indeed sensible; I use that a lot in my own models. For instance, I can use data on individual trades to estimate the portfolios held by market makers as a function of price.
comment by Mitchell_Porter · 2020-07-04T01:53:15.982Z · LW(p) · GW(p)
I thought the stock market was perpetually up because most stocks are traded among institutional investors that can borrow from the Fed, and the Fed is keeping lending rates low...
Replies from: FoggyTom↑ comment by FoggyTom · 2020-07-04T03:56:56.787Z · LW(p) · GW(p)
Maybe, sort of. Institutional Investors can’t borrow directly from the Fed, banks have to intermediate and they don’t always react the way the Fed expects. My theory is that leveraged investors (certain types of Hedge Funds) are impacted by changes in liquidity driven by Fed balance sheet changes. I wrote it out in this thread above.
comment by SuperDaveWhite (superdavewhite) · 2020-07-15T02:53:43.677Z · LW(p) · GW(p)
How would you write into your model market psychology?
"What seems too high and risky to the majority generally goes higher and what seems low and cheap generally goes lower." - William O’Neil
Most of these chestnuts in trading continue to be repeated because of the ground truth in them. What part of the market shows the binary view of most traders euphoria and despair?