Parameter counts in Machine Learning
post by Jsevillamol, Pablo Villalobos (pvs) · 2021-06-19T16:04:34.733Z · LW · GW · 18 commentsContents
  Features of the dataset
  Caveats
  Insights
  Open questions
  Next steps
  Acknowledgements
  Bibliography
None
18 comments
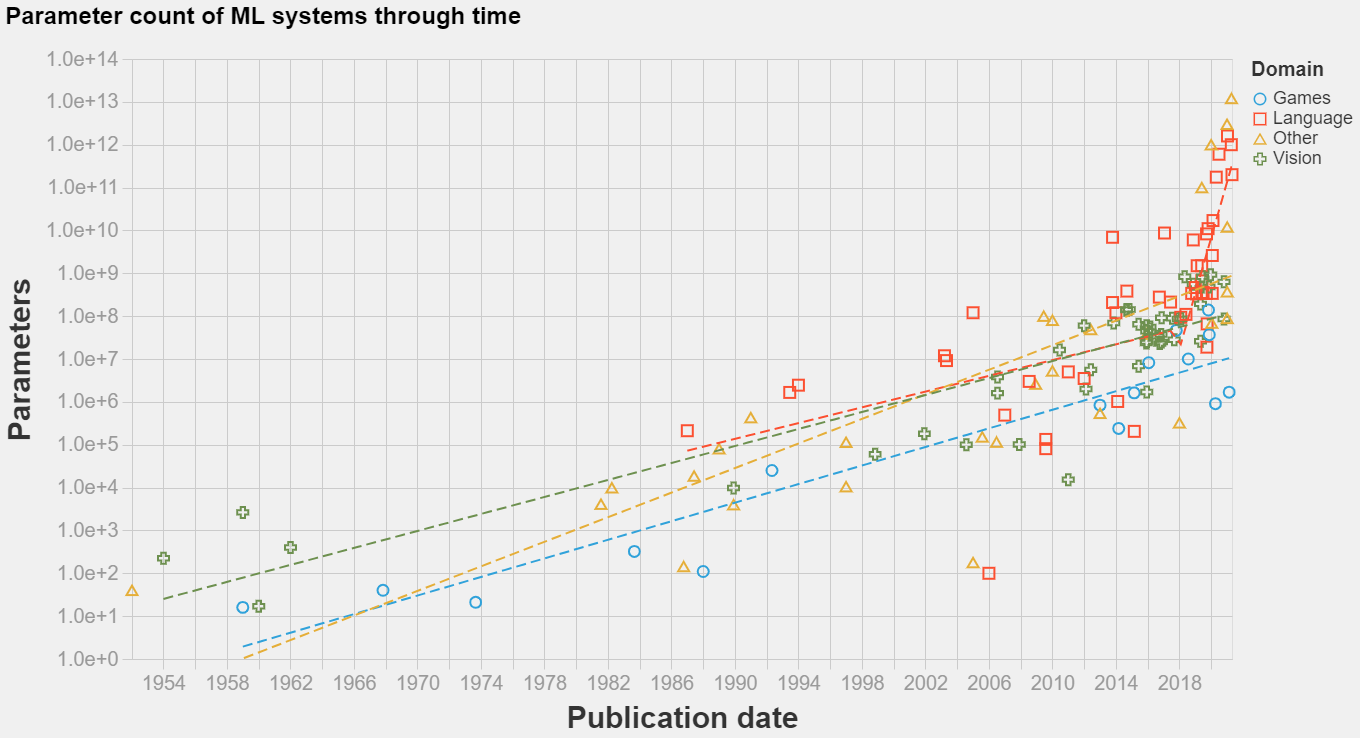
In short: we have compiled information about the date of development and trainable parameter counts of n=139 machine learning systems between 1952 and 2021. This is, as far as we know, the biggest public dataset of its kind. You can access our dataset here, and the code to produce an interactive visualization is available here.
We chose to focus on parameter count because previous work indicates that it is an important variable for model performance [1], because it helps as a proxy of model complexity and because it is information usually readily available or easily estimable from descriptions of model architecture.
We hope our work will help AI researchers and forecasters understand one way in which models have become more complex over time, and ground their predictions of how the field will progress in the future. In particular, we hope this will help us tease apart how much of the progress in Machine Learning has been due to algorithmic improvements versus increases in model complexity.
It is hard to draw firm conclusions from our biased and noisy dataset. Nevertheless, our work seems to give weak support to two hypotheses:
- There was no discontinuity in any domain in the trend of model size growth in 2011-2012. This suggests that the Deep Learning revolution was not due to an algorithmic improvement, but rather the point where the trend of improvement of Machine Learning methods caught up to the performance of other methods.
- In contrast, it seems there has been a discontinuity in model complexity for language models somewhere between 2016-2018. Returns to scale must have increased, and shifted the trajectory of growth from a doubling time of ~1.5 years to a doubling time of between 4 to 8 months.
The structure of this article is as follows. We first describe our dataset. We point out some weaknesses of our dataset. We expand on these and other insights. We raise some open questions. We finally discuss some next steps and invite collaboration.
Features of the dataset
- The dataset spans systems from 1952 to 2020, though we included far more information about recent systems (from 2010 onwards).
- The systems we include encompass many types, including neural networks, statistical models, support vector machines, bayesian networks and other more exotic architectures. However we mostly included systems of the neural network kind.
- The systems are from many domains and were trained to solve many tasks. However we mostly focused on systems trained to solve vision, language and gaming tasks.
- We relied on a subjective criteria of notability to decide which systems to include. Our decisions were informed by citation counts (papers with more than 1000 citations), external validation (papers that received some kind of paper of the year award or similar) and historical importance (papers that were cited by other work as seminal). The references to this post include some overviews we used as a starting point to curate our dataset [2-26].
- Several models have versions at multiple scales. Whenever we encountered this in their original publication, we recorded whichever was presented in the paper as the main one, or the largest presented version. Sometimes we recorded multiple versions when we felt it was warranted, e.g. when multiple different versions were trained to solve different tasks.
Caveats
- It is important to take into account that model size is hardly the most important parameter to understand the progress of ML systems. Other arguably more important indicators of non-algorithmic progress in ML systems include training compute and training dataset size [1].
- Model size as a metric of model complexity is hardly comparable across domains or even architectures. For example, a mixture-of-expert model can achieve higher parameter counts but invest far less compute into training each parameter.
- Our selection of systems is biased in many important ways. We are biased towards academic publications (since information on commercial systems is harder to come by). We include more information about recent systems. We tended to include information about papers where the parameter counts were readily available, in particular larger models that were developed to test the limits of how large a model can be. We are biased towards papers published in English. We mostly focused on systems on vision, language and gaming tasks, while we have comparatively fewer papers on e.g. speech recognition, recommender systems or self driving. Lastly, we are biased towards systems we personally found interesting or impressive.
- Recollecting the information was a time consuming exercise that required us to read through hundreds of technical papers to gather the parameter counts. It is quite likely we have made some mistakes.
Insights
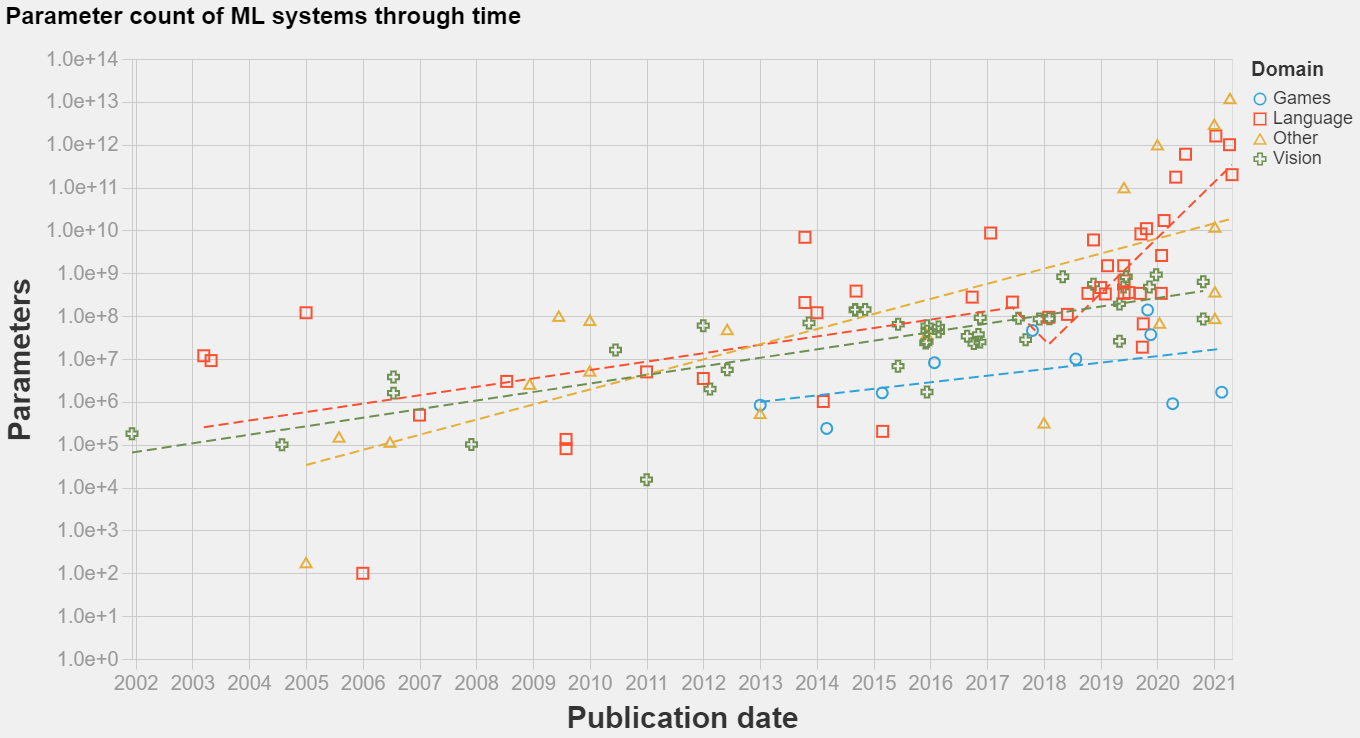
- Unsurprisingly, there is an upward trend in model size. The trend seems exponential, and seems to have picked up its pace recently for language models. An eyeball estimate of the slope of progress suggests that the doubling rate was between 18 and 24 months from 2000 to 2016-2018 in all domains, and between 3 and 5 months from 2016-2018 onward in the language domain.
- The biggest models in terms of trainable parameters can be found in the language and recommender system domains. The biggest model we found was the 12 trillion parameter Deep Learning Recommender System from Facebook. We don’t have enough data on recommender systems to ascertain whether recommender systems have been historically large in terms of trainable parameters.
- Language models have been historically bigger than in other domains. This was because of statistical models whose parameterization scales with vocabulary size (e.g. as in the Hiero Machine Translation System from 2005) and word embeddings that also scale with vocabulary size (e.g. as in Word2Vec from 2013).
- Arguably Deep Learning started to proliferate in computer vision before it reached language processing (both circa 2011-2013), however the parameter counts of the second far surpass those of the first today. In particular, somewhere between 2016-2018 the trend of growth in language model size apparently greatly accelerated its pace, to a doubling time of between 4 and 8 months.
- Architectures on the game domain are small in terms of trainable parameters, below vision architectures while apparently growing at a similar rhythm. Naively we expected otherwise, since playing games seems more complicated. However, in hindsight, what determines model size is what are the returns to scale; in more complex domains we should expect lower effective model sizes, as the models are more constrained in other ways.
- The trend of growth in model size has been relatively stable through the transition into the deep learning era in 2011-2012 in all domains we studied (though it is hard to say with certainty given the amount of data). This suggests that the deep learning revolution was less of a paradigm change and more of a natural continuation of existing tendencies, which finally surpassed other non-machine learning methods.
Open questions
- Why is there a discrepancy in the trainable parameters magnitude and trend of growth in e.g. vision systems versus e.g. language systems? Some hypotheses are that language architectures scale better with size, that vision models are more bottlenecked on training data, that vision models require more compute per parameter or that the language processing ML community is ahead in experiment with large scale models (e.g. because they have access to more compute and resources).
- What caused the explosive growth in the size of language models from 2018 onwards? Was it a purely social phenomena as people realized the advantages of larger models, was it enabled by the discovery of architectures that scaled better with size, compute and data (e.g. transformers?) or was it caused by something else entirely?
- Do the scaling laws of Machine Learning for pre-and-post-deep-learning actually differ significatively? So far model size seems to suggest otherwise, what about other metrics?
- How can we more accurately estimate the rates of growth for each domain and period? For how long will current rates of growth be sustained?
Next steps
- We are interested in collaborating with other researchers to grow this dataset to be more representative and correcting any mistakes. As an incentive, we will pay $5 per mistake found or system addition (up to $600 total among all submissions; please contact us if you want to contribute with a donation to increase the payment cap). You can send your submissions to jaimesevillamolina at gmail dot com, preferably in spreadsheet format.
- We are interested in including other information about the systems, most notably compute and training dataset size.
- We want to include more information on other domains, specially on recommender systems.
- We want to look harder for systematic reviews and other already curated datasets of AI systems.
Acknowledgements
This article was written by Jaime Sevilla, Pablo Villalobos and Juan Felipe Cerón. Jaime’s work is supported by a Marie Curie grant of the NL4XAI Horizon 2020 program.
We thank Girish Sastry for advising us on the beginning of the project, the Spanish Effective Altruism community for creating a space to incubate projects such as this one, and Haydn Belfield, Pablo Moreno and Ehud Reiter for discussion and system submissions.
Bibliography
- Kaplan et al., “Scaling Laws for Neural Language Models,” 08361.
- 1.6 History of Reinforcement Learning. (n.d.). Retrieved June 19, 2021, from http://incompleteideas.net/book/first/ebook/node12.html
- AI and Compute. (n.d.). Retrieved June 19, 2021, from https://openai.com/blog/ai-and-compute/
- AI and Efficiency. (2020, May 5). OpenAI. https://openai.com/blog/ai-and-efficiency/
- AI Progress Measurement. (2017, June 12). Electronic Frontier Foundation. https://www.eff.org/ai/metrics
- Announcement of the 2020 ACL Test-of-Time Awards (ToT) | ACL Member Portal. (n.d.). Retrieved June 19, 2021, from https://www.aclweb.org/portal/content/announcement-2020-acl-test-time-awards-tot#:~:text=Each%20year%2C%20the%20ACL%20Test,papers%20from%2010%20years%20earlier.&text=The%20winners%20were%20announced%20at%20ACL%202020.
- Bender, E. M., Gebru, T., McMillan-Major, A., & Shmitchell, S. (2021). On the Dangers of Stochastic Parrots: Can Language Models Be Too Big? 🦜. Proceedings of the 2021 ACM Conference on Fairness, Accountability, and Transparency, 610–623. https://doi.org/10.1145/3442188.3445922
- Best paper awards—ACL Wiki. (n.d.). Retrieved June 19, 2021, from https://aclweb.org/aclwiki/Best_paper_awards
- bnlearn—Bayesian Network Repository. (n.d.). Retrieved June 19, 2021, from https://www.bnlearn.com/bnrepository/
- Brian Christian on the alignment problem. (n.d.). 80,000 Hours. Retrieved June 19, 2021, from https://80000hours.org/podcast/episodes/brian-christian-the-alignment-problem/
- Computer Vision Awards – The Computer Vision Foundation. (n.d.). Retrieved June 19, 2021, from https://www.thecvf.com/?page_id=413
- DARPA Grand Challenge. (2021). In Wikipedia. https://en.wikipedia.org/w/index.php?title=DARPA_Grand_Challenge&oldid=1021627196
- Karim, R. (2020, November 28). Illustrated: 10 CNN Architectures. Medium. https://towardsdatascience.com/illustrated-10-cnn-architectures-95d78ace614d
- Mohammad, S. M. (2020). Examining Citations of Natural Language Processing Literature. Proceedings of the 58th Annual Meeting of the Association for Computational Linguistics, 5199–5209. https://doi.org/10.18653/v1/2020.acl-main.464
- Mudigere, D., Hao, Y., Huang, J., Tulloch, A., Sridharan, S., Liu, X., Ozdal, M., Nie, J., Park, J., Luo, L., Yang, J. A., Gao, L., Ivchenko, D., Basant, A., Hu, Y., Yang, J., Ardestani, E. K., Wang, X., Komuravelli, R., … Rao, V. (2021). High-performance, Distributed Training of Large-scale Deep Learning Recommendation Models. ArXiv:2104.05158 [Cs]. http://arxiv.org/abs/2104.05158
- Nilsson, N. (1974). Artificial Intelligence. IFIP Congress. https://doi.org/10.7551/mitpress/11723.003.0006
- Posey, L. (2020, April 28). History of AI Research. Medium. https://towardsdatascience.com/history-of-ai-research-90a6cc8adc9c
- Raschka, S. (2019). A Brief Summary of the History of Neural Networks and Deep Learning. Deep Learning, 29.
- Sanh, V., Debut, L., Chaumond, J., & Wolf, T. (2020). DistilBERT, a distilled version of BERT: Smaller, faster, cheaper and lighter. ArXiv:1910.01108 [Cs]. http://arxiv.org/abs/1910.01108
- Thompson, N. C., Greenewald, K., Lee, K., & Manso, G. F. (2020). The Computational Limits of Deep Learning. ArXiv:2007.05558 [Cs, Stat]. http://arxiv.org/abs/2007.05558
- Vidal, R. (n.d.). Computer Vision: History, the Rise of Deep Networks, and Future Vistas. 60.
- Wang, B. (2021). Kingoflolz/mesh-transformer-jax [Jupyter Notebook]. https://github.com/kingoflolz/mesh-transformer-jax (Original work published 2021)
- Who Invented Backpropagation? (n.d.). Retrieved June 19, 2021, from https://people.idsia.ch//~juergen/who-invented-backpropagation.html
- Xie, Q., Luong, M.-T., Hovy, E., & Le, Q. V. (2020). Self-training with Noisy Student improves ImageNet classification. ArXiv:1911.04252 [Cs, Stat]. http://arxiv.org/abs/1911.04252
- Young, T., Hazarika, D., Poria, S., & Cambria, E. (2018). Recent Trends in Deep Learning Based Natural Language Processing. ArXiv:1708.02709 [Cs]. http://arxiv.org/abs/1708.02709
- Zhang, B., Xiong, D., Su, J., Lin, Q., & Zhang, H. (2018). Simplifying Neural Machine Translation with Addition-Subtraction Twin-Gated Recurrent Networks. ArXiv:1810.12546 [Cs]. http://arxiv.org/abs/1810.12546
- Zoph, B., & Le, Q. V. (2016). Neural Architecture Search with Reinforcement Learning. https://arxiv.org/abs/1611.01578v2
18 comments
Comments sorted by top scores.
comment by Rohin Shah (rohinmshah) · 2021-06-27T15:11:39.590Z · LW(p) · GW(p)
I think the story for the discontinuity is basically "around 2018 industry labs realized that language models would be the next big thing" (based on Attention is all you need, GPT-2, and/or BERT), and then they switched their largest experiments to be on language (as opposed to the previous contender, games).
Similarly for games, if you take DQN to be the event causing people to realize "large games models will be the next big thing", it does kinda look like there's a discontinuity there (though there are way fewer points so it's harder to tell, also I'm inclined to ignore things like CURL which came out of an academic lab with a limited compute budget).
This story doesn't hold up for vision though (taking AlexNet as the event); I'm not sure why that is. One theory is that vision is tied to a fixed dataset -- ImageNet -- and that effectively puts a max size on how big your neural nets can be.
You might also think that model size underwent a discontinuity around 2018, independent of which domain it's in -- I think that's because the biggest experiments moved from vision (2012-15) to games (2015-19) to language (2019-now), with the compute trend staying continuous. However, in games the model-size-to-compute ratio is way lower (since it involves RL, while vision and language involve SL). For example, AlphaZero had fewer parameters than AlexNet, despite taking almost 5 orders of magnitude more compute. So you see max model size stalling a bit in 2015-19, and then bursting upwards around 2019.
Aside: I hadn't realized AlphaZero took 5 orders of magnitude more compute per parameter than AlexNet -- the horizon length concept [AF · GW] would have predicted ~2 orders (since a full Go game is a couple hundred moves). I wonder what gets the extra 3 orders. Probably at least part of it comes from the difference between using a differentiable vs. non-differentiable objective function.
Replies from: julian-schrittwieser, paulfchristiano, alex-ray, gwern↑ comment by Julian Schrittwieser (julian-schrittwieser) · 2021-08-31T20:31:17.740Z · LW(p) · GW(p)
The difference in compute between AlexNet and AlphaZero is because for AlexNet you are only counting the flops during training, while for AlphaZero you are counting both the training and the self-play data generation (which does 800 forwards per move * ~200 moves to generate each game).
If you were to compare supervised training numbers for both (e.g. training on human chess or Go games) then you'd get much closer.
Replies from: rohinmshah↑ comment by Rohin Shah (rohinmshah) · 2021-09-01T13:07:34.442Z · LW(p) · GW(p)
That's fair. I was thinking of that as part of "compute needed during training", but you could also split it up into "compute needed for gradient updates" and "compute needed to create data of sufficient quality", and then say that the stable thing is the "compute needed for gradient updates".
↑ comment by paulfchristiano · 2021-06-28T19:05:07.480Z · LW(p) · GW(p)
Aside: I hadn't realized AlphaZero took 5 orders of magnitude more compute per parameter than AlexNet -- the horizon length concept [AF · GW] would have predicted ~2 orders (since a full Go game is a couple hundred moves). I wonder what gets the extra 3 orders. Probably at least part of it comes from the difference between using a differentiable vs. non-differentiable objective function.
I think that in a forward pass, AlexNet uses about 10-15 flops per parameter (assuming 4 bytes per parameter and using this table), because it puts most of its parameters in the small convolutions and FC layers. But I think AlphaZero has most of its parameters in 19x19 convolutions, which involve 722 flops per parameter (19 x 19 x 2). If that's right, it accounts for a factor of 50; combined with game length that's 4 orders of magnitude explained.
I'm not sure what's up with the last order of magnitude. I think that's a normal amount of noise / variation across different tasks, though I would have expected AlexNet to be somewhat overtrained given the context. I also think the comparison is kind of complicated because of MCTS and distillation (e.g. AlphaZero uses much more than 1 forward pass per turn, and you can potentially learn from much shorter effective horizons when imitating the distilled targets).
Replies from: rohinmshah↑ comment by Rohin Shah (rohinmshah) · 2021-06-29T07:43:28.435Z · LW(p) · GW(p)
I also looked into number of training points very briefly, Googling suggests AlexNet used 90 epochs on ImageNet's 1.3 million train images, while AlphaZero played 44 million games for chess (I didn't quickly find a number for Go), suggesting that the number of images was roughly similar to the number of games.
So I think probably the remaining orders of magnitude are coming from the tree search part of MCTS (which causes there to be > 200 forward passes per game).
↑ comment by A Ray (alex-ray) · 2021-07-01T16:48:38.513Z · LW(p) · GW(p)
One reason it might not be fitting as well for vision, is that vision has much more weight-tying / weight-reuse in convolutional filters. If the underlying variable that mattered was compute, then image processing neural networks would show up more prominently in compute (rather than parameters).
↑ comment by gwern · 2021-06-28T21:10:39.129Z · LW(p) · GW(p)
Could it be inefficient scaling? Most work not explicitly using scaling laws to plan it seems to generally overestimate in compute per parameter, using too-small models. Anyone want to try to apply Jones 2021 to see if AlphaZero was scaled wrong?
Replies from: gwern↑ comment by gwern · 2024-06-28T02:45:23.062Z · LW(p) · GW(p)
Ben Adlam (via Maloney et al 2022) makes an interesting point: if you plot parameters vs training data, it's a nearly perfect 1:1 ratio historically. (He doesn't seem to have published anything formally on this.)
Replies from: Jsevillamol↑ comment by Jsevillamol · 2024-06-28T18:05:39.810Z · LW(p) · GW(p)
We have conveniently just updated our database if anyone wants to investigate this further!
https://epochai.org/data/notable-ai-models
comment by Bucky · 2021-06-21T12:29:37.472Z · LW(p) · GW(p)
Great collection of results. I particularly found the interactive graph useful.
I'm slightly confused by the trend lines (especially for Games and Other) - they don't seem intuitively the best fits. It looks like they place a lot of importance on the high parameter recent models (possibly the cost for each datapoint is in parameter space rather than log(parameter) space?
Replies from: Jsevillamol↑ comment by Jsevillamol · 2021-06-21T14:33:04.360Z · LW(p) · GW(p)
Thank you! I think you are right - by default the Altair library (what we used to plot the regressions) does OLS fitting of an exponential instead of fitting a linear model over the log transform. We'll look into this and report back.
Replies from: daniel-kokotajlo, Jsevillamol↑ comment by Daniel Kokotajlo (daniel-kokotajlo) · 2021-06-21T15:07:29.084Z · LW(p) · GW(p)
If you are still interested in fiddling with this graph, here's a variant I'd love to see:
Remove all the datapoints in each AI category that are not record-setting, such that each category just tracks the largest available models at any given time. Then compute the best fit lines for the resulting categories. (Because this is what would be useful for predicting what the biggest models will be in year X, whereas the current design is for predicting what the average model size will be in year X... right?)
Replies from: Jsevillamol↑ comment by Jsevillamol · 2021-06-28T09:54:14.517Z · LW(p) · GW(p)
Good suggestion! Understanding the trend of record-setting would be interesting indeed so that we avoid the pesky influence of the systems which are below the trend like CURL in the game domain.
The problem with the naive setup of just regressing on record-setters is that is quite sensitive to noise - one early outlier in the trend can completely alter the result.
I explore a similar problem in my paper Forecasting timelines of quantum computing, where we try to extrapolate progress on some key metrics like qubit count and gate error rate. The method we use in the paper to address this issue is to bootstrap the input and predict a range of possible growth rates - that way outliers do not completely dominate the result.
I will probably not do it right now for this dataset, though I'd be interested in having other people try that if they are so inclined!
Replies from: daniel-kokotajlo↑ comment by Daniel Kokotajlo (daniel-kokotajlo) · 2021-06-28T11:19:34.240Z · LW(p) · GW(p)
OK, sounds good! I know someone who might be interested...
Another, very similar thing that would be good is to just delete all the non-record-setting data points and draw lines to connect the remaining dots.
Also, it would be cool if we could delete all the Mixture of Experts models to see what the "dense" version of the trend looks like.
↑ comment by Jsevillamol · 2021-06-28T09:45:18.679Z · LW(p) · GW(p)
This is now fixed; see the updated graphs. We have also updated the eye ball estimates accordingly.
comment by Rohin Shah (rohinmshah) · 2021-06-27T15:21:35.536Z · LW(p) · GW(p)
Planned summary for the Alignment Newsletter:
This post presents a dataset of the parameter counts of 139 ML models from 1952 to 2021. The resulting graph is fairly noisy and hard to interpret, but suggests that:
1. There was no discontinuity in model size in 2012 (the year that AlexNet was published, generally acknowledged as the start of the deep learning revolution).
2. There was a discontinuity in model size for language in particular some time between 2016-18.
Planned opinion:
You can see my thoughts on the trends in model size in [this comment](https://www.alignmentforum.org/posts/GzoWcYibWYwJva8aL/parameter-counts-in-machine-learning?commentId=sFFBeva2fDgsoynDC).
comment by Daniel Kokotajlo (daniel-kokotajlo) · 2021-06-21T14:23:00.564Z · LW(p) · GW(p)
Thank you for collecting this dataset! What's the difference between the squares, triangles, and plus-sign datapoints? If you say it somewhere I haven't been able to find it I'm afraid.
Replies from: Jsevillamol↑ comment by Jsevillamol · 2021-06-21T14:40:12.807Z · LW(p) · GW(p)
Thank you! The shapes mean the same as the color (ie domain) - they were meant to make the graph more clear. Ideally both shape and color would be reflected in the legend. But whenever I tried adding shapes to the legend instead a new legend was created, which was more confusing.
If somebody reading this knows how to make the code produce a correct legend I'd be very keen on hearing it!
EDIT: Now fixed