Ages Survey: Results
post by jefftk (jkaufman) · 2023-06-05T02:10:06.986Z · LW · GW · 10 commentsContents
10 comments
A few weeks ago after the community meeting with the Department of Children and Families I decided to run a survey to learn more about the range of ages at which people generally thought kids might be ready to do various activities without supervision. Stay home for a few hours? Play at the park alone? Take public transit? I put something together on Google Forms and shared it on Facebook and over email. Several friends shared it further, and over the next two weeks it gathered 219 responses. In reading the following please remember that this is not a representative sample of anything: it's heavily oversampling people geographically and socially similar to me!
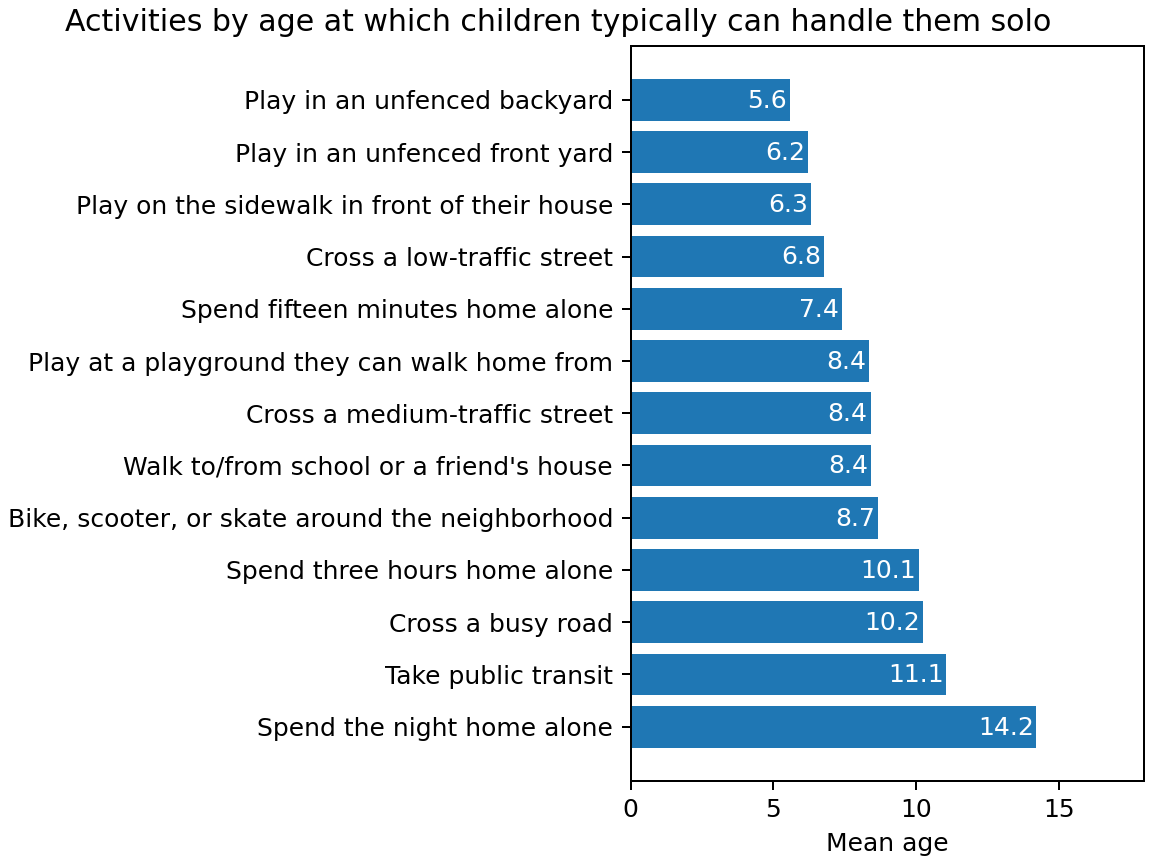
The main part of the survey was a series of questions about scenarios ("play in an unfenced backyard", "cross a medium-traffic street", "spend the night home alone") and asking "what age you'd guess the typical child in your area could learn to do it without supervision". Here are the average responses:
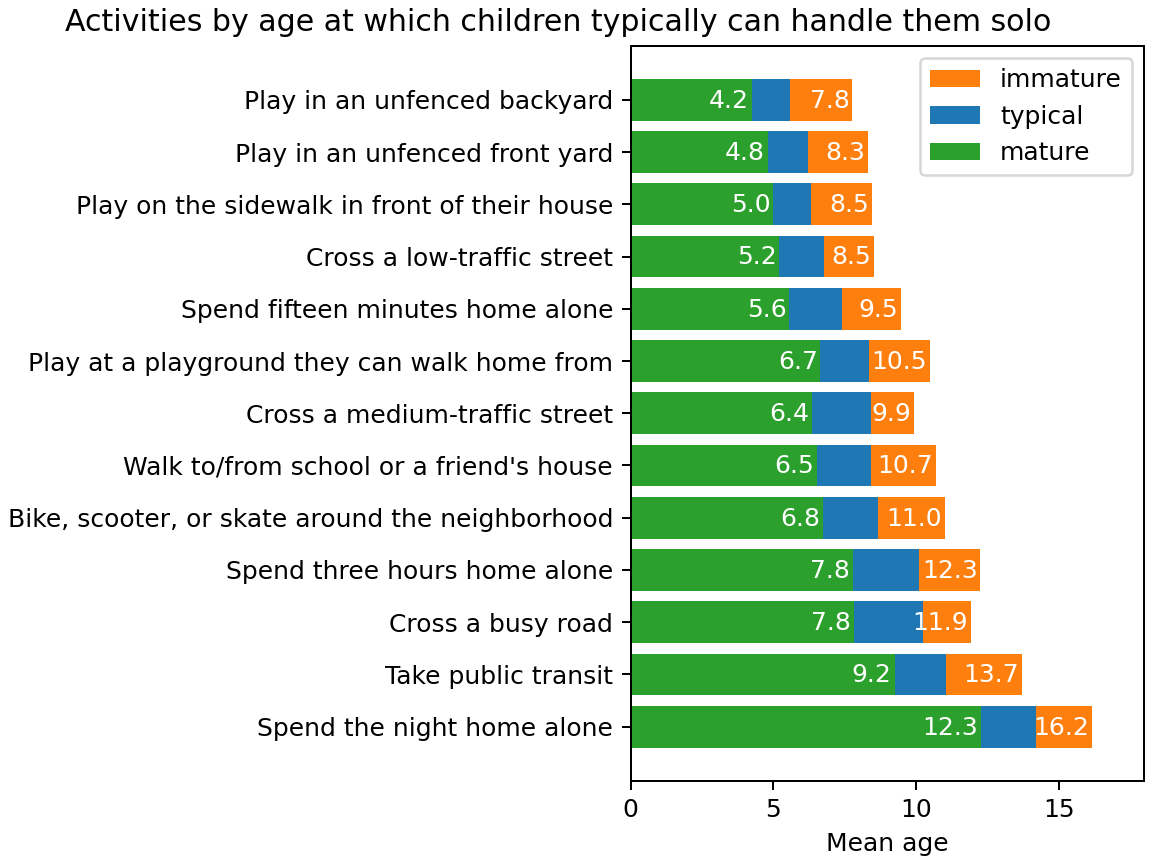
The survey also asked "the ages you'd guess for an especially mature child (90th percentile) or an especially immature child (10th percentile)", assuming "the child doesn't have any relevant disabilities." Here's that chart again, with the addition of the estimates for especially mature or immature children:
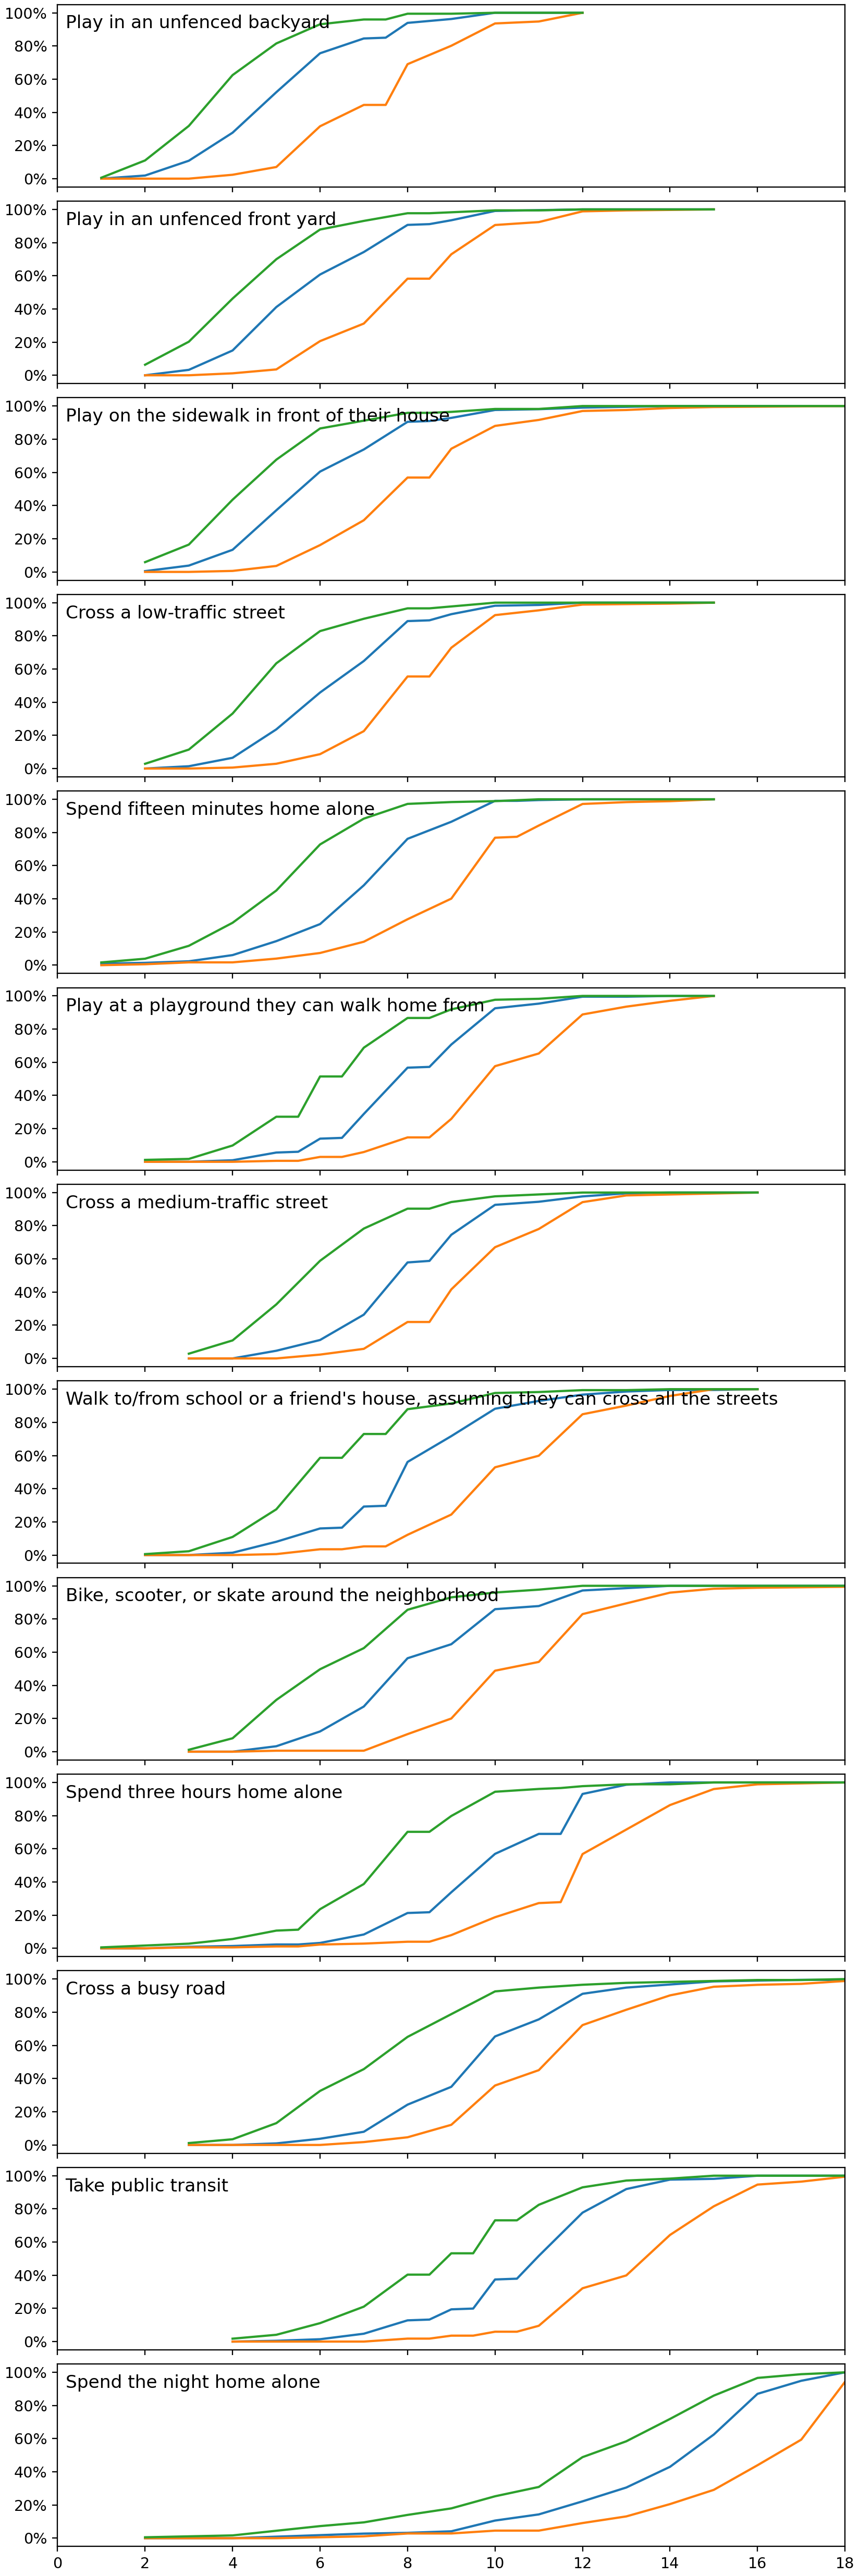
Taking medians is helpful for distilling each question down to a few numbers, but the wide range of responses are interesting. Here are CDF plots for each question. The way to read these is that at a given age (x-axis) they tell you what fraction of parents (y-axis) think a child this old is likely ready. You can think of the previous bar chart as a collection of the the y=50% slices from each of the charts below:
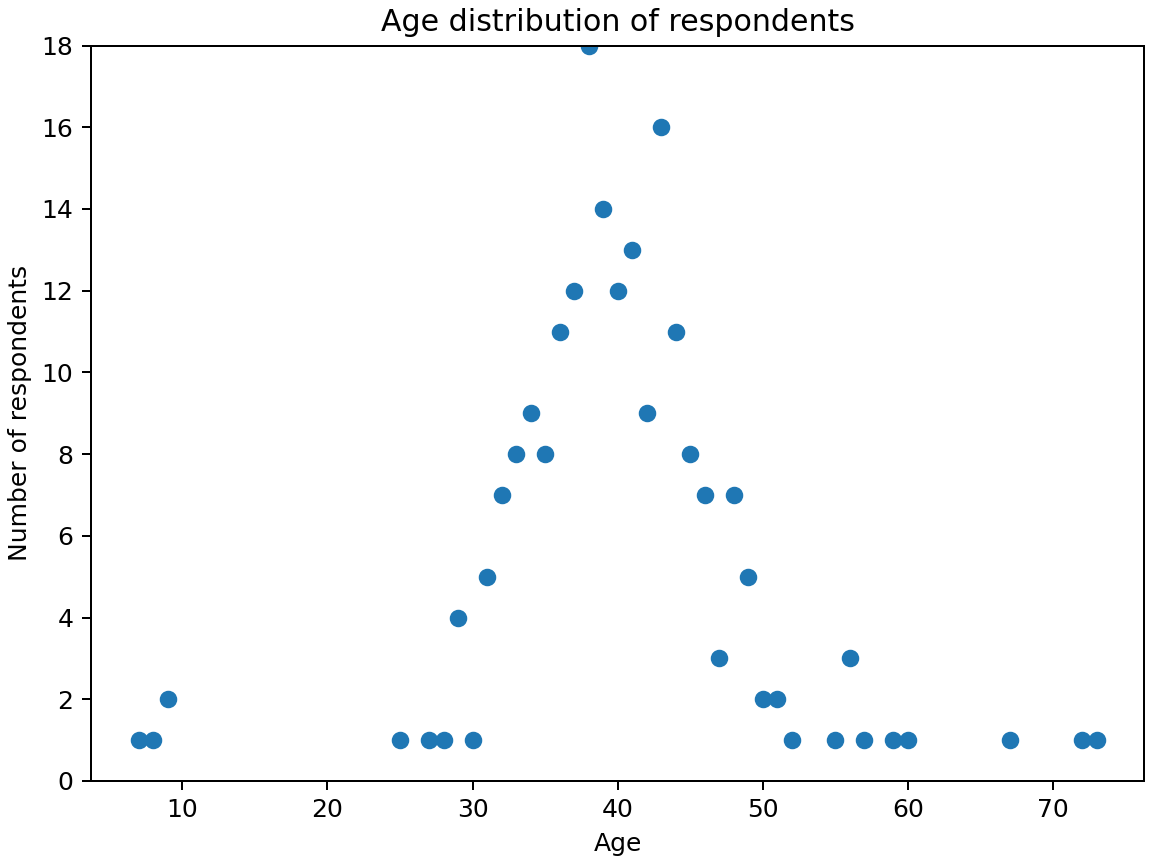
I'm also interested in how people's backgrounds relate to their answers in these scenarios. First, let's look at what demographics we saw. The median respondent was 40 when they filled out the survey:
Most respondents were female (83%), followed by male (13%), and non-binary (5%).
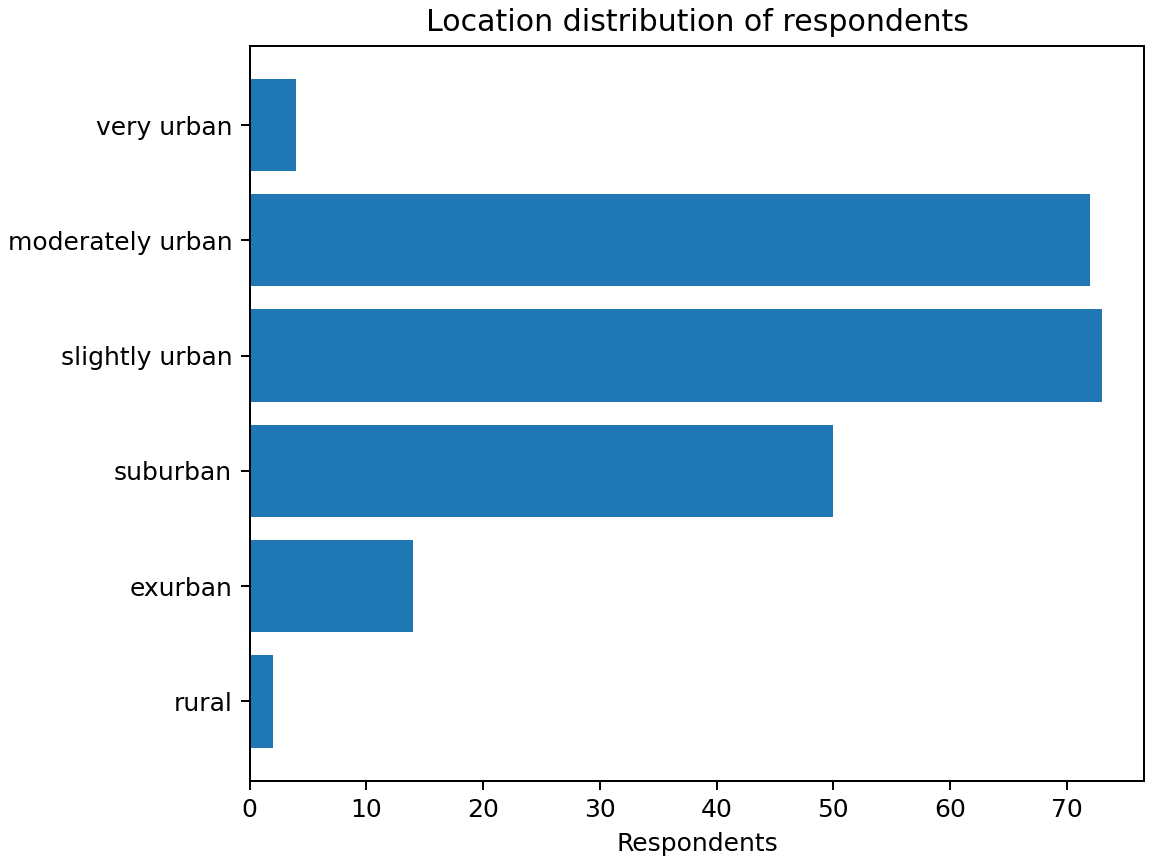
Living in an urban area, most of the people I was able to survey also lived in an urban area:
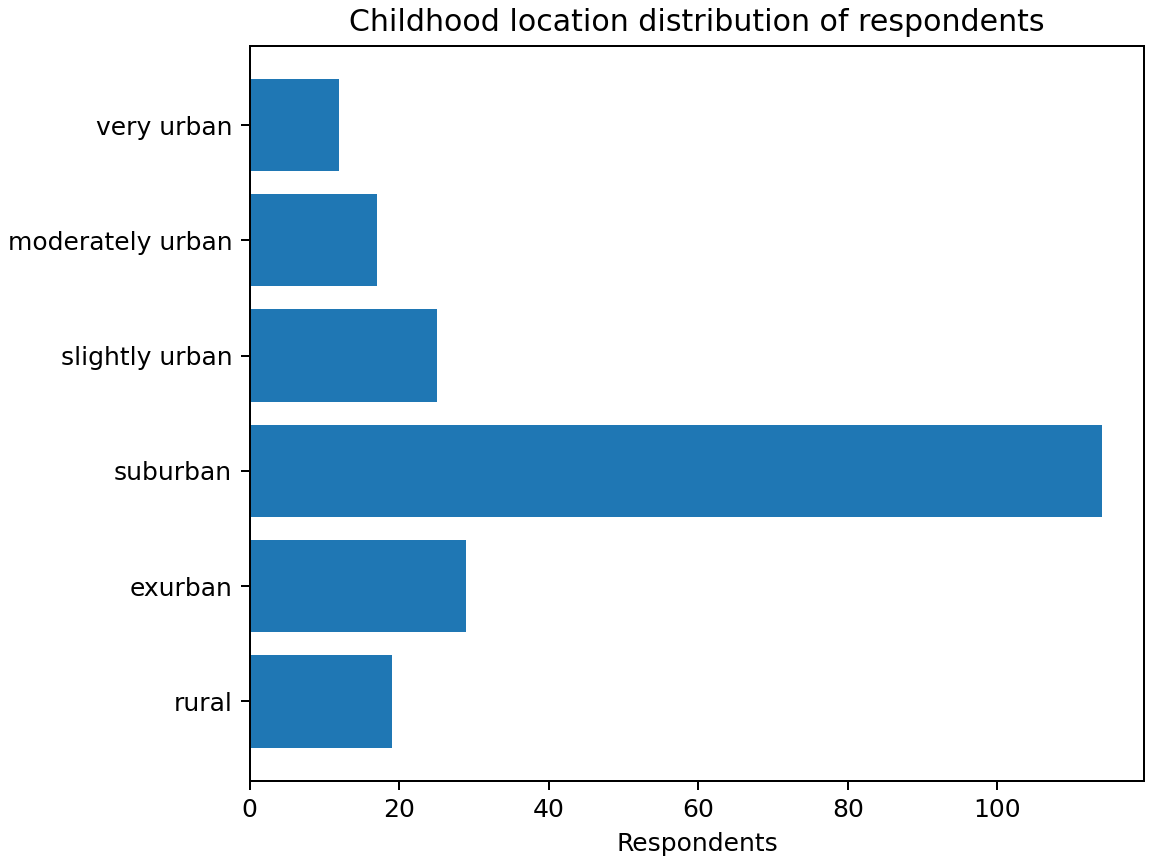
They overwhelmingly grew up in more suburban areas, though:
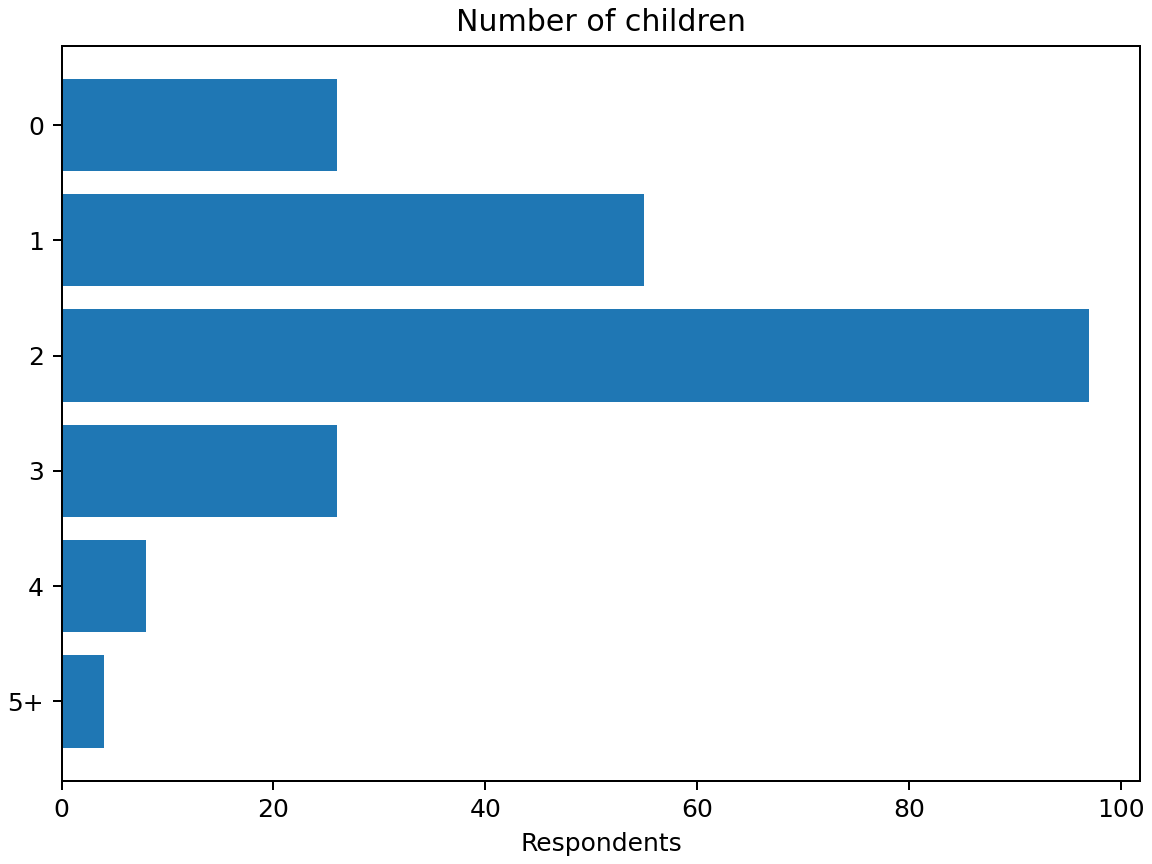
Most respondents were parents (88%) and the most common number of children was 2 (45%):
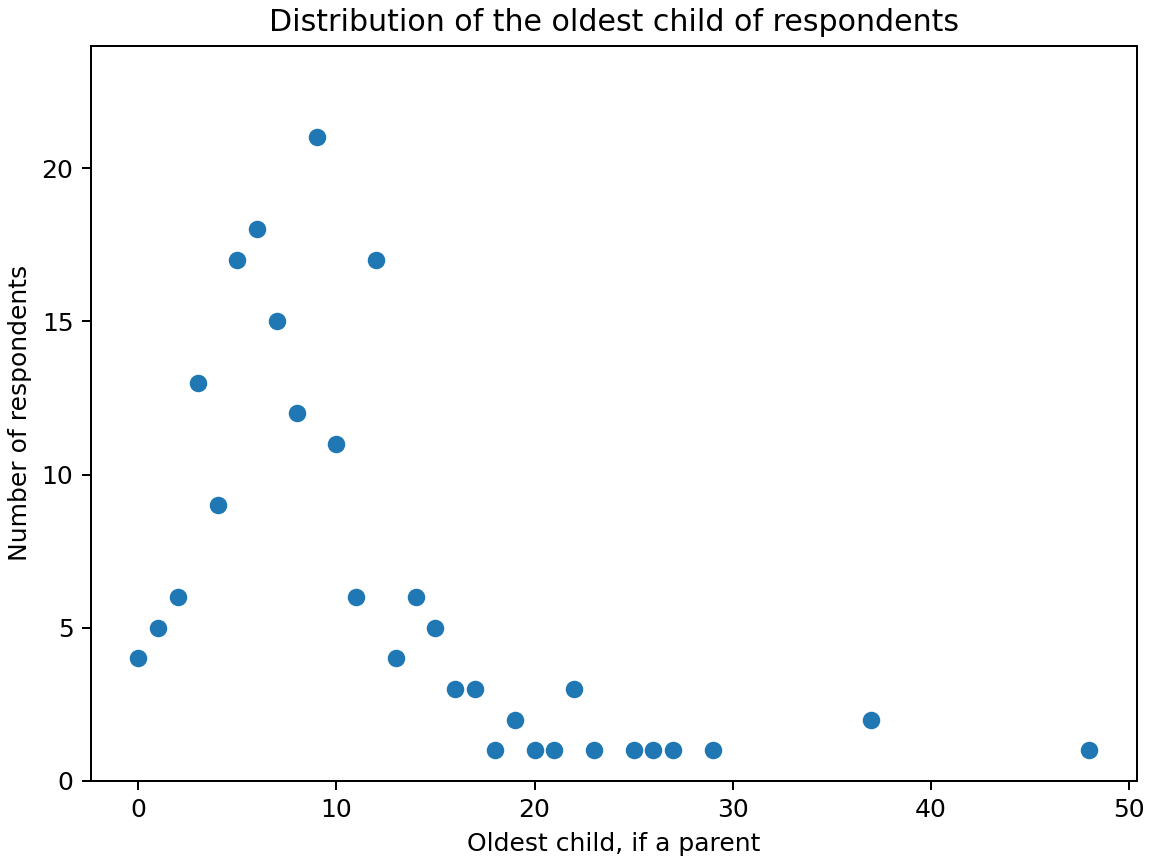
The median parent's oldest child was 8 and most of the parents had an oldest child under 18 (92%), but there were a few parents of grown children:
So, how do these demographics interact with what sorts of ages people gave? Here is how the respondents differed from the mean, in years. For example, a dot at +1y indicates that this respondent on average gave answers one year larger than others. We can see that women generally gave ~1y higher ages than men, with non-binary respondents in between:
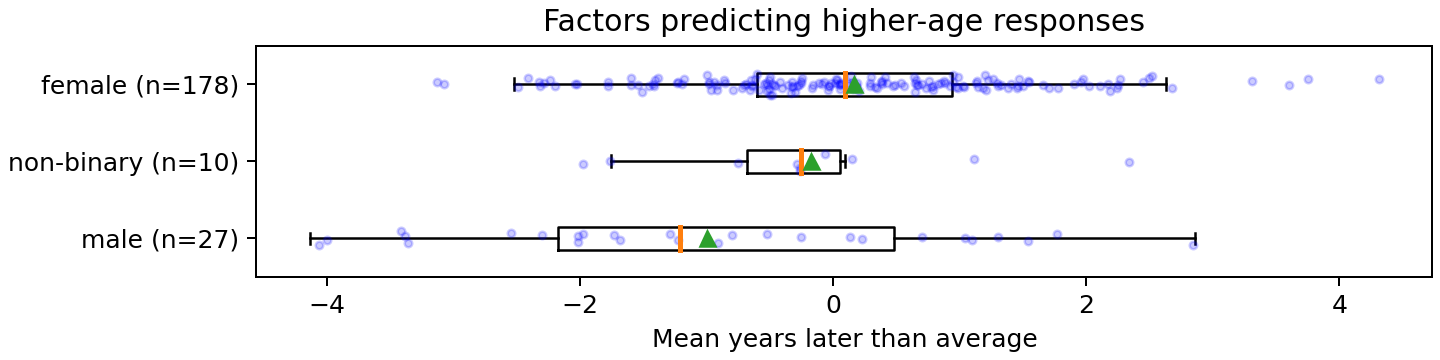
The orange bar is median, green triangle is mean.
Normally you'd use z-scores for this, where the x-axis is "standard deviations away from the mean" but in this case the standard deviations are similar between questions and I think it easier to think about with the x-units in years. This does mean that questions with more variance effectively have a bit more weight in determining how to classify each respondent.
Here's the same chart, but by respondent ages:
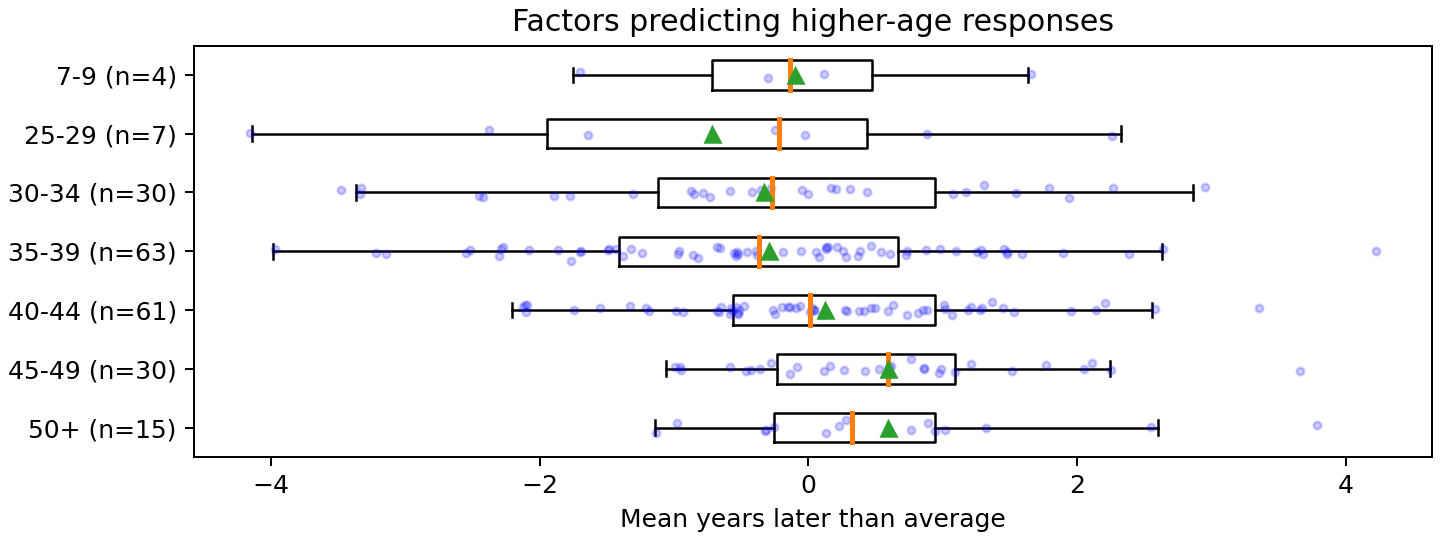
Ignoring the four responses from kids because of the small sample size, it looks like older people generally gave higher ages. I don't know if this is because they're farther from having kids in the relevant age ranges, have become more conservative over time, or were drawn from a somewhat different population than the younger people in the sample? If we ran this survey decades ago I'd expect to generally see younger ages, so this is a counter-intuitive result!
Here's by location:
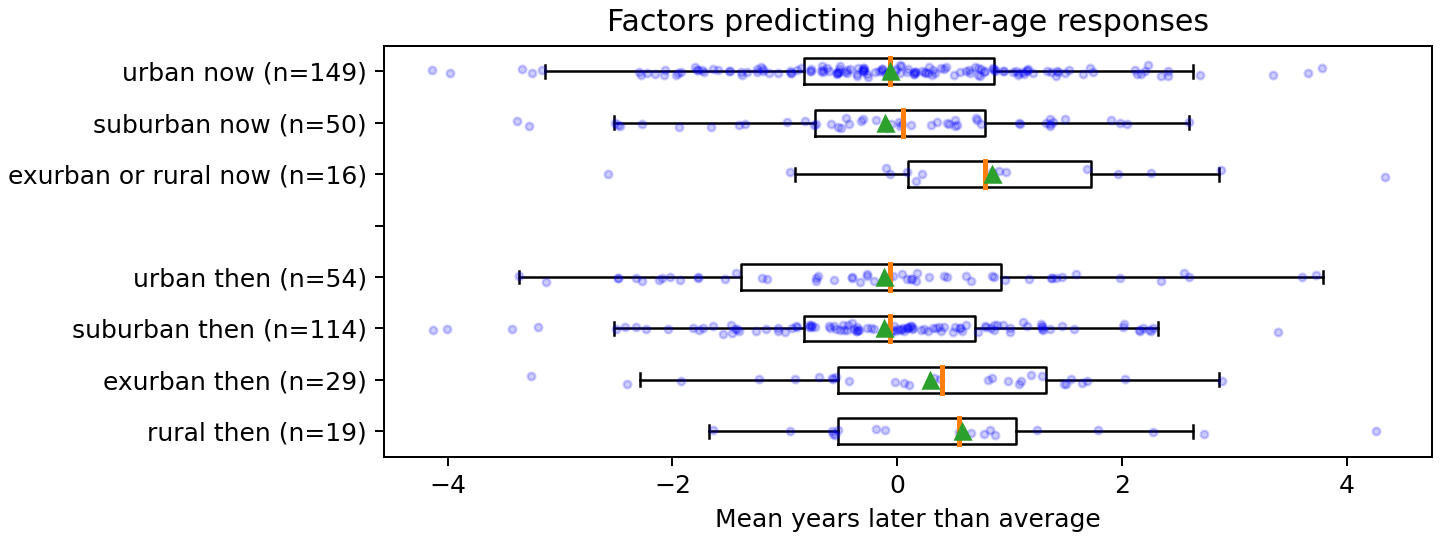
It looks like people who live in exurban or rural areas, generally gave higher ages. This is also a bit counterintuitive: people often think of cities as less safe, so it's a bit surprising that urban respondents (asked specifically about "your area") would give lower ages. Some factors going the other way are that I'm likely mostly surveying relatively rich urban residents who live in relatively safe areas of cities, that parents who think cities are less safe for kids are more likely to move farther from cities? That this mostly matches up with where people grew up makes me guess this is more about parental disposition than about the environments?
Let's compare respondents by their children:
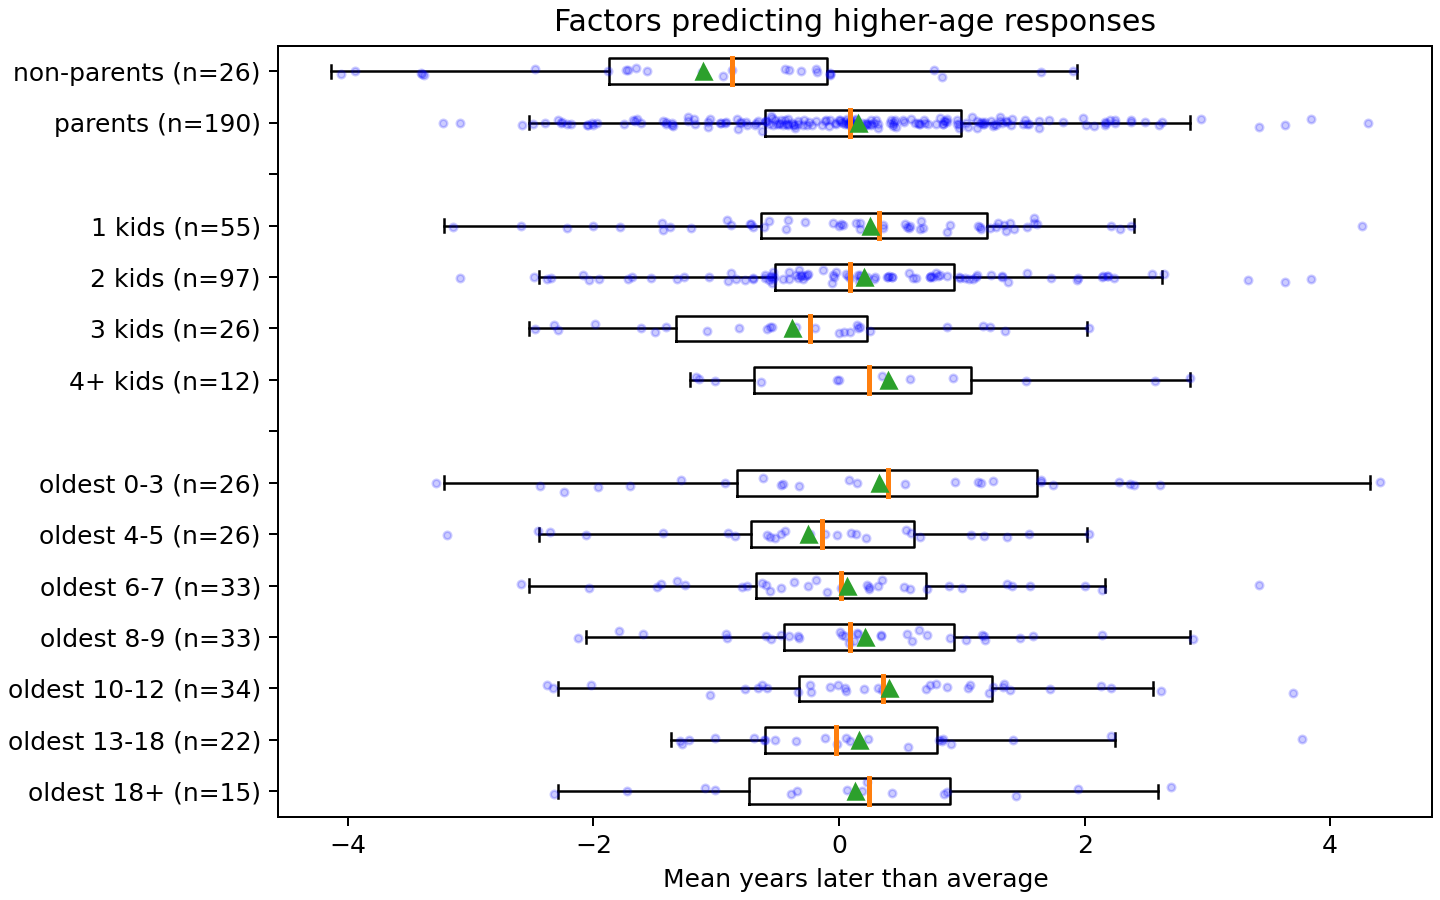
One thing that jumps out immediately is that parents give ~1y higher ages than non-parents. I suspect parents are generally much better calibrated on this: the difference between 7 and 8 can be pretty big, but if you haven't spent much time around people in this age range (and non-parents are much less likely to) your sense won't be very good.
I'm not sure what's going on with the patterns in number of kids—three kids does seem to be pretty different from 1, 2, or 4+ but I can't think of why it would be.
With patterns by oldest-child age maybe there's a small effect in the 4-12 groups where as your kids get older you think kids should be older to do things, but this could be noise: I can't think of why it would reverse for 13+.
The code that generated these charts is on github. If there's another chart you'd be interested to see, let me know!
Appendix: Survey Questions
- Q1: What is your age? [short answer]
- Q2: What's your gender? [Male / Female / Non-binary / Other: ...]
- Q3: How would you describe your area?
- [Very Urban (tall buildings, no driveways)]
- [Moderately Urban (parking is a pain)]
- [Slightly Urban (multi-family housing is common)]
- [Suburban (almost all single-family housing, few places to go without driving)]
- [Exurban (houses widely spaced, you need a car)]
- [Rural (houses very far from other houses)]
- [Other: ...]
- Q4: How would you describe the area where you grew up? (If multiple, where you spent the majority of your time from 5-13) [same options as Q3]
- How many children do you have, if any? [I don't have children / 1 / 2 / 3 / 4 / 5+]
- Q5: How old is your oldest child, if you have one? [short answer]
- In the following questions we describe an activity, and we're interested in at what age you'd guess the typical child in your area could learn to do it without supervision. For example, if you think the typical eight year old could learn to do the given activity unsupervised, you would put "8".
- Q6: Spend fifteen minutes home alone [short answer]
- Q7: Spend three hours home alone [short answer]
- Q8: Spend the night home alone [short answer]
- Q9: Cross a low-traffic street [short answer]
- Q10: Cross a medium-traffic street [short answer]
- Q11: Cross a busy road [short answer]
- Q12: Walk to/from school or a friend's house, assuming they can cross all the streets [short answer]
- Q13: Play in an unfenced backyard [short answer]
- Q14: Play in an unfenced front yard [short answer]
- Q15: Play on the sidewalk in front of their house [short answer]
- Q16: Play at a playground they can walk home from [short answer]
- Q17: Take public transit [short answer]
- Q18: Bike, scooter, or skate around the neighborhood [short answer]
- Q19: Anything you'd like to clarify about your answers above? [short answer]
- We're also interested in the ages you'd guess for an especially mature child (90th percentile) or an especially immature child (10th percentile). For each question, assume the child doesn't have any relevant disabilities. If you thought that a child might be able to learn how to do the given activity unsupervised as early as six or it might be as late as ten, you'd enter your answer as "6-10".
- Q20-Q33: Questions Q6 through Q19 repeat.
- Q34: Where did you hear about this survey? [short answer]
- Q35: Any other comments? [short answer]
Comment via: facebook, facebook
10 comments
Comments sorted by top scores.
comment by Shmi (shminux) · 2023-06-05T03:19:31.534Z · LW(p) · GW(p)
I guess my immediate followup questions are "what age did you personally do X" and "by how many years you think it was too early/too late to do X".
My prediction would be that most parents have a late development bias, where they see their children, or abstract children, less mature than themselves.
Replies from: jkaufman, Morpheus↑ comment by jefftk (jkaufman) · 2023-06-06T12:20:27.974Z · LW(p) · GW(p)
This initially seems like it would be better, but before doing the survey I considered it and decided not to do it because:
-
For a lot of these the age at which you first did it, or would have been ready to do it, is quite low, running into childhood amnesia.
-
Even when it is within a period of your life you remember it's pretty hard, often, to figure out how old you were. Especially, how old you were when you did the first time as opposed to some random time you remember. And even for the latter, it can take some time to connect it to other events and match it up with an age.
-
There are a lot of ones where I would have been ready sooner, and I expect my parents would agree, but it just didn't come up. For example, there were enough people around growing up that I don't think I spent a night home alone before leaving for college.
Your guess about bias maybe right, but I think all three of my children are, so far, more mature and responsible than I was at their ages.
comment by tailcalled · 2023-06-05T07:59:14.478Z · LW(p) · GW(p)
It's too bad you didn't have data by ideology. It seems to me that ideology is quite strongly related to attitudes towards childrens capabilities.
Replies from: jkaufman↑ comment by jefftk (jkaufman) · 2023-06-05T12:28:13.076Z · LW(p) · GW(p)
What question do you wish I'd asked?
Replies from: tailcalled↑ comment by tailcalled · 2023-06-05T20:42:12.981Z · LW(p) · GW(p)
It's a good question. I've usually measured ideology as a side-effect when using a completely different method for running surveys.
Rather than writing all of the questions by myself, I have asked a bunch of people to give me me a bunch of qualitative descriptions of themselves that might be relevant for the survey, and then I've taken those qualitative descriptions and turned them into a large number of fixed-response-set questions, each question capturing a capturing different aspects a qualitative response. When factor-analyzing such a set of questions, usually a political factor pops out.
An equivalent for your case might be to qualitatively first ask a bunch of parents whether there is anything special about their manner of parenting, and then turning whatever they mention into multiple-choice questions.
However this is a lot of work, and it can also result in very long questionnaires that it may be hard to get responses for. So it may not be so practical.
An option may be to just ask a few relevant questions one can think of, e.g.
- Do you think teen girls tend to be overly dramatic?
- Do you think it is more important to teach children respect or independence?
- Do you think parents ought to monitor their children's internet access?
- Do you think schools need to be more or less responsive to parent's wishes about the material that is taught?
... and then create an overall score from that.
Though especially once ideological questions explicitly mention childrearing, it also raises questions about direction of causality. One could sort of handle this by asking about more distal ideological questions such as "Do you vote for Republicans or Democrats?" or "Do you think the government is too big?", but by going further away it also makes it less able to capture ideological factors specific to childrearing.
I don't know what the best option is, given your constraints, especially because I don't know your constraints.
comment by SarahNibs (GuySrinivasan) · 2023-06-05T20:55:26.504Z · LW(p) · GW(p)
Q6: Spend fifteen minutes home alone
5.6 to 9.5?? Average 7.4??? These numbers seem ludicrously high.
Replies from: jkaufman↑ comment by jefftk (jkaufman) · 2023-06-06T02:04:19.236Z · LW(p) · GW(p)
Personally, I put 5y for that one.
comment by Gesild Muka (gesild-muka) · 2023-06-05T16:08:51.864Z · LW(p) · GW(p)
Maybe the questions should have specified gender as most parents intuitively know that girls mature faster and without specifying in the questions the respondents might project their own children's gender on the question. For example, a parent with two daughters might have a different bias when answering the questions than a parent with sons.
comment by EKP · 2024-01-09T04:10:57.699Z · LW(p) · GW(p)
For the results of a different survey, 10 years ago, asking similar questions: https://reason.com/2014/08/20/helicopter-parenting-run-amok-most-ameri
Nearly half of respondents think it should be illegal for a 12 year old to play solo at a park. It's over 2/3 for a 9 year old. Those are tough numbers.