Is Metaculus Slow to Update?
post by SimonM · 2022-03-25T19:44:33.624Z · LW · GW · 9 commentsContents
11 comments
h/t Eric Neyman for causing me to look into this again
On a recent Mantic Monday, Scott Alexander said:
This is almost monotonically decreasing. Every day it’s lower than the day before.
How suspicious should we be of this? If there were a stock that decreased every day for twenty days, we’d be surprised that investors were constantly overestimating it. At some point on day 10, someone should think “looks like this keeps declining, maybe I should short it”, and that would halt its decline. In efficient markets, there should never be predictable patterns! So what’s going on here?
Maybe it’s a technical issue with Metaculus? Suppose that at the beginning of the war, people thought there was an 80% chance of occupation. Lots of people predicted 80%. Then events immediately showed the real probability was more like 10%. Each day a couple more people showed up and predicted 10%, which gradually moved the average of all predictions (old and new) down. You can see a description of their updating function here - it seems slightly savvier than the toy version I just described, but not savvy enough to avoid the problem entirely.
Personally, this has never particularly bothered me. Having watched the odds for many things which behave like this. (Pick any sports game where one side has a large, but not unassailable lead and you'll see this pattern).
That said, I'm also sympathetic to the view that Metaculus forecasts aren't perfect. Whenever I think about how my own forecasts are made, I'm definitely slow to update, especially if it's something I don't follow very often. If a question gets lots of interest and catapults to the front page, I'm liable to update then, and usually it's going to be in the direction of the crowd. Is this enough to make the forecasts predictable? (Which would be bad, as Scott says!)
One metric to look at when deciding if forecasts are predictable is to check whether or not the change in forecasts correlated from day to day. (ie if our forecasts increased 1% yesterday, are they more likely to increase tomorrow or not?).
Everything which follows is based on the community prediction (median forecast) which is visible to the public at all times.
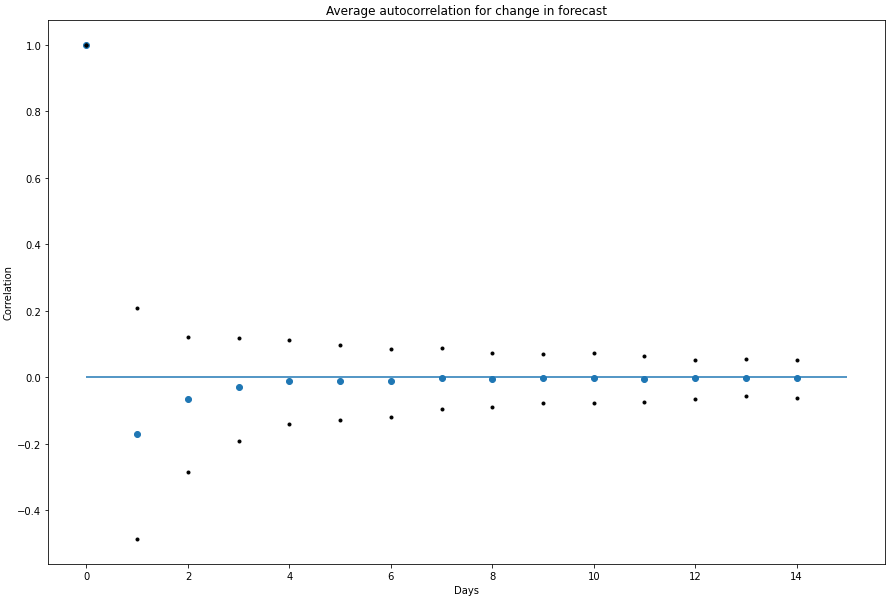
Looking across ~1000 binary questions on Metaculus, we actually see the opposite of the "momentum" that Scott talks about. In general, if a question increased 1% yesterday, we should expect it to fall today.

What's going on here? Well my theory upon seeing this (after checking that I hadn't made any dumb mistakes) was that forecasts were slightly noisy and that makes them slightly mean-reverting. When looking at some of the most egregious examples of this that definitely looked like the case.
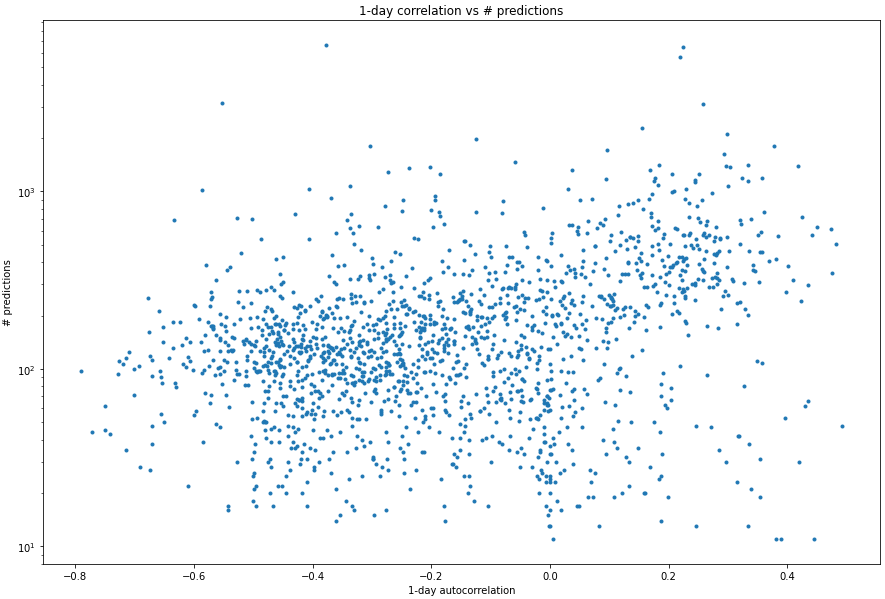
One way we might be able to check this hypothesis is to look at the "better" forecasts (more predictors, more predictions) and see if they have higher autocorrelation...

... and yes, sure enough that does seem to be the case. For questions with fewer predictions they are more likely to have negative autocorrelation (mean-reverting) behaviour. The largest questions do seem to have at least some auto-correlation. (Eyeballing it, I would guess maybe ~.1 is a fair estimate?)
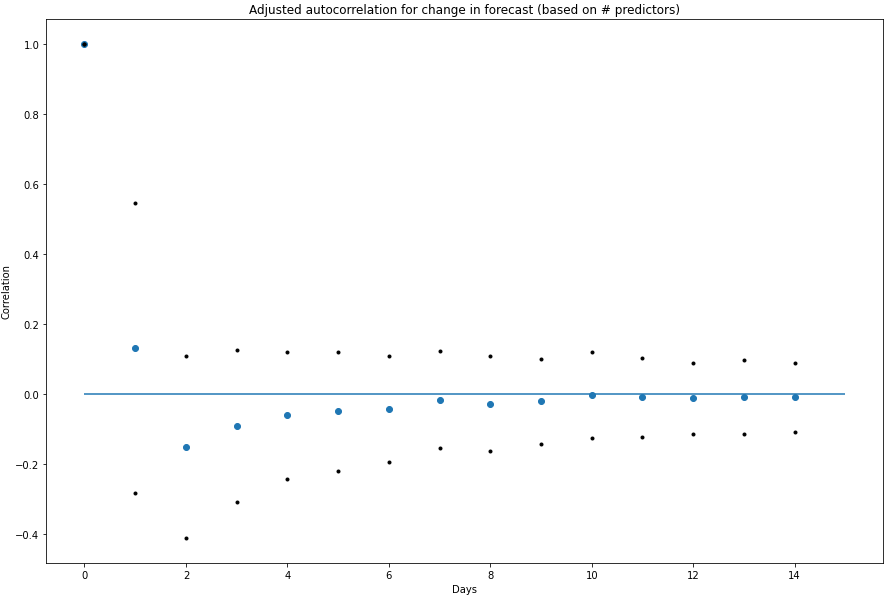
To make this concrete (and find out over what time horizon Metaculus is 'predictable'), I ran the same exercise, across 1-day, 2-day, etc autocorrelations, fitted a regression and took a point with a 'large' number of predictors. My adjusted autocorrelation chart looks as follows:

My takeaways from this are:
- Metaculus exhibits some slight momentum over a 1-day time horizon (although noise in the smaller questions dwarfs it)
- Over 2-days, this effect is nil, and in fact forecasts are slightly mean reverting
- My confidence that this applies to any specific question is pretty low
On the whole, I think this is pretty positive for Metaculus - I had to torture the data to show some very slight momentum, and even then I'm not completely convinced it exists.
9 comments
Comments sorted by top scores.
comment by TLW · 2022-03-27T05:33:33.941Z · LW(p) · GW(p)
Consider the following market: 'I roll a d10 once per day. Will I roll a 0 within the first 10 days from when this market starts?'.
Now consider what happens if I don't actually roll a 0:
Day 0, this market's value is ~65%
Day 1, this market's value is ~61%
Day 2, this market's value is ~57%
Day 3, this market's value is ~52%
Day 4, this market's value is ~47%
Day 5, this market's value is ~41%
Day 6, this market's value is ~34%
Day 7, this market's value is ~27%
Day 8, this market's value is ~19%
Day 9, this market's value is ~10%
Day 10, this market's value is ~0%
The market is purely rational, and yet the market shows a monotonic decrease over time (effectively, due to survivorship bias). What am I missing here, that this sort of monotonic movement is unexpected?
Replies from: TLW↑ comment by TLW · 2022-03-27T05:50:05.205Z · LW(p) · GW(p)
As an aside, I am also surprised why people seem to consider this unexpected for financial markets and stocks.
If a company has an X% chance of ruin / day over a fixed time period, you end up with exactly the same sort of rational monotonic movement so long as said ruin doesn't happen.
Replies from: MichaelDickens↑ comment by MichaelDickens · 2022-03-28T19:07:07.221Z · LW(p) · GW(p)
You see this sort of thing with acquisitions. Say company A is currently priced at $100, and company B announces that it's acquiring A for $200 per share. A will jump up to something like $170 per share, and then slowly increase to $200 on the acquisition date. The $30 gap is there because there's some probability that the acquisition will fall through, and that probability decreases over time (unless it actually does fall through, in which case the price drops back down to ~$100).
comment by Scott Alexander (Yvain) · 2022-03-27T07:37:28.828Z · LW(p) · GW(p)
Thanks for looking into this.
comment by nikos (followtheargument) · 2022-05-24T15:41:05.307Z · LW(p) · GW(p)
This looks really cool! And it would be nice to get some version of this (or at least a link to it) on the Forecasting Wiki.
comment by Mike Bishop (MichaelBishop) · 2022-04-22T16:44:20.532Z · LW(p) · GW(p)
Thanks for looking into this. Did you happen to model this in log-odds space?
Replies from: SimonM↑ comment by SimonM · 2022-04-22T17:19:22.000Z · LW(p) · GW(p)
No - I think probability is the thing supposed to be a martingale, but I might be being dumb here.
Replies from: 52ceccf20f20130d0f8c2716521d24de↑ comment by 52ceccf20f20130d0f8c2716521d24de · 2022-06-15T09:21:32.701Z · LW(p) · GW(p)
Just to confirm: Writing , the probability of at time , as (here is the sigma-algebra at time ), we see that must be a martingale via the tower rule.
The log-odds are not martingales unless because Itô gives us
So unless is continuous and of bounded variation (⇒ , but this also implies that ; the integrand of the drift part only vanishes if for all ), the log-odds are not a martingale.
Interesting analysis on log-odds might still be possible (just use and for discrete-time/jump processes as we naturally get when working with real data), but it's not obvious to me if this comes with any advantages over just working with directly.