"The Holy Grail" of portfolio management
post by Alexei · 2020-08-22T04:25:55.199Z · LW · GW · 7 commentsContents
    Having uncorrelated return streams in your portfolio drastically lowers the volatility of your portfolio.
  What's so good about low portfolio volatility?
  Low volatility allows for leverage
  How do you get uncorrelated strategies?
  What does this mean for money managers?
  Caveats
None
7 comments
TL;DR: Bayes' Theorem : Rationality :: Uncorrelated returns : Investing
Recently I gave a talk on EMH: https://www.lesswrong.com/posts/3TiEZzw4ikneLGp4J/dissolving-the-is-the-efficient-market-hypothesis-dead [LW · GW]
In there I had a bonus slide about what I call the "Efficient Market Frontier" (EMF). May be there's an existing name for it; I couldn't find it. (EMF is not to be confused with the efficient frontier, which is a common term in finance but talks about portfolio optimization.) But before we can talk about it in the upcoming post, I want to set up one very important bit of context regarding portfolio management.
Having uncorrelated return streams in your portfolio drastically lowers the volatility of your portfolio.
Here is Ray Dalio, founder of Bridgewater, one of the largest hedge funds, talking about this: https://www.youtube.com/watch?v=Nu4lHaSh7D4. And here is a screenshot out of his book, Principles:
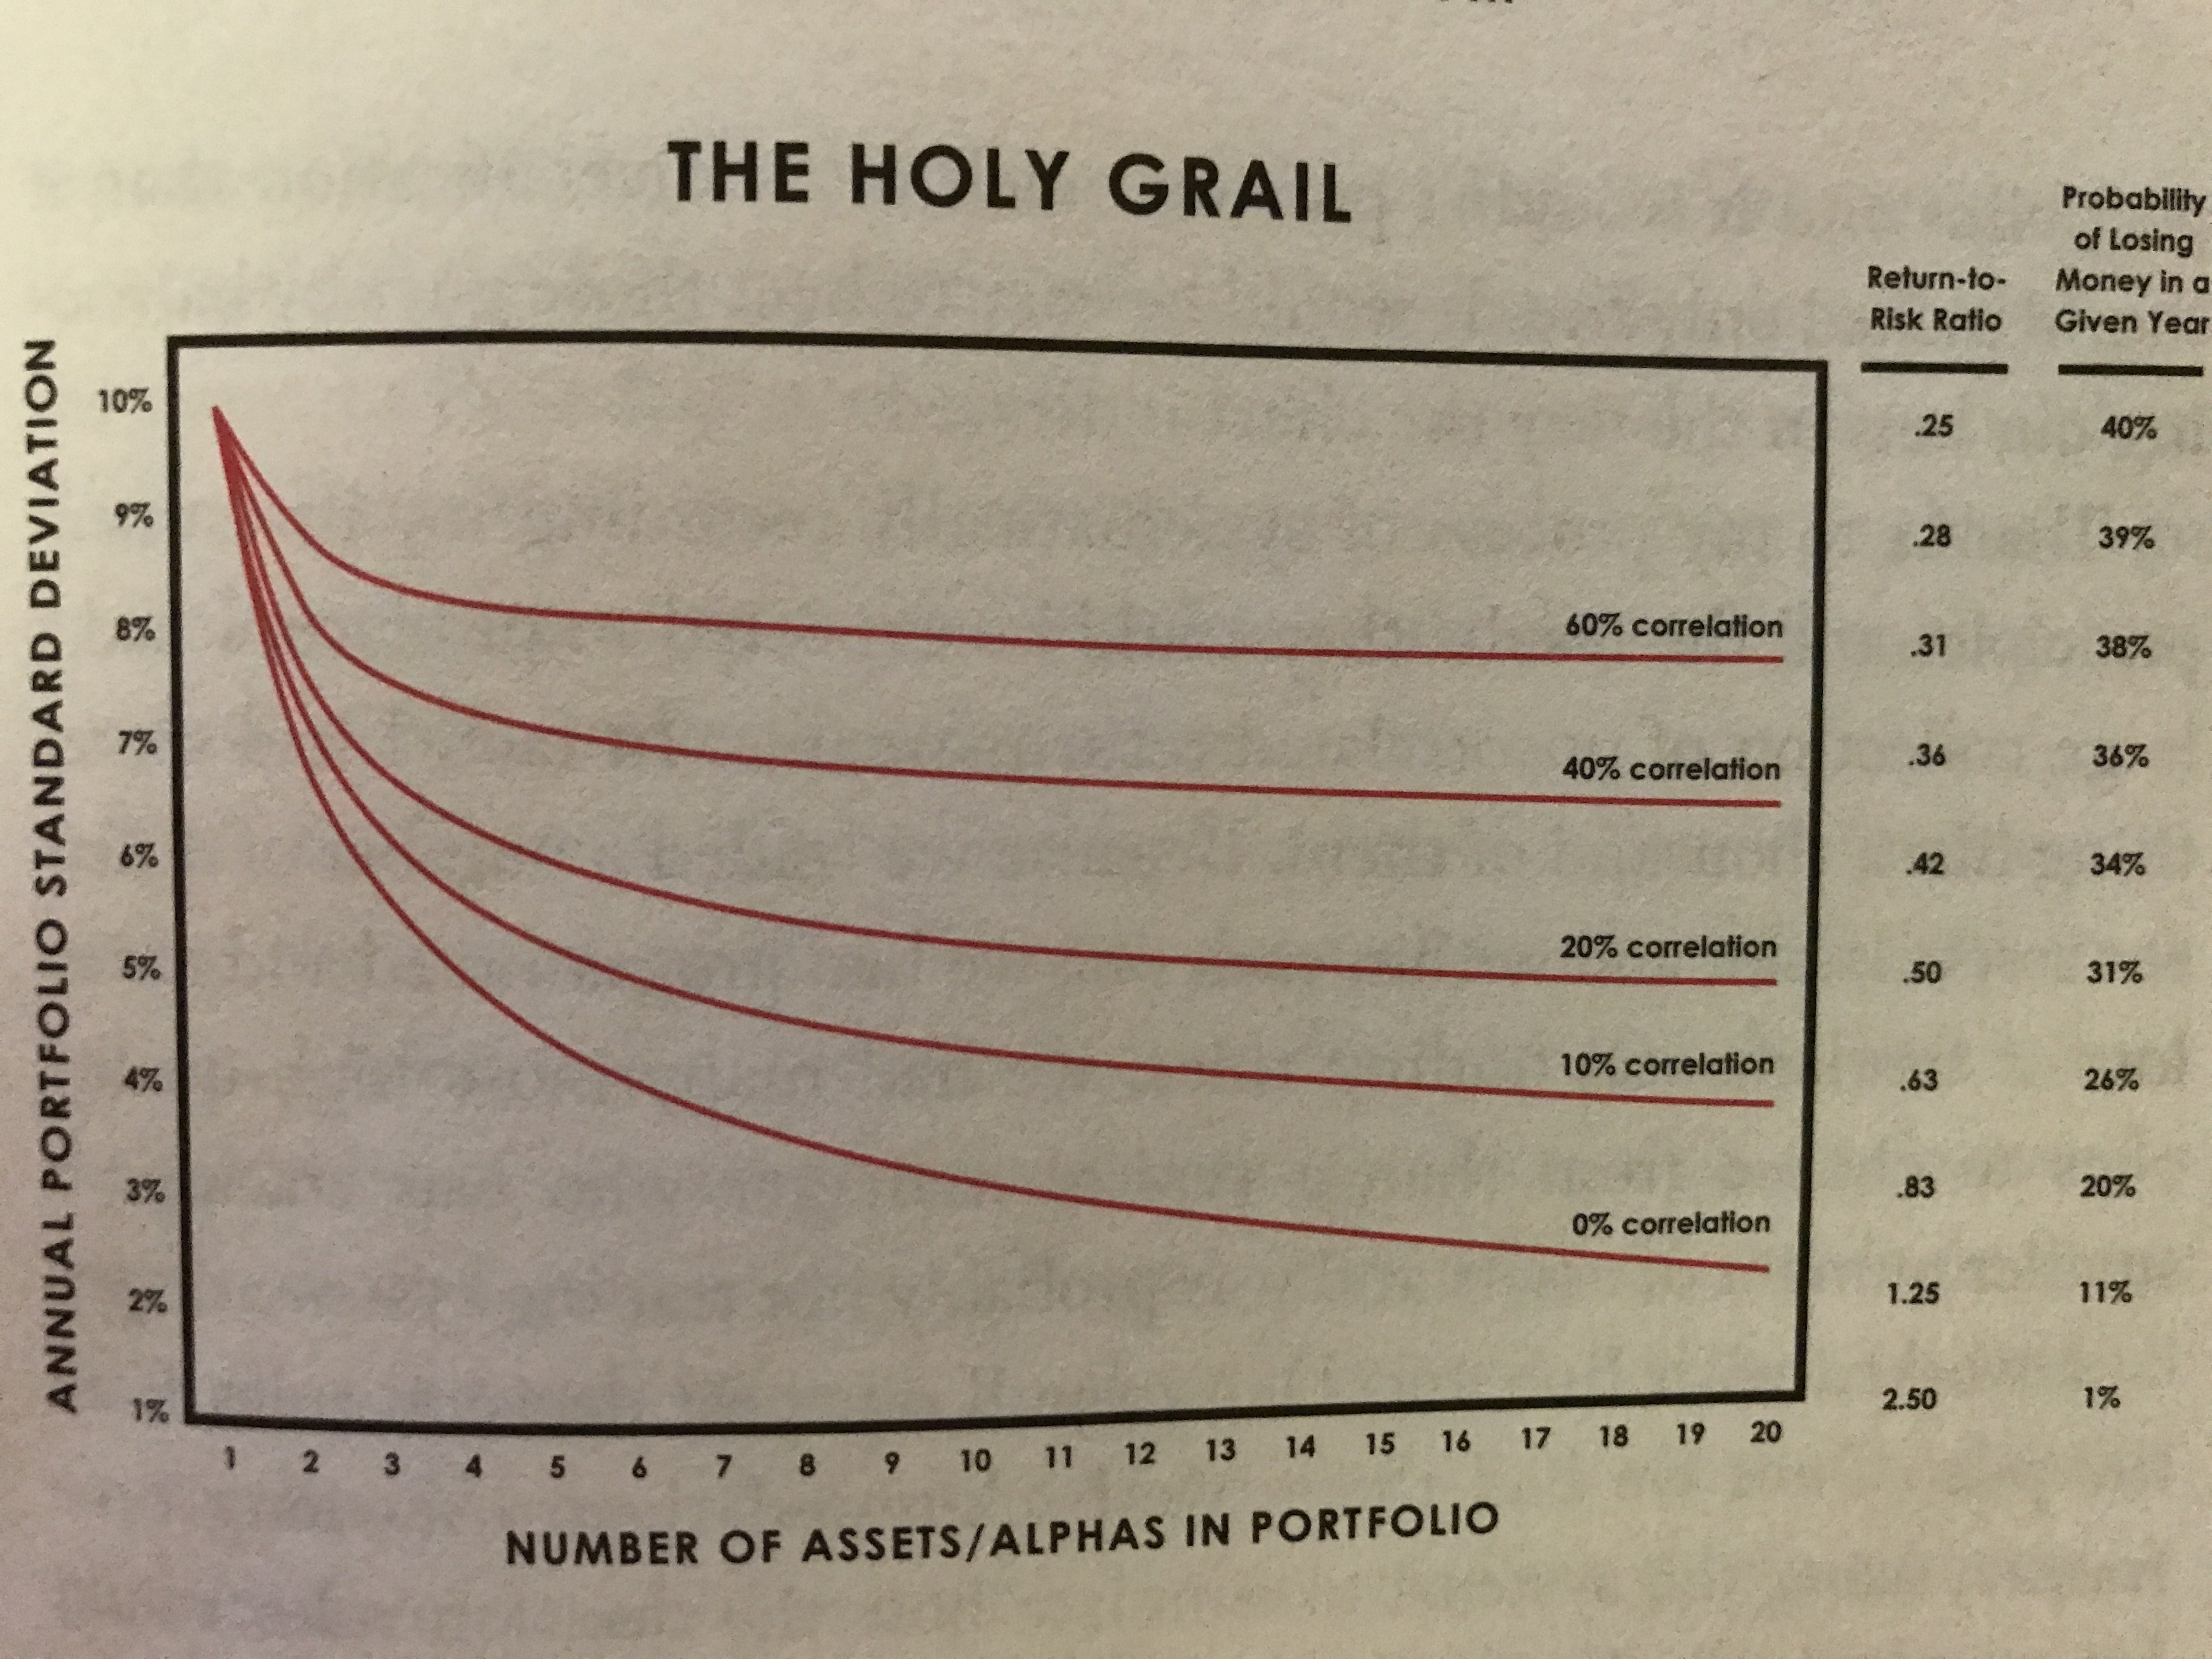
X-axis is the number of uncorrelated assets in the portfolio, y-axis is the annual portfolio standard deviation which converts into useful metrics like the probability of losing money in a given year. The graph is saying the same thing as above: when you have more uncorrelated assets (or strategies), the volatility of your portfolio will be lower. But if the assets are even somewhat correlated that drastically reduces their effectiveness.
He refers to this concept as The Holy Grail and I agree. This is the most important concept I seared into my core after being immersed in finance for a few years.
What's so good about low portfolio volatility?
Let's say I give you a trading strategy that is very good at making money. You trust me and you trust the strategy. You follow the strategy and buy some sugar beets. The price of sugar beets plummets 90%. How do you feel? Do you hodl and have faith? Or do you reassess your trust in me and the strategy?
Thankfully, the price recovers, and the strategy tells you to sell. You make a cool 10% profit. Is this a good strategy? Well, we can't tell yet because we only had one trade. That's some evidence of strategy's efficacy, but we'll need a lot more trades before we're certain. Okay, but is the trade itself good? Well, yes and no:
1) Yes, the trade made you money in the end.
2) No, the trade could have clearly been better. You should have bought sugar beets after the price fell. (Or shorted them and covered at the bottom for a 90% profit.)
3) No, the trade was scary because its volatility (or drawdown) made it very hard to stick to it.
Now imagine this strategy is your entire portfolio. There's no way you could stomach this kind of volatility. You'd probably just exit the market entirely way before you lost 90% of your money.
However, if you add a large number of such strategies together, then the drawdowns will cancel each other out. While one strategy is losing 90% the others are making you 10%. If you have enough of them, then overall you'll have smooth returns.
So you can take a lot of bad strategies that make money and make a good one by combining them, as long as they are uncorrelated. (The bottom red curve on the graph.) If there's a 60% correlation between the strategies (top red curve) then you'll need a much larger number of such strategies or it might even be impossible. (E.g. it takes 2 uncorrelated strategies to do the job of 20 60% correlated strategies. But the relationship is not linear. There is no number of 60% correlated strategies you can have that will do the job of 3 uncorrelated ones.)
Low volatility allows for leverage
Okay, so let's say you combined a bunch of strategies and most of the time your portfolio goes down only 1% before it recovers. It also looks like on average you're making 10% per year.
Well, now you have an interesting option: do you want to continue making the relatively safe annual 10% or are you willing to stomach a bit more risk for higher returns? 2x leverage will give you 20% annually with a 2% drawdown. 4x: 40% with 4%. 4% drawdown seems pretty sensible. You wouldn't panic cancel your strategy. And getting 40% a year sounds much nicer than 10%.
Leverage is used quite often. For example, Renaissance, one of the most long term successful hedge funds, uses leverage in the range of 17x. Because their underlying strategy has such low volatility they can scale it up 17x and still have a very palatable risk profile. (Their Medallion fund averaged 66 percent [per year] before fees during the period from 1988 to 2018.)
How do you get uncorrelated strategies?
To help our intuition a bit we can model a strategy's returns as: ⍺ + β * market returns. ⍺ is alpha, hence the "number of alphas" text on the x-axis above. β is beta. (This formula is simplified, check here if you want to see the actual version.)
⍺ = 0.0, β = 1.0 => We're just holding. Our returns are the same as the market.
⍺ = 0.0, β = -1.0 => We're just shorting the market. Our returns are the opposite of the market.
⍺ > 0.0, β = 0.0 => Our returns are positive and completely uncorrelated with the market.
⍺ < 0.0, β = 0.0 => Our returns are negative and completely uncorrelated with the market.
It is super easy to get β. You just buy an index and hold it. It's not impressive. It's hard to get ⍺. That's what the hedge funds are being paid millions of dollars for.
Note that the term alpha gets used in at least two ways: 1) when talking about uncorrelated returns given a specific market, like I just explained, and 2) when talking about uncorrelated returns in addition to your current portfolio (like in Ray Dalio's graph). In the second case the equation just becomes: ⍺ + β * your portfolio returns. And you're still looking for strategies with ⍺ > 0.0 and β ≈ 0.0.
An additional thing to note is that here we're discussing the average correlation. But in practice you care about the worst case correlation (called systematic risk). For example during a world-wide crisis many people can withdraw their money from all investments into cash. So the assets that were mostly uncorrelated will suddenly become correlated and cause your portfolio to have a much higher volatility (drawdown) than you might expect. And of course that might make you consider exiting your otherwise great strategy, exacerbating the crisis. Worse than that, the average correlation coefficient is not really fixed after the crash either since during most of the time the assets/strategies are uncorrelated. (Question for the audience: do you know of a good way to measure the worst case correlation?)
Some examples (very broad strokes here):
Holding just Google stock: completely not diversified. (Except that it is a little bit because Google holds various stocks + investments.)
Above + Microsoft stock: correlated at the "tech companies" level.
Above + other stocks: correlated at the US stocks level.
Above + bonds: correlated at the US level.
Above + international + commodities (gold, oil): correlated at the world level.
Again, in practice it's not this clean at all. This is just a useful pointer.
What does this mean for money managers?
So if your job is to manage money (yours or someone else's), this is basically the game you want to play: how do you invest in the largest possible number of diversified strategies. As you can see from above, it's a very tricky business because you need to correctly estimate the worst case correlations of these strategies.
As a money manager the unicorn you're always chasing is some strategy that's uncorrelated to your other strategies. Pure alpha. As your portfolio grows more diversified it becomes harder and harder to find.
Note that for any given strategy that exposes you to a particular market, you can also try to find a better strategy. So instead of buying NASDAQ, you might invest in some hedge fund that picks tech stocks. They'll be very correlated to NASDAQ (high beta), but hopefully will add a bit of extra juice (alpha). In practice we often see that it's hard to do that consistently. And the benefit you get is usually not that large. May be you make 10% instead of 7% per year for this particular market. But if you can find even one more uncorrelated strategy you might be able to leverage your entire portfolio to make that much anyway.
By the way when a hedge fund does 7% in a year while NASDAQ does 10%, it's not fair to automatically say that the fund has underperformed. It's not even fair to say it if they only trade NASDAQ stocks. You have to know the hedge fund's alpha and beta relative to other strategies! If their beta was around 1.0 and alpha was low or negative then they sucked since they basically did what the market did but may be less well. If their beta was around 0.0 then you could have invested in NASDAQ and the hedge fund and had two uncorrelated return streams.
Caveats
Occasionally you might have an option to have an extremely good investment. (Let's say you just knew what crypto was going to explode in 2017.) In that case it doesn't make sense to diversify much. You bet close to Kelly [LW · GW].
If you have a few great stock picks, then further diversification with stocks will just reduce your edge. In that case consider shorting the index (thus effectively setting β = 0.0) along your investment. Your returns will be proportionate to how well the stocks you picked do relative to that market, which is likely to be less correlated to your other investments. I think a large part of how good hedge funds break from the mold is how they construct their trade to zero in on the particular bet they want to make, while hedging out all other risk.
And of course if you just diversify to the max you're just betting on the market. In that case you can't expect to do better than the average, but that could be okay too.
(Another post in a few days!)
7 comments
Comments sorted by top scores.
comment by Magee · 2020-08-23T11:37:30.137Z · LW(p) · GW(p)
One thing to note is that volatility / standard deviation can be measured over many different time horizons and assumptions.
Is it annualized standard deviation that matters? Semi-annualized? Do you take daily measurements and scale up? Weekly? Annual only? How many time periods do you need to really know an accurate number?
Here is a paper from Andrew Lo on the statistics relating to this. https://www.researchgate.net/publication/228139699_The_Statistics_of_Sharpe_Ratios. "I find that the annual Sharpe ratio for a hedge fund can be overstated by as much as 65 percent because of the presence of serial correlation in monthly returns"
Another thing you need to be careful of, is all of this implies frequent rebalancing!
Let's say I am investing for 10 years and I want to put half my money into a 10 year bond, and half into a stock market index. It doesn't matter what their correlations are, I didn't actually achieve any real benefit if I didn't rebalance between them and then withdrew on the same day at the end of the 10 years. My compound annual growth rate was the same whether their correlation was +1.0 or 0.0 or -1.0. This is what people intuitively understand. In the long run, carry and the actual value of their investment is more important than year-to-year fluctuations. My 10 year bond returned exactly what it was supposed to, regardless of what the fluctuations of its price were.
I prefer to think about my investments in terms of a sustainable withdrawal rate. If my investments pay me 15% dividends per year, I don't need to particularly worry about the price of the instruments. I would rather have $100K of investments paying a sustainable profit of $15K annually, over $500K investments paying only a sustainable profit of $10K.
To me, the holy grail in investing isn't being diversified. It's finding things where it is a good idea to be UNDIVERSIFIED. I'd take 5 businesses which are undervalued, over the index any day.
The volatility and correlations of instruments are simply whatever happens to be in fancy at the time. Whatever two people (the buyer and the seller) agree to. Thus the worst case scenario is a pretty wide range. Correlations probably go to 1.0, and drawdowns can be anywhere, up to 80% (see the great depression), and this isn't necessarily the worse case scenario either. Thus safe leverage over long time horizons is probably in the region of zero. This is known as "stochastic market efficiency". https://breakingthemarket.com/stochastic-efficiency-is-real-and-its-spectacular/
Imagine that [optimal leverage] > 1 in our model market. This would mean that the simple strategy of borrowing money to buy stock will achieve faster long-run growth than buying stock only with our own money. If we associate putting all our money in stock, [optimal leverage]= 1, with an investment in the market, then it would be a trivial matter for us to beat the market (by doing nothing more sophisticated than investing borrowed money). Similarly, imagine that [optimal leverage] < 1. In this scenario, the market could again be beaten very easily by leaving some money in the bank (and, if [optimal leverage] < 0, by short selling).
It would strain language to consider our market efficient if consistent out-performance were so straightforward to achieve. This suggests a different, fluctuations-based notion of market efficiency, which we call stochastic market efficiency: it is impossible for a market participant without privileged information to beat a stochastically efficient market simply by choosing the amount he invests in stock, i.e. by choosing his leverage.
Overall leveraging up won't actually improve your long run returns (unless you actually have an edge). As people often misunderstand.
Replies from: Alexei, ffolgueiro↑ comment by ffolgueiro · 2020-08-29T20:35:26.382Z · LW(p) · GW(p)
To me, the holy grail in investing isn't being diversified. It's finding things where it is a good idea to be UNDIVERSIFIED. I'd take 5 businesses which are undervalued, over the index any day.
Well, for sure. If only.
The holy grail is diversifying assuming market efficiency.
comment by Wei Dai (Wei_Dai) · 2020-08-22T08:25:44.158Z · LW(p) · GW(p)
Recently I started thinking that it's a good idea to add short positions (on individual stocks or call options) to one's portfolio. Then you can win if either the short thesis turns out to be correct (e.g., the company really is faking its profits), or the market tanks as a whole and the short positions act as a hedge. I wrote about some ways to find short ideas in a recent comment [LW(p) · GW(p)].
Question for the audience: do you know of a good way to measure the worst case correlation?
Not sure if this is the best way, but I've just been looking at the drawdown percentage from the Feb top to the March bottom of each asset.
Replies from: Wei_Dai↑ comment by Wei Dai (Wei_Dai) · 2020-09-12T16:58:18.091Z · LW(p) · GW(p)
I have changed my mind about shorting stocks and especially call options. The problem is that sometimes a stock I shorted rises sharply on significant or insignificant news (which I didn't notice myself until the price already shot up a lot), and I get very worried that maybe it's the next Tesla and will keep rising and wipe out all or a significant fraction of my net worth, and so I panic buy the stock/options to close out the short position. Then a few days later people realize that the news wasn't that significant and the stock falls again. Other than really exceptional circumstances like the recent Kodak situation, perhaps it's best to leave shorting to professionals who can follow the news constantly and have a large enough equity cushion that they can ride out any short-term spikes in the stock price. I think my short portfolio is still showing an overall profit, but it's just not worth the psychological stress involved and the constant attention that has to be paid.
comment by PatrickDFarley · 2020-09-24T03:11:03.839Z · LW(p) · GW(p)
In that case consider shorting the index (thus effectively setting β = 0.0) along your investment
Is this assuming you already have other investments with high beta, and you just don't want more beta with your new stock pics?
Replies from: Alexei