Quantifying Household Transmission of COVID-19
post by Owain_Evans · 2020-07-06T11:19:34.047Z · LW · GW · 4 commentsContents
  Overview
  Key Results
  Highlights from Slide Show
None
4 comments
Overview
If someone in your household gets COVID-19, how likely are you to get infected? Is it possible to reduce this risk with interventions? How much of all transmission is between members of the same household? Is household transmission less bad because infections in the household don’t spread to the outside?
We (Mihaela Curmei, Andrew Illyas, Jacob Steinhardt [LW · GW]and Owain Evans) wrote an academic paper on these questions. Owain made an informal slide show with the same material. The full version (34 slides) is here, and this LW post contains some highlights.
Key Results
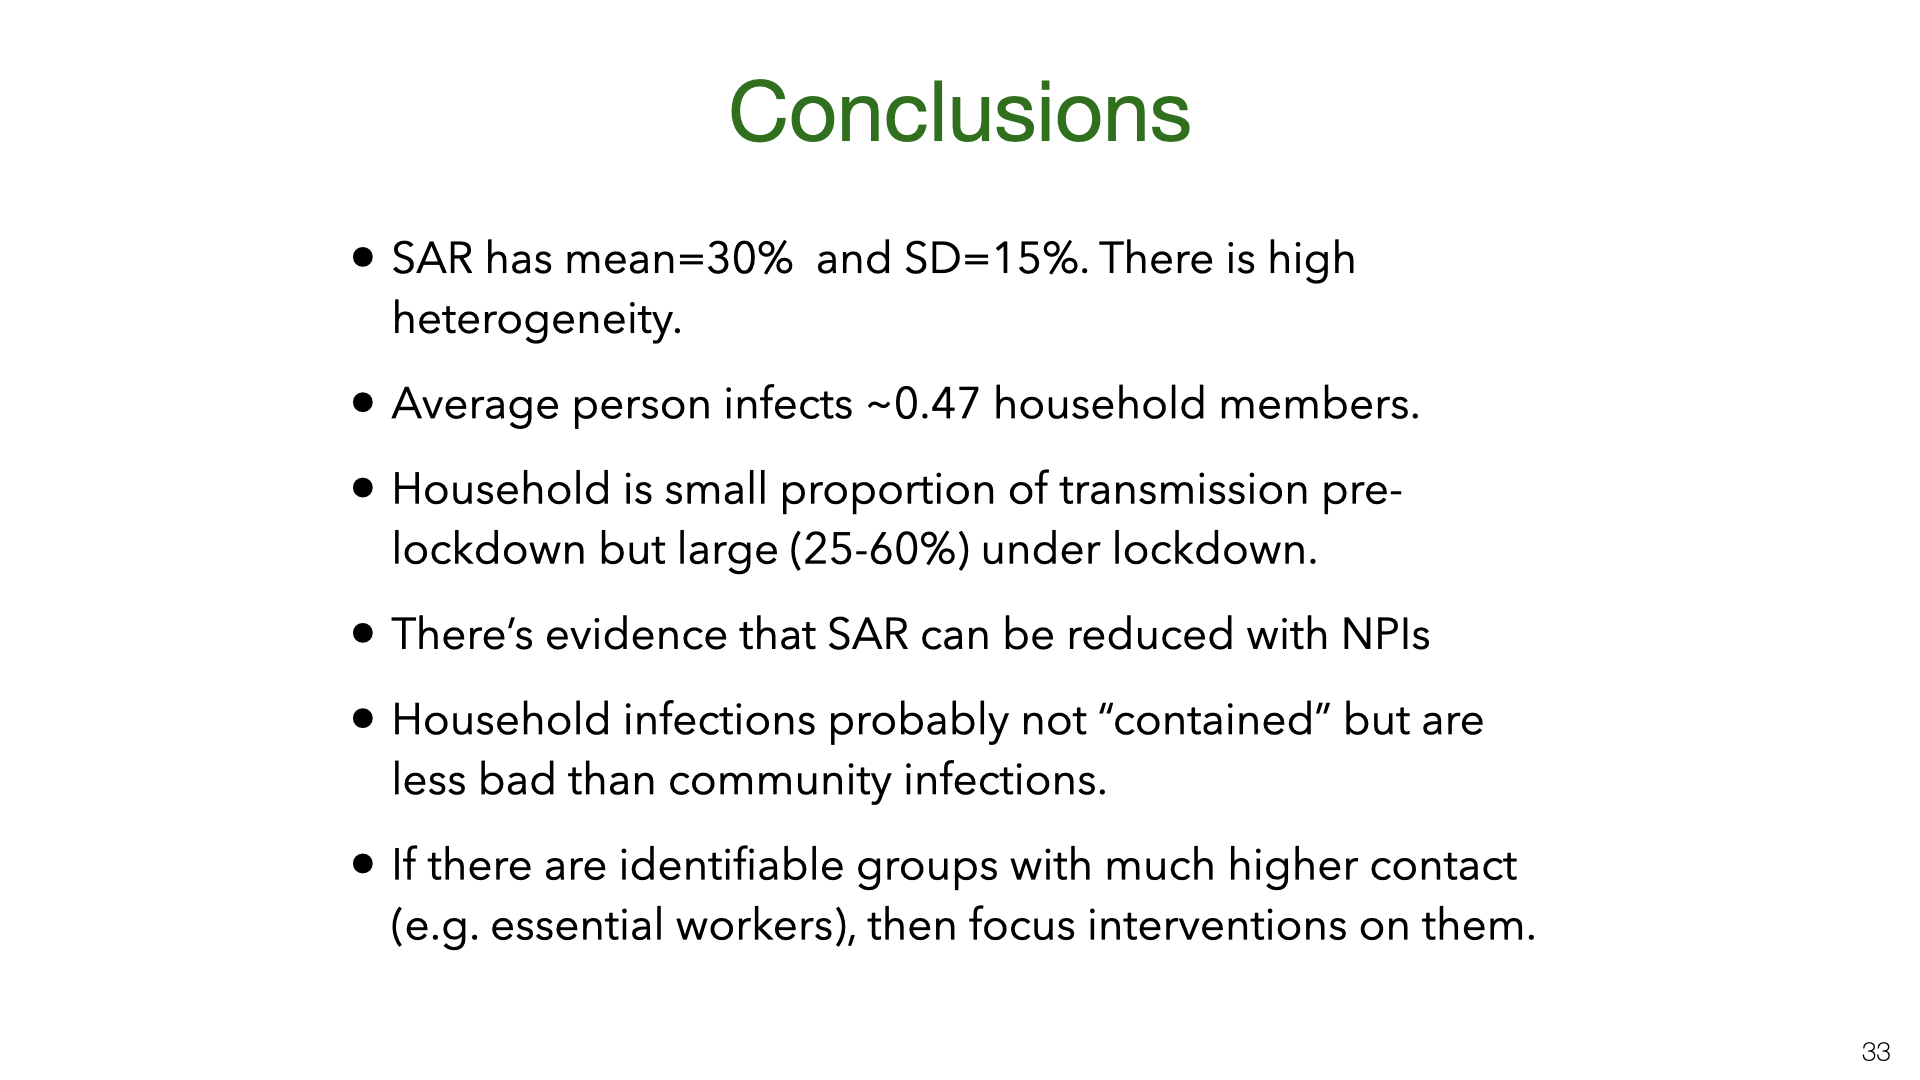
We show how to adjust previous estimates of household transmission to correct for inaccurate testing and selection bias. We pool existing data using a Bayesian meta-analysis and estimate the chance of being infected by an infected household member as 30% (95% CI 18%-43%). This probability is heterogeneous across studies, with a standard deviation of 15% (9%-27%). Household transmission was likely a small fraction of transmission before social distancing (5%-35%) but a large fraction (30%-55%) after. Our results and observational studies suggest household transmission can be reduced with behavioral interventions. It is uncertain how much infections in households spread to the outside, but we show this is related to the effectiveness of contact tracing.
Highlights from Slide Show
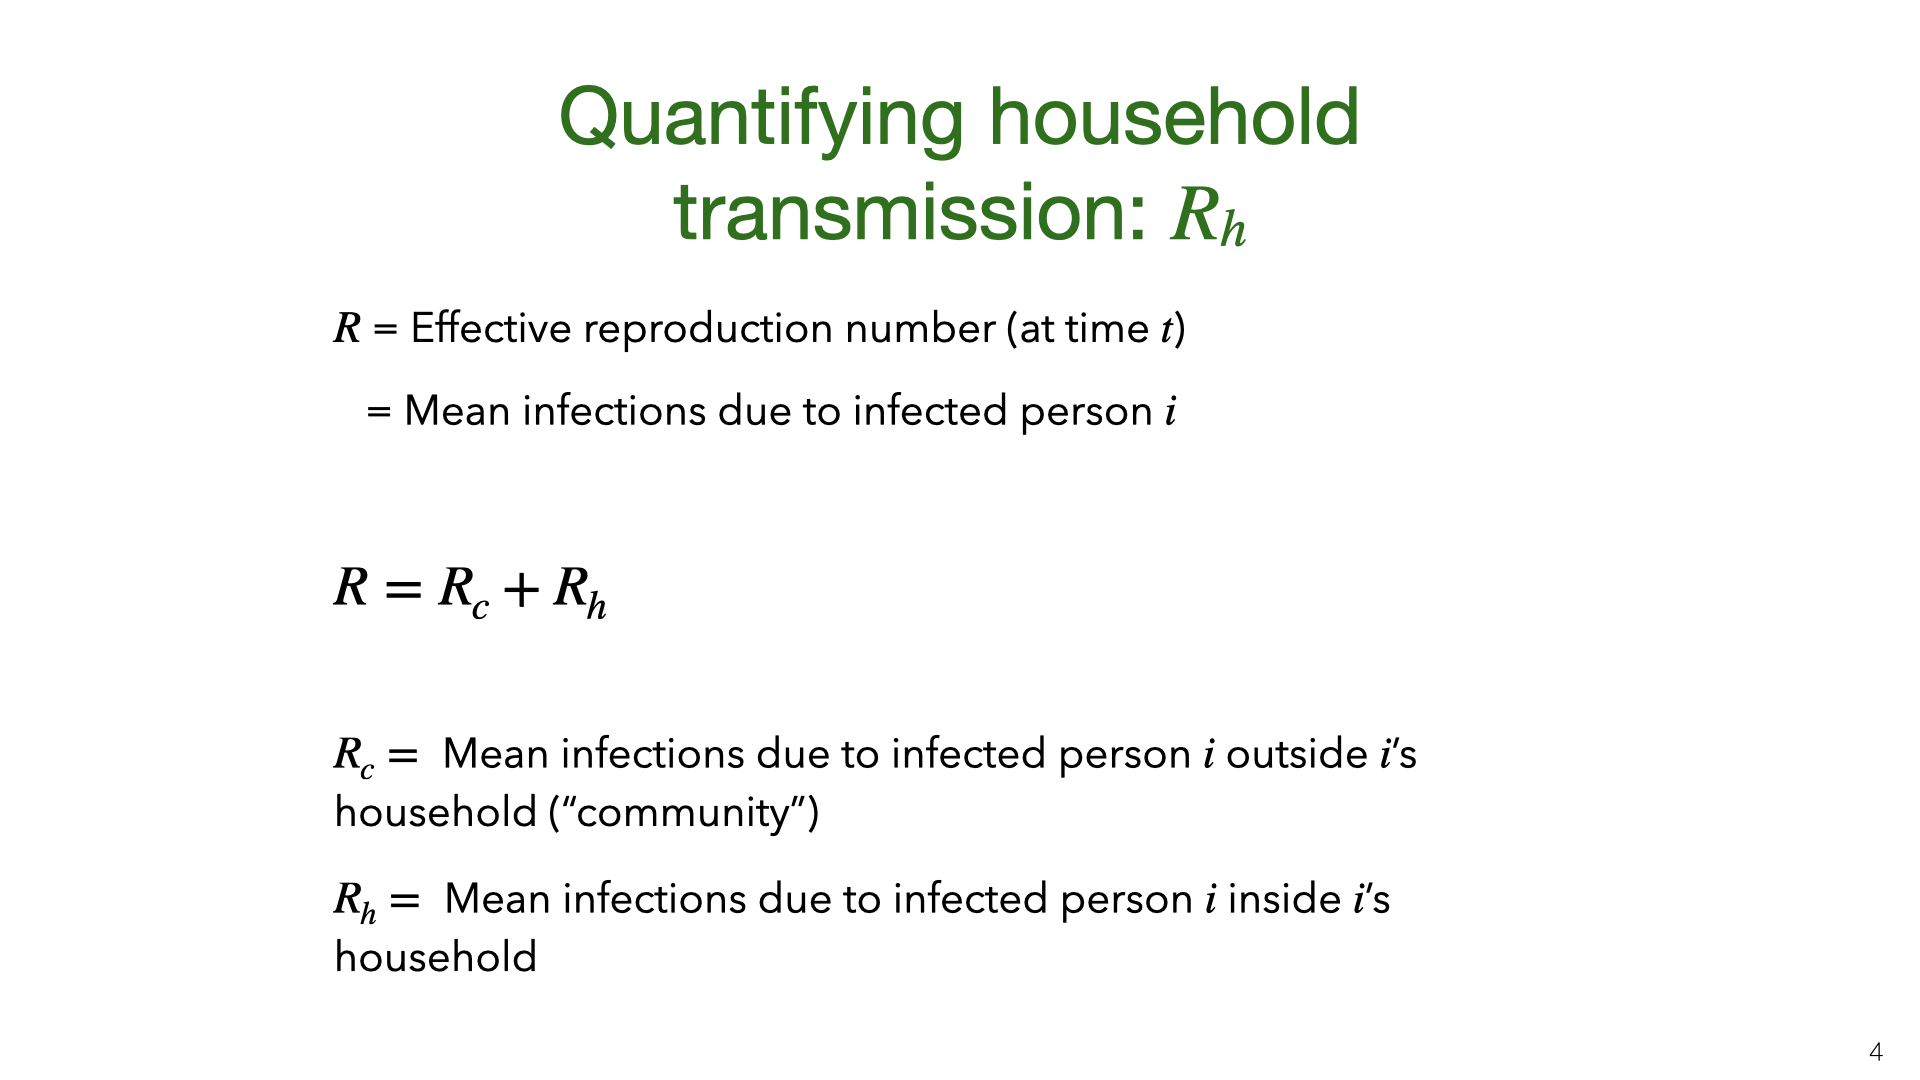
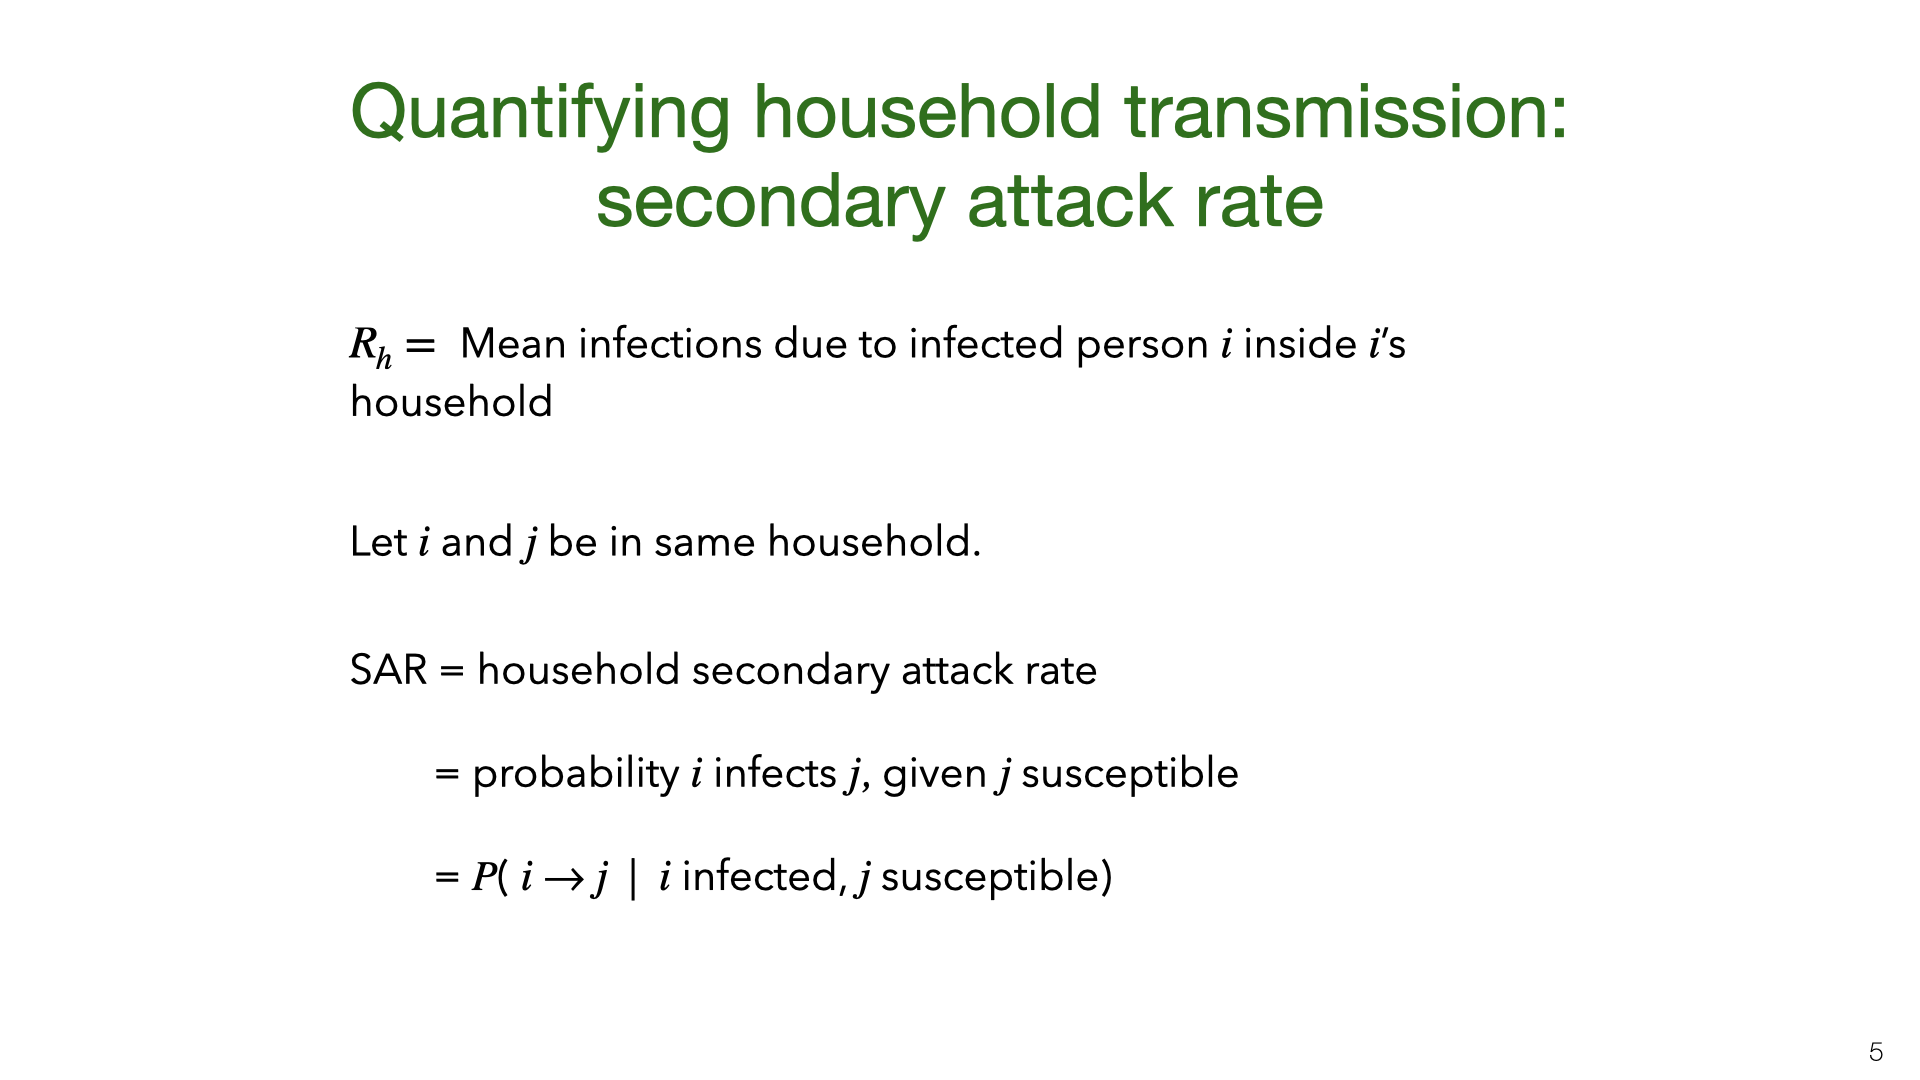
We consider two main ways of quantifying household transmission. The first is the intra-household effective reproductive number . This is defined by decomposing the familiar number (the effective reproductive number) into a sum of community and intra-household reproductive numbers. These reproductive numbers will change over time due to behavioral interventions and reduced susceptibility. Second is the household SAR. The SAR varies depending on the age of and and the relationship (spouses vs housemates). For our purposes, the SAR is an average over the rates for different groups.
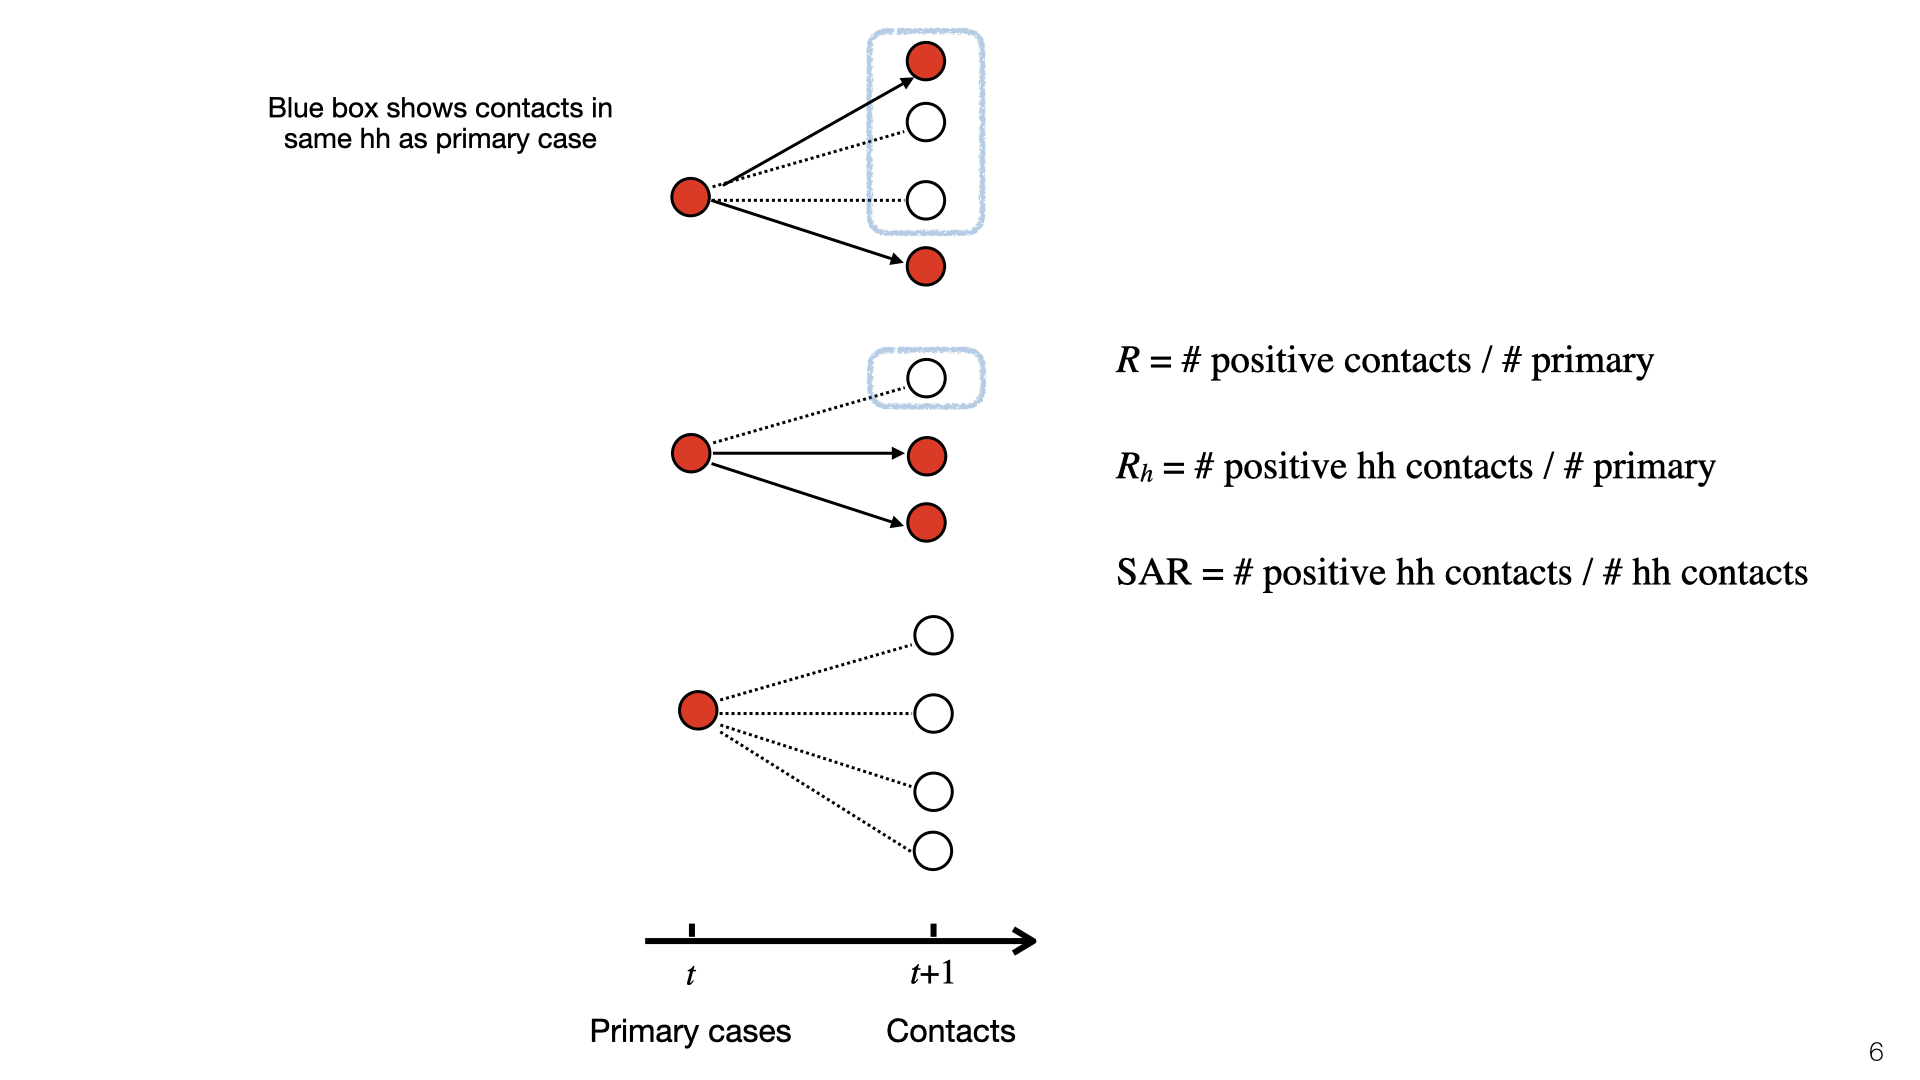
This diagram illustrates , , and SAR. At time t, there is a set of primary cases who are infected. They each have a set of contacts and some of those become infected at time t+1. Infected contacts are shown in red. Household members of primary cases have a blue box around them. The topmost primary case has two household members and infects 1/3 of them. The middle primary case has one household member and doesn’t infect them, and the bottom primary case has no household members. To compute , we look at the red nodes in blue boxes (positive cases) and do not consider negative cases. Here =1/3. To compute the SAR we look at the ratio of red to white nodes in blue boxes. Here SAR =1/4.
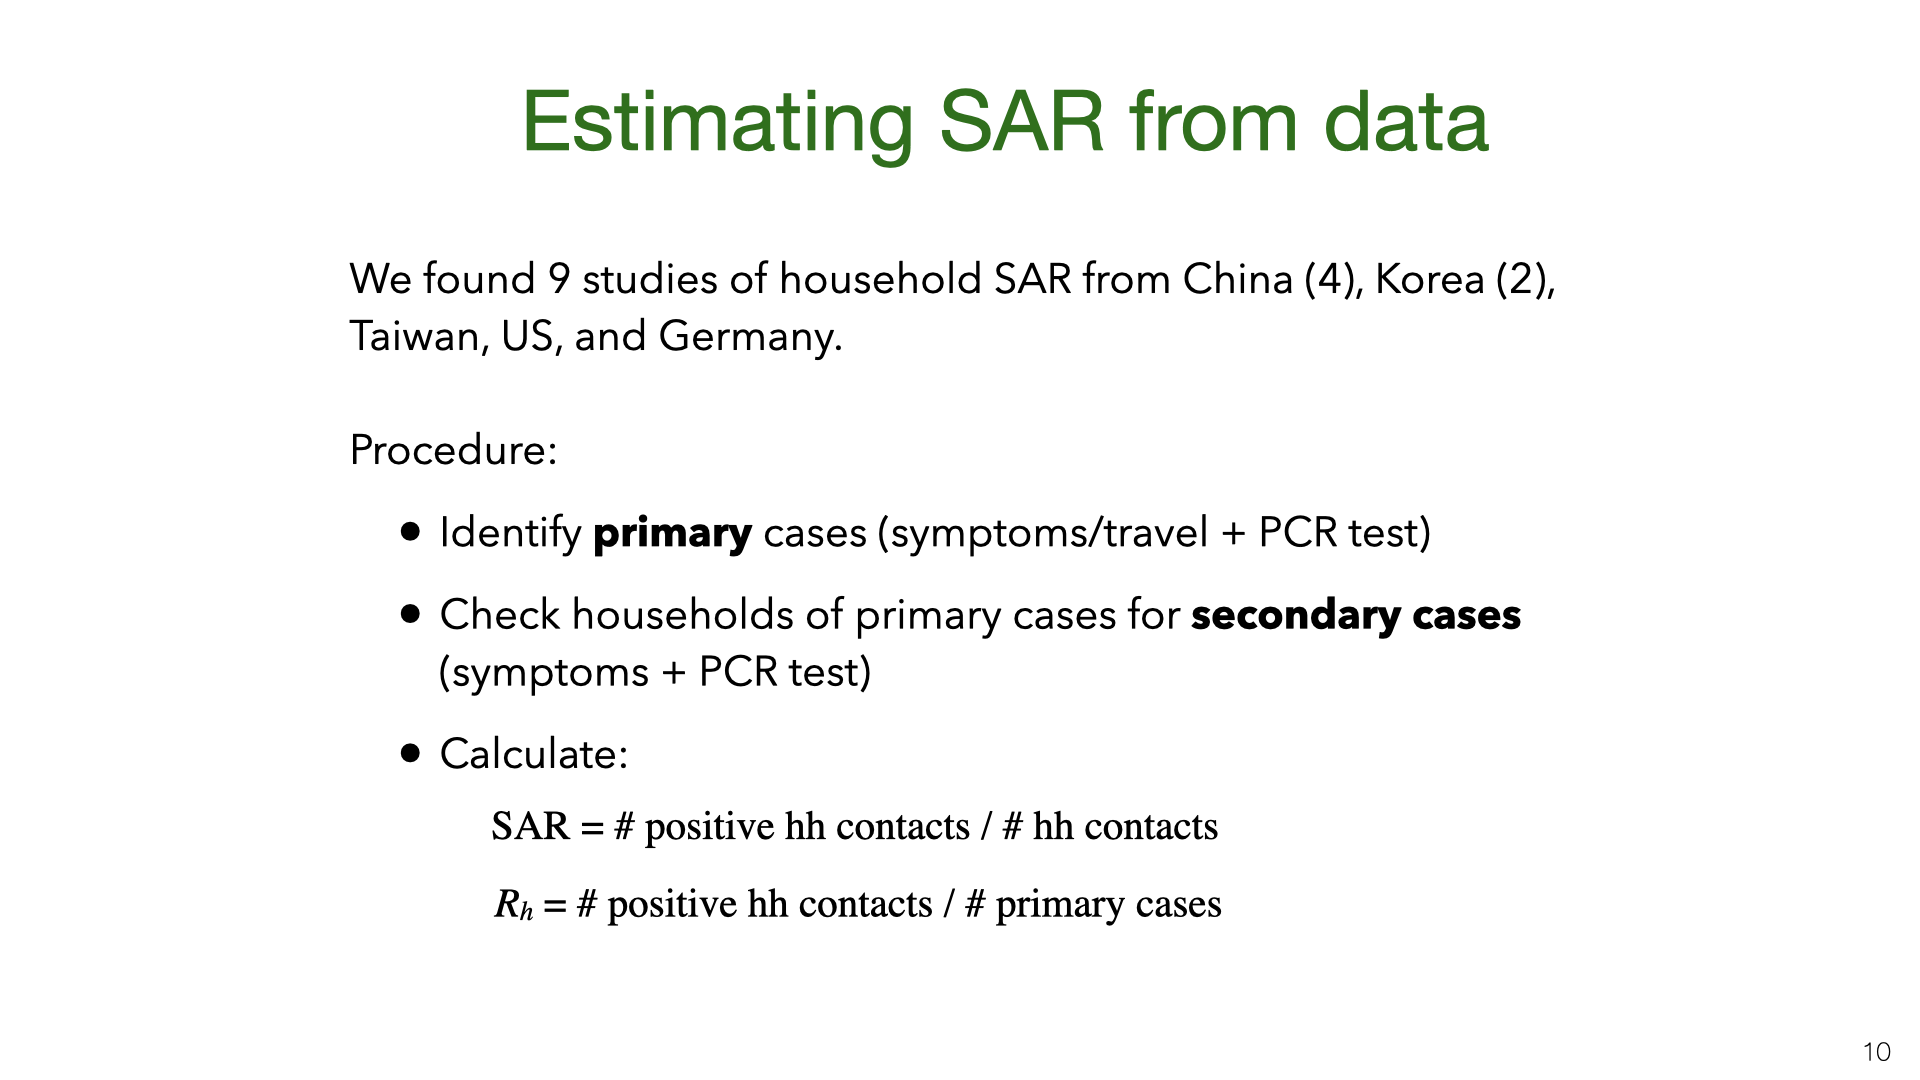
The empirical studies of SAR are based on government contact tracing data. They found primary cases based on symptoms or travel history and PCR testing and then investigated whether their household members were infected.
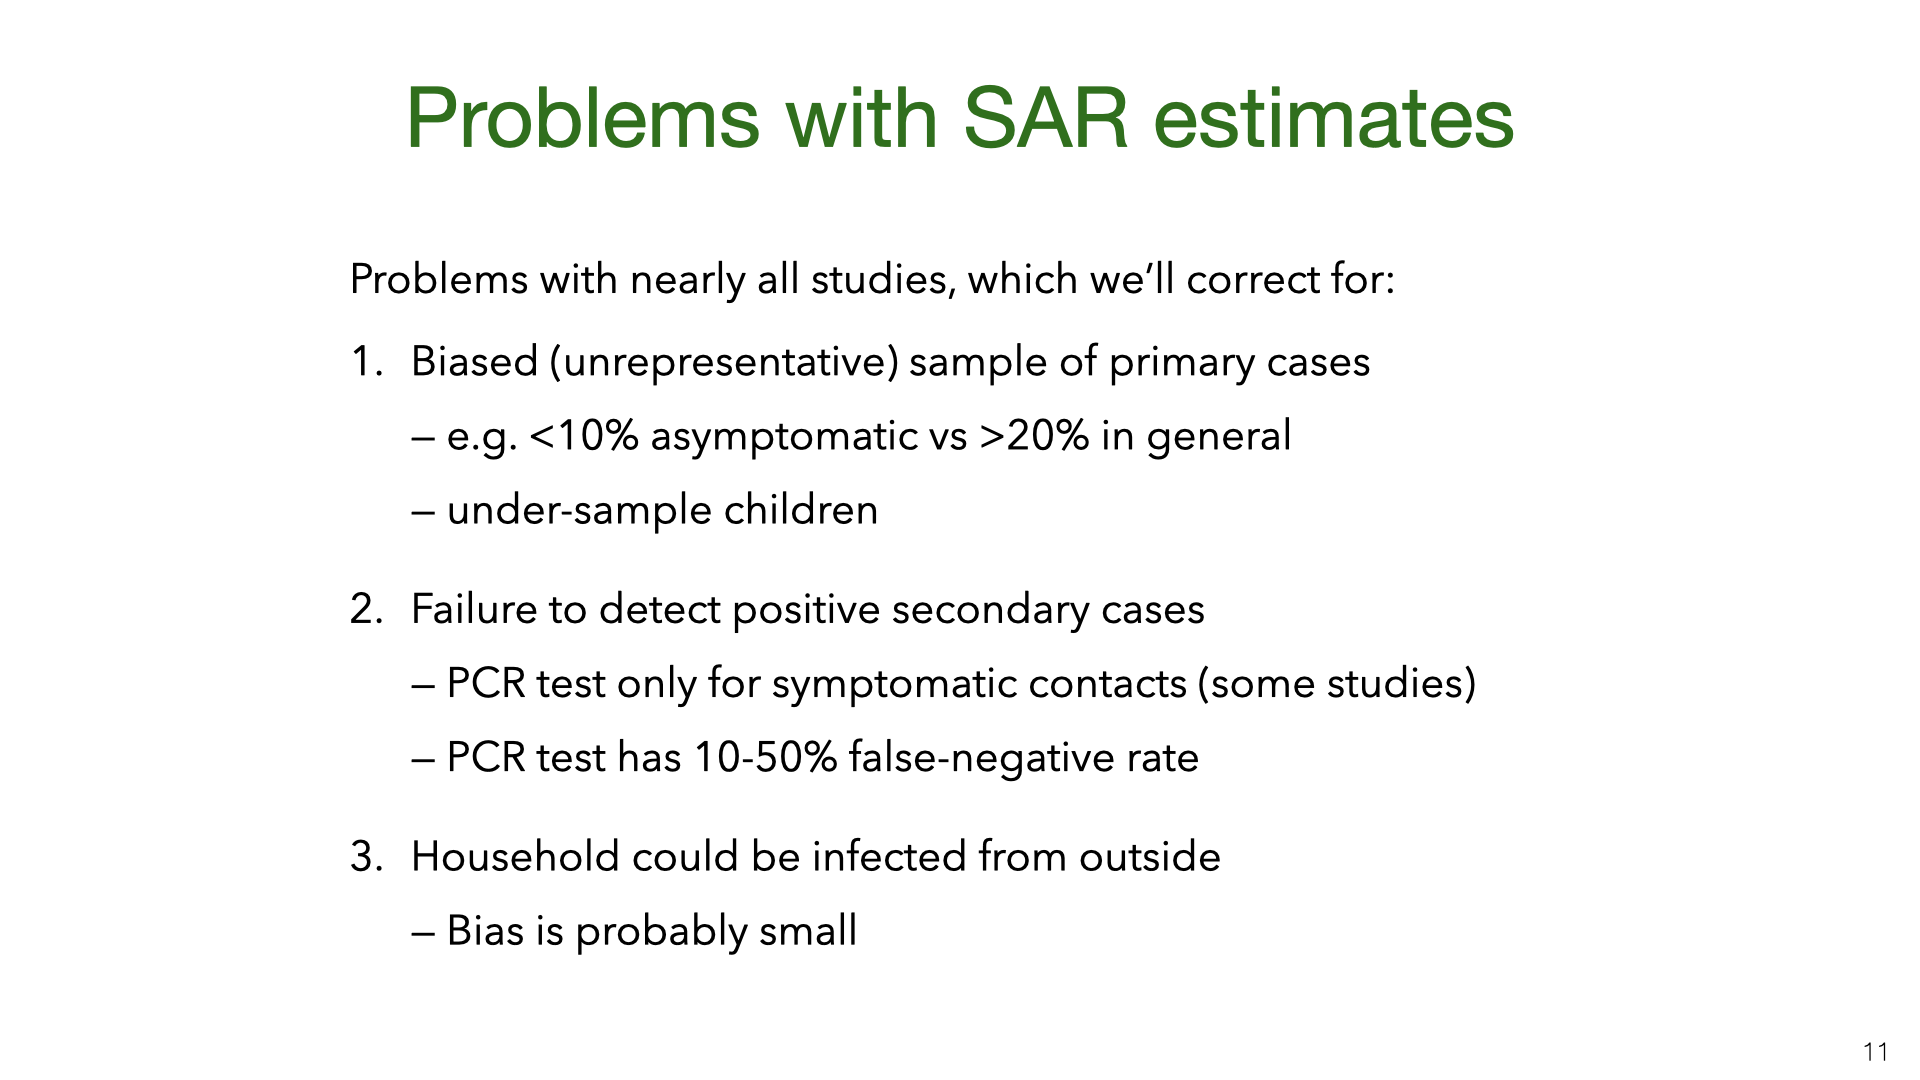
The studies aren't as rigorous as we would hope. Some studies didn't test asymptomatic household members and all studies used tests (RT-PCR) that have a high false-negative rate. However, some sources of bias can be adjusted for statistically.
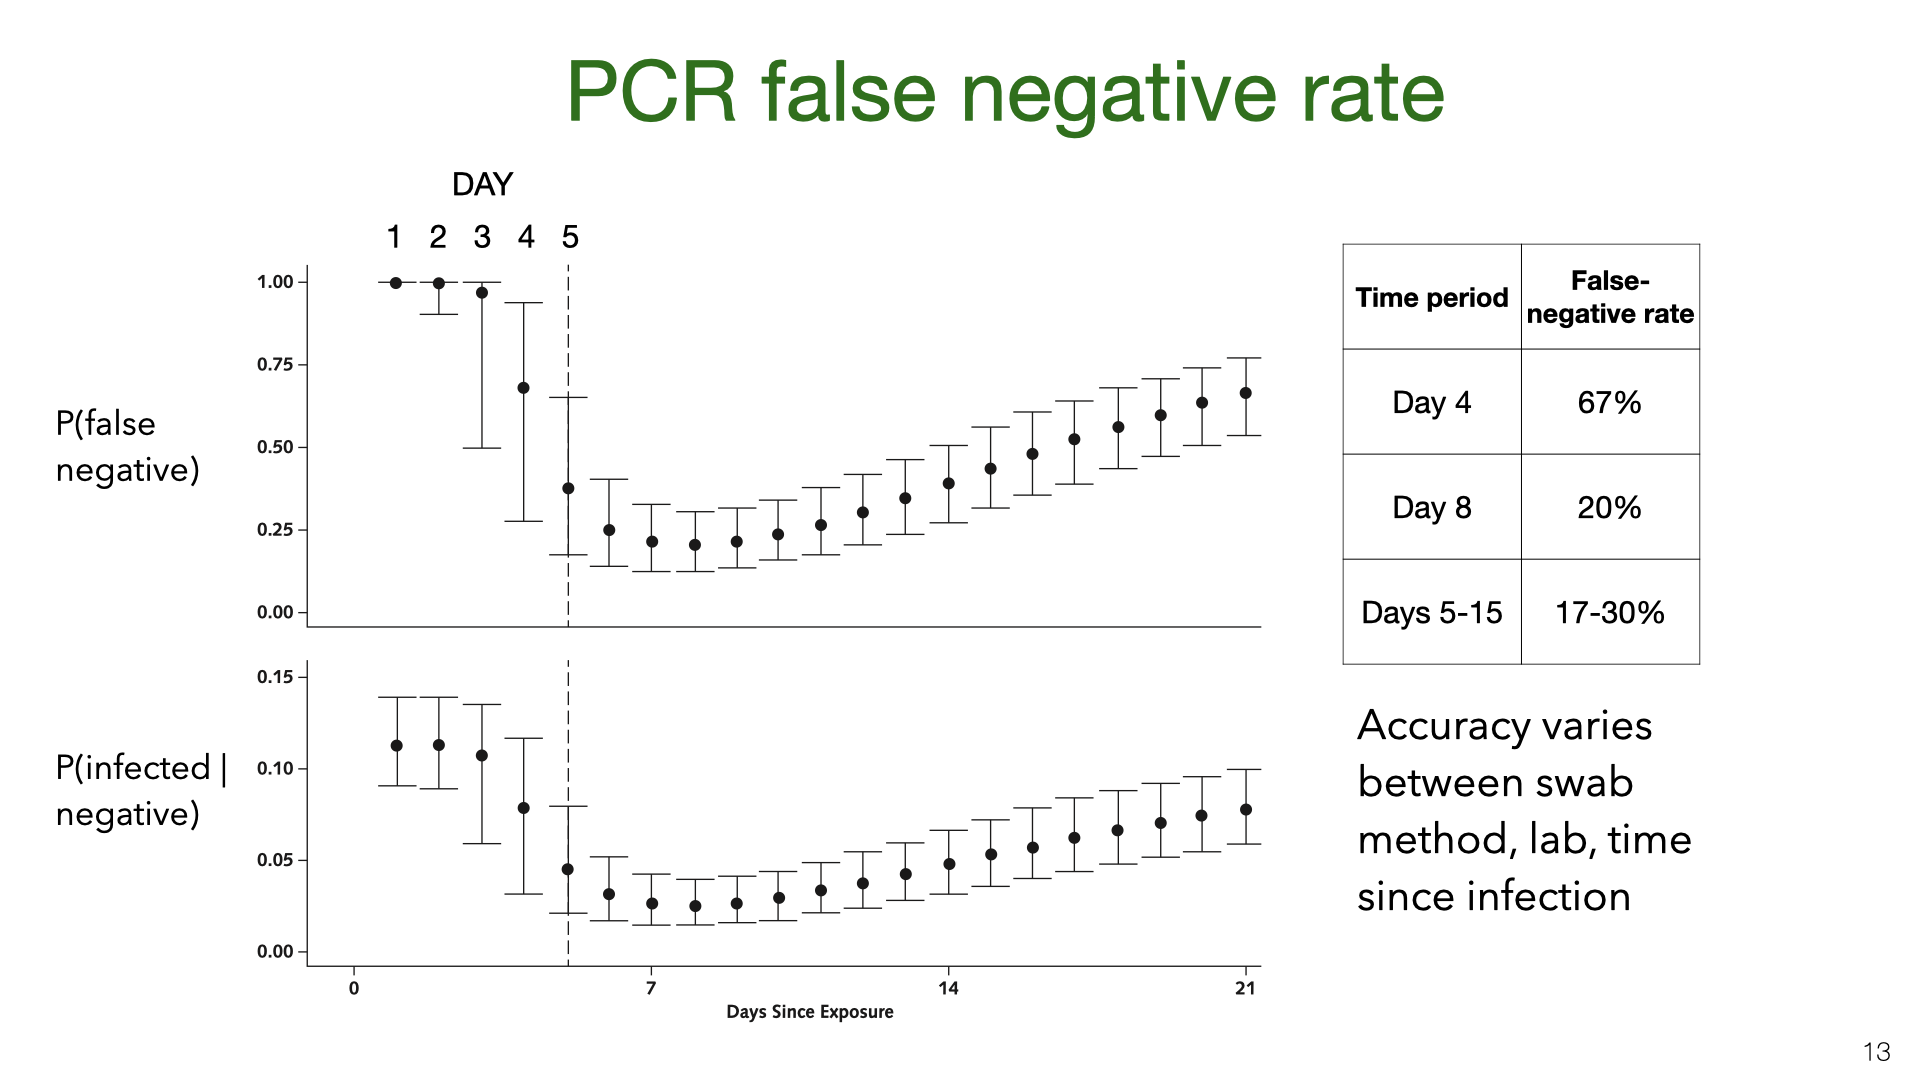
PCR testing has a high false-negative rate (or low sensitivity). These graphs come from Kucirka et al [7]. We see that on the first few days after being infected, someone was unlikely to test positive. During the 10 days after typical symptom onset (Days 5-15) the mean false-negative rate is still more than 17% (with different papers giving different estimates [8]).
PSA: The false-negative rate for PCR tests may be lower (or higher) in your local test center. However, these graphs are based on results mainly from China in Spring, and this is where most of our SAR data comes from.
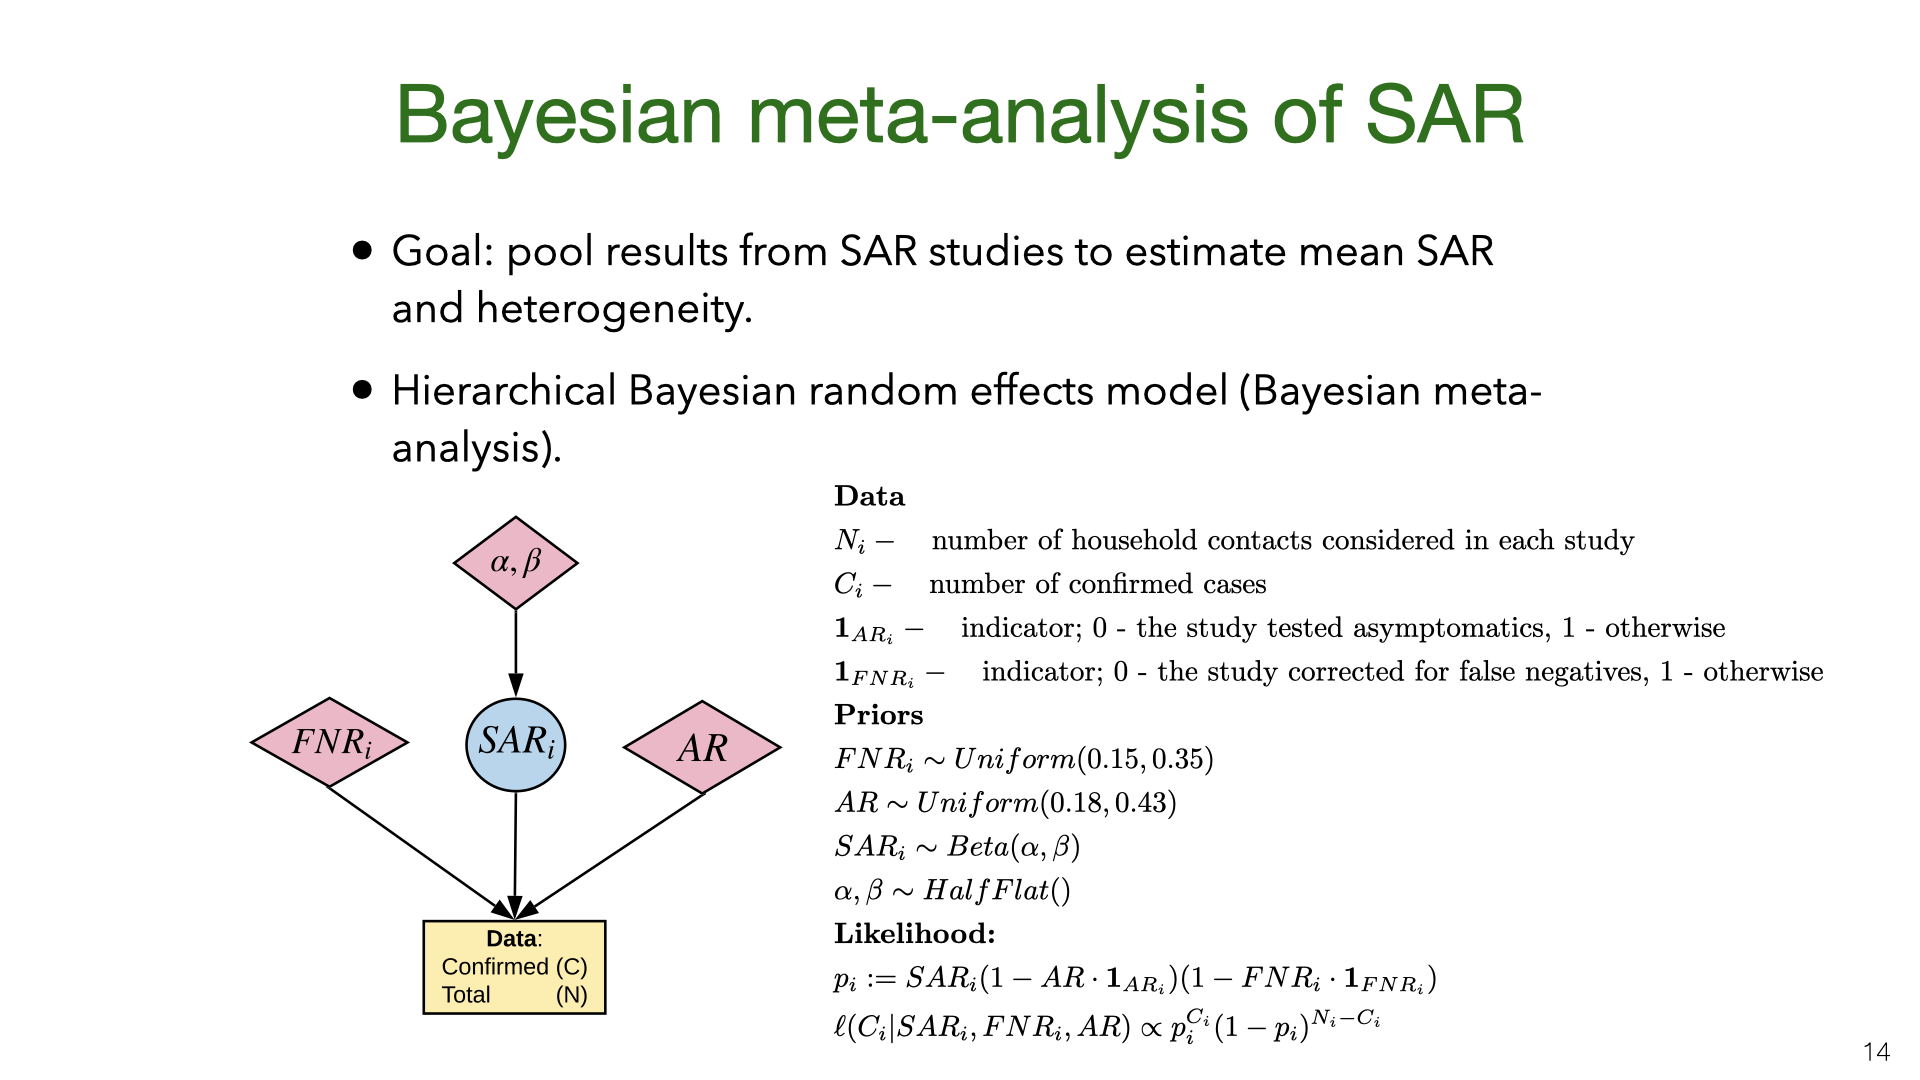
We did a Bayesian meta-analysis of the nine SAR studies [1], [3], [4], [9]–[14]. The model corrects the original estimates of SAR for false negatives (for all studies) and for the failure to test asymptomatics (in some studies). In the model, the household SAR for study is generated from a Beta distribution with a flat (improper) prior on its parameters. The precise false-negative rate and asymptomatic rate AR are unknown and so we sample them from priors based on existing estimates. This model allows us to estimate heterogeneity in SAR across studies and to pool data.
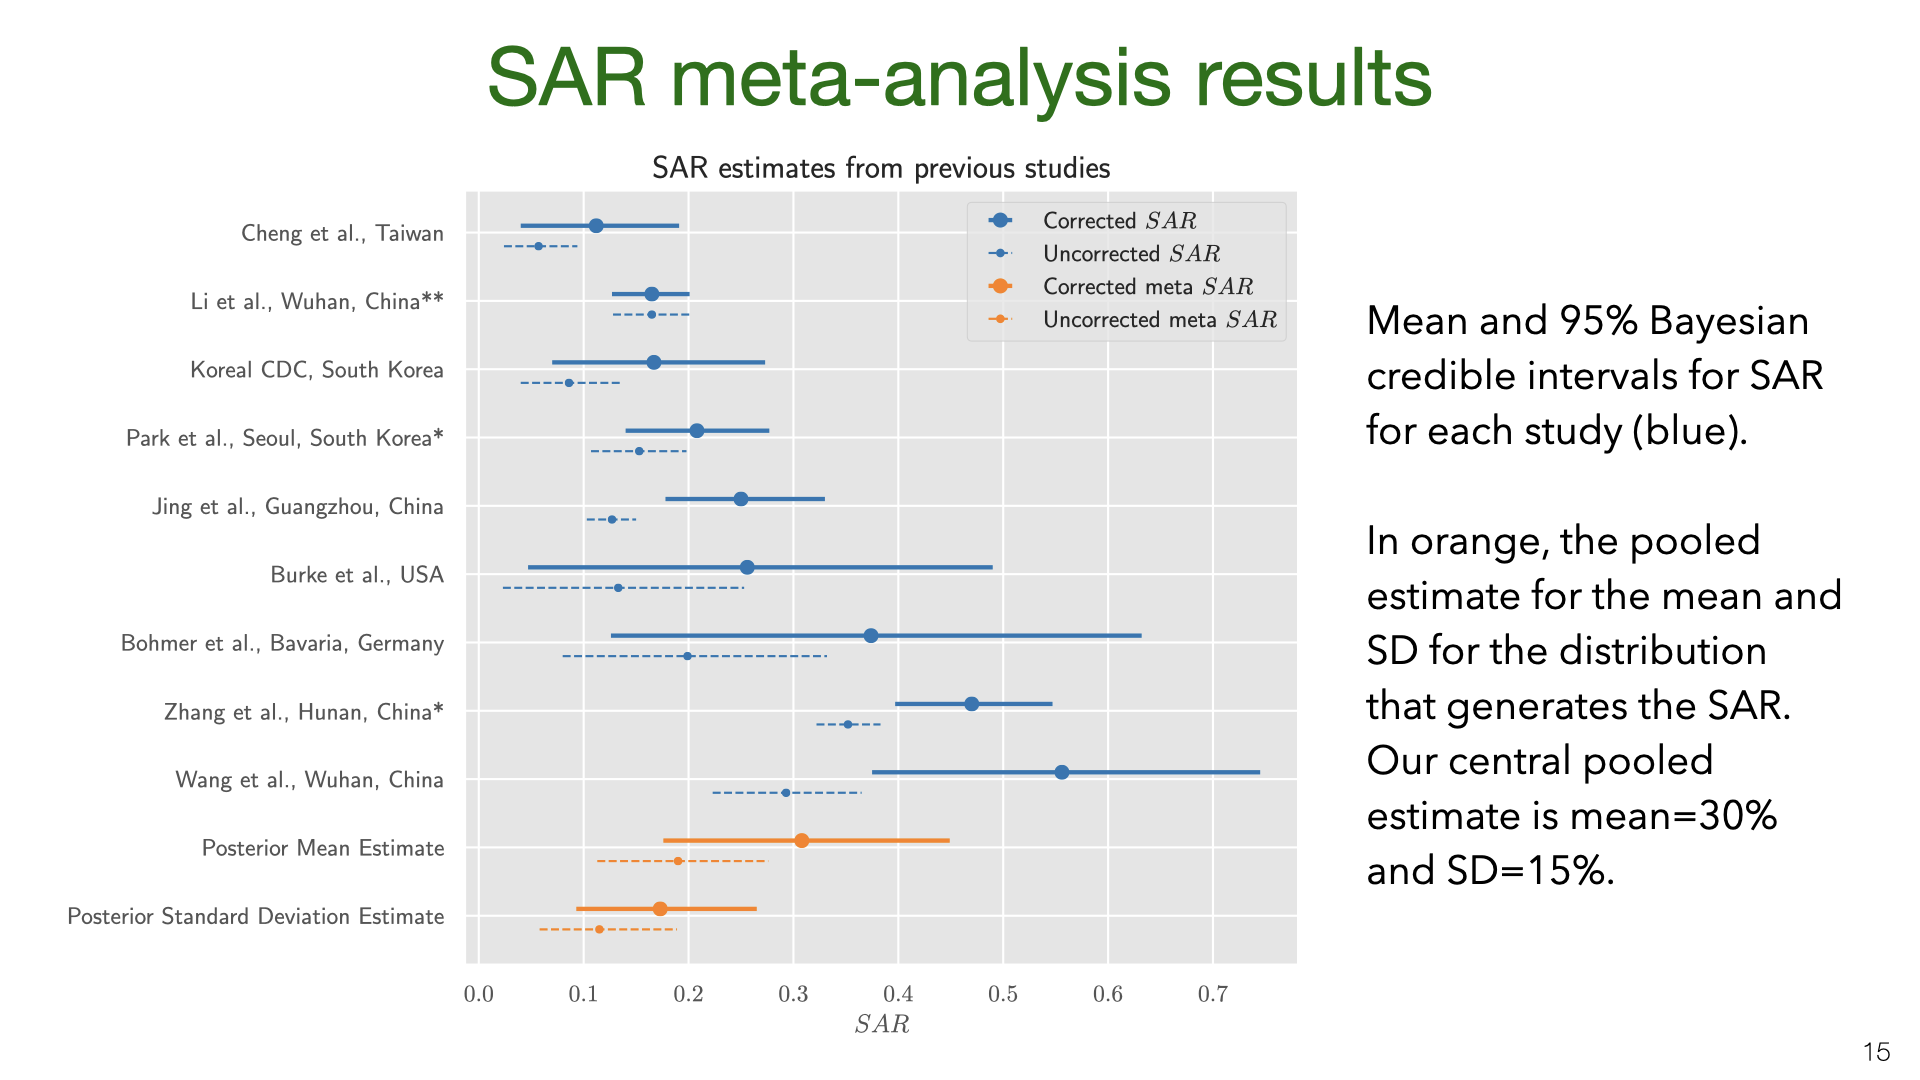
The results show that correcting for false negatives and asymptomatics has a substantial effect: the mean SAR estimate increased from 20% to 30% (second to last row). It’s also clear that SAR is heterogeneous across studies, with some 95% credible intervals not overlapping. Part of this heterogeneity is likely due to false negatives and asymptomatics (which we model but do not observe for each study). Another source of heterogeneity is the actions taken by households in different locations. There is evidence that early isolation of symptomatic family members and PPE used at home can reduce SAR.
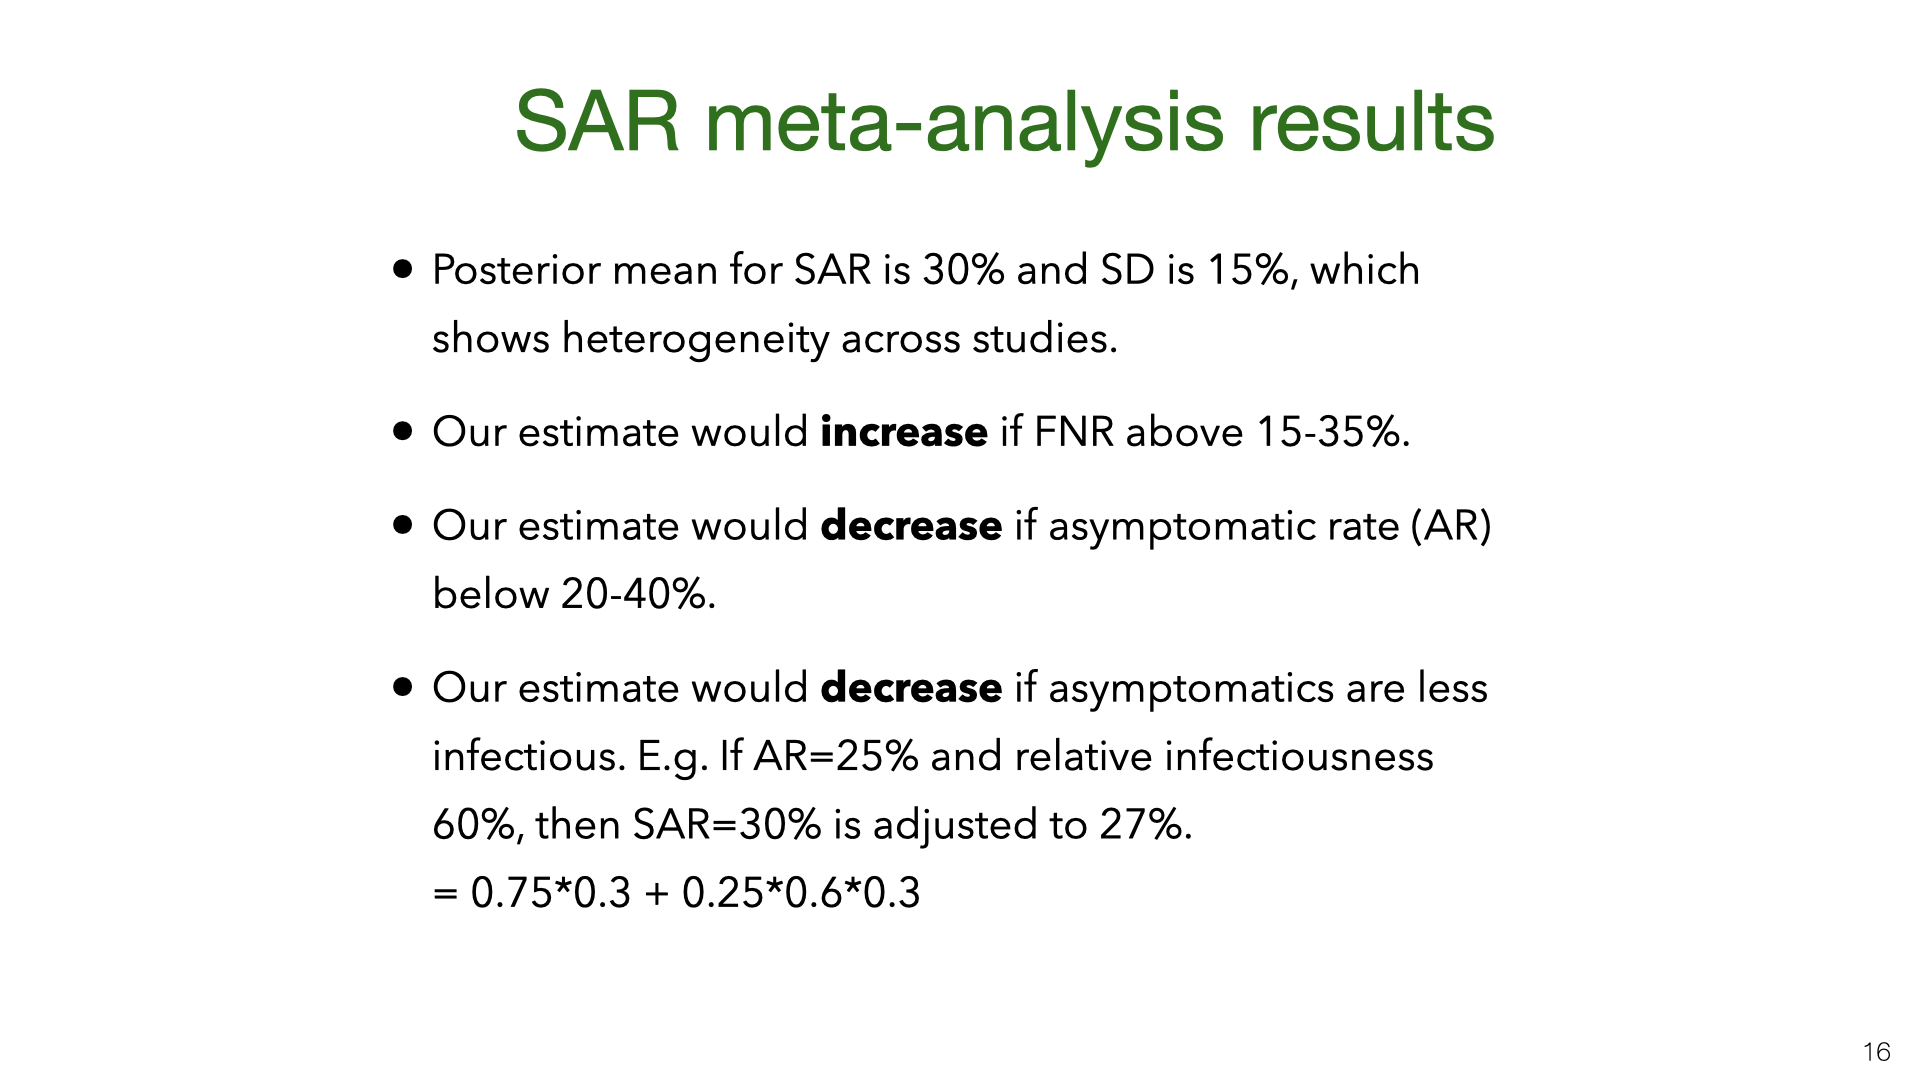
Our results are quite uncertain. The 95% credible interval around the mean for the SAR distribution is 18%-43%. Having a better estimate for the prior on false-negative rates and the asymptomatic rate would lead to more accurate estimates of SAR. We do not adjust for lack of asymptomatics among primary cases. My guess is that asymptomatics are under-sampled and that they are less infectious. (At the same time, their lack of symptoms means that household members will not take any precautions). Adjusting for lack of asymptomatics will revise the SAR estimate down, but probably not by a large amount. Future work (drawing on better studies on false-negatives, asymptomatics, NPIs that reduce SAR) could put all these together and more accurately model the SAR.
You might be concerned that the studies from China, South Korea and Taiwan are not representative of the rest of the world. Maybe the SAR in these countries is lower than in Europe or the US. Another issue (raised above) is the lack of asymptomatics among primary or secondary cases. We address both of these issues using data from European studies (in Germany and Italy) that did random population testing. We find that results are broadly consistent with the SAR estimates derived from East Asian studies. See the full slide show for details.
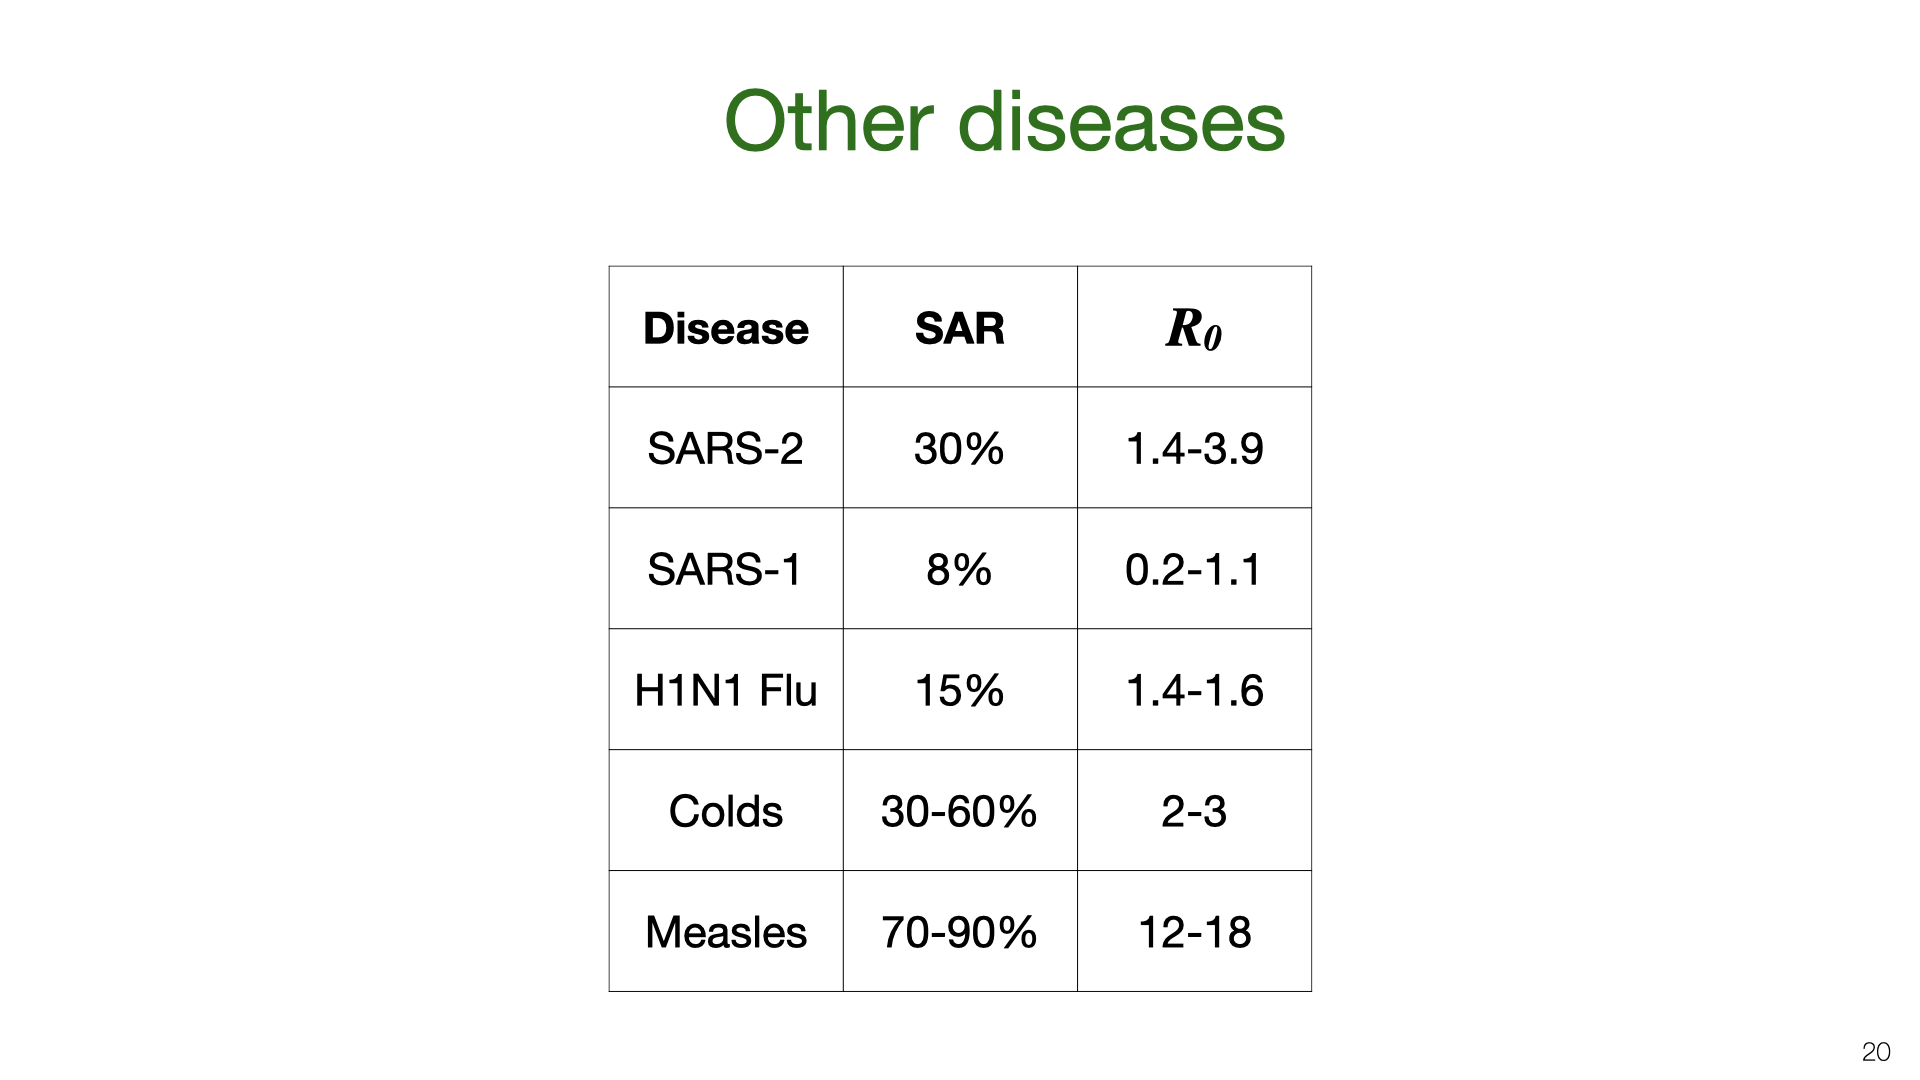
We can compare our estimate for the household SAR of SARS-CoV-2 to other related viruses. The SAR is correlated with the reproductive number R0. The R0 numbers are taken from Wikipedia. SAR estimates taken from these papers. I didn't do a detailed survey of other diseases and the issues of heterogeneity, selection bias and imperfect testing probably distort the estimate of other diseases too. (I only found one study involving deliberate infection to measure SAR.)
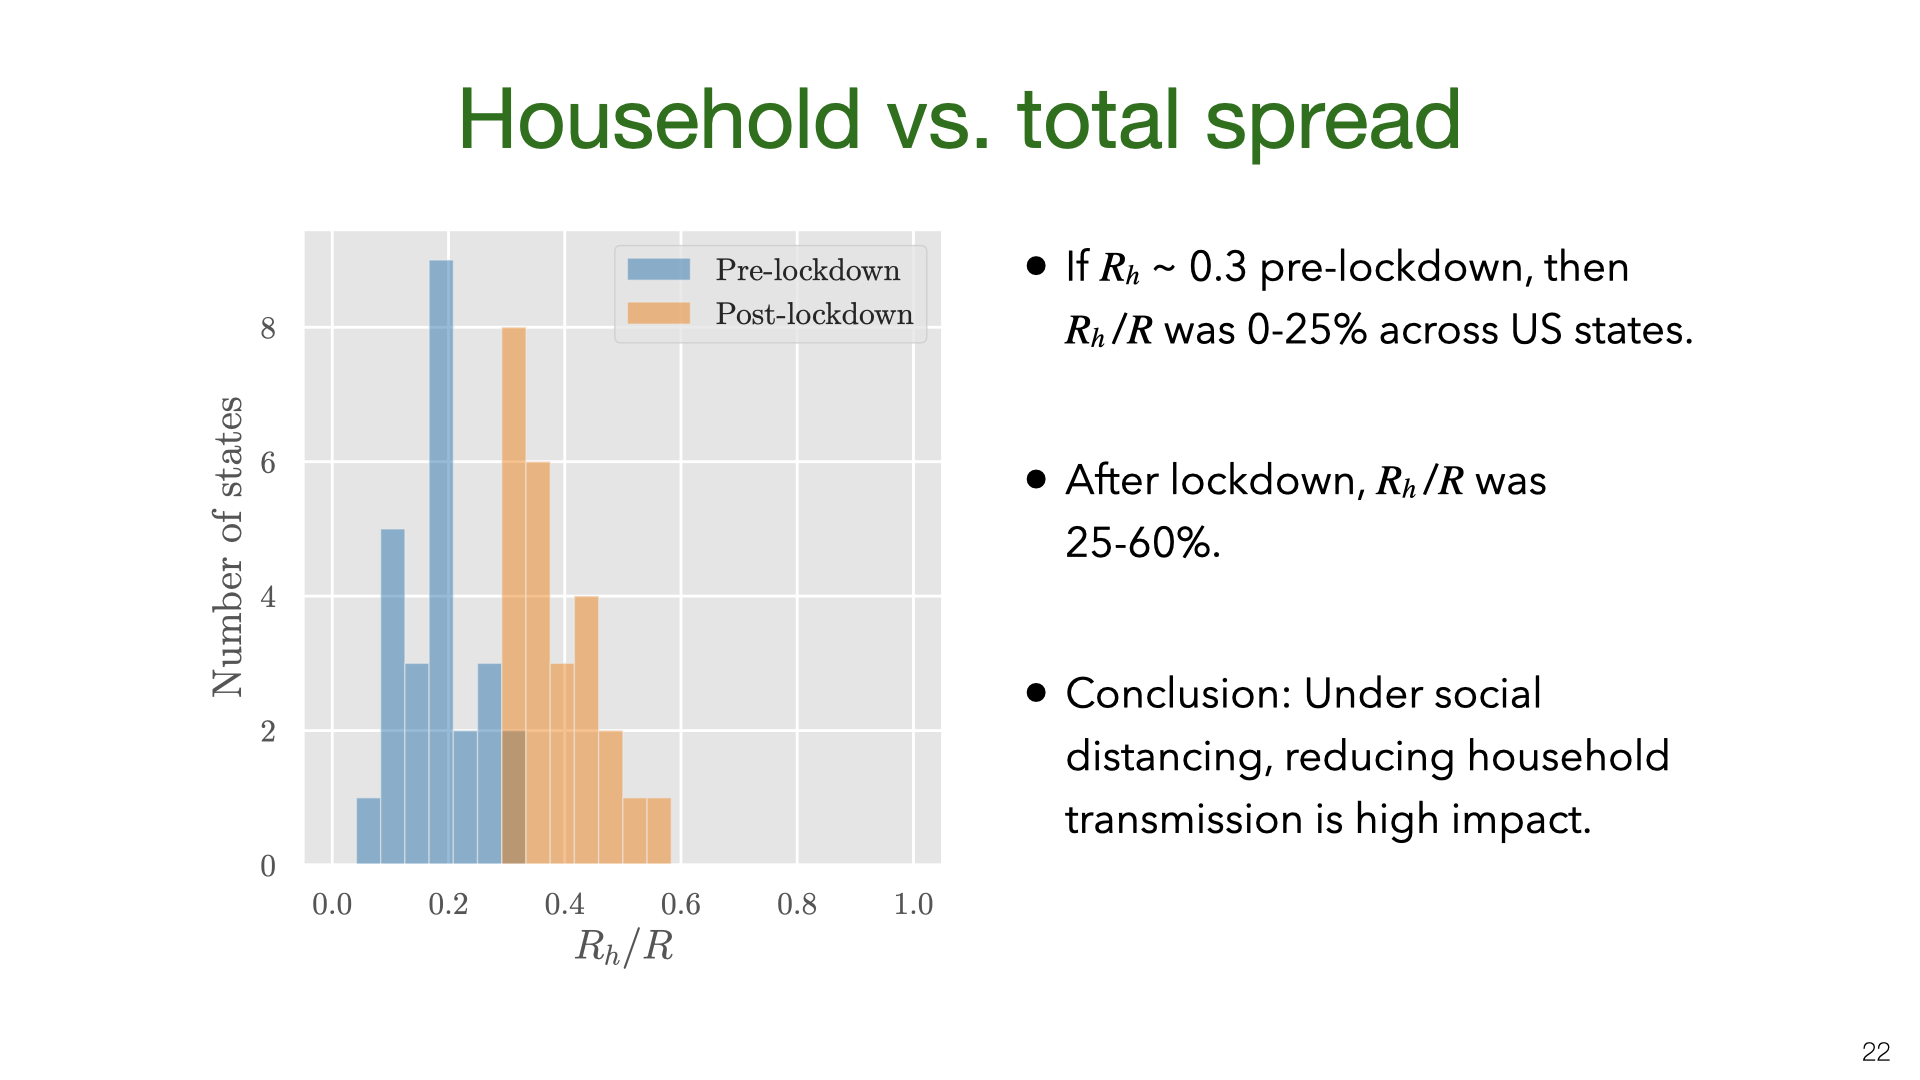
We don’t have data on for US states, but we approximate it using the value pre-lockdown based on our earlier results. The main result here is that is a small fraction of R before lockdown but 25-60% of R during lockdown.
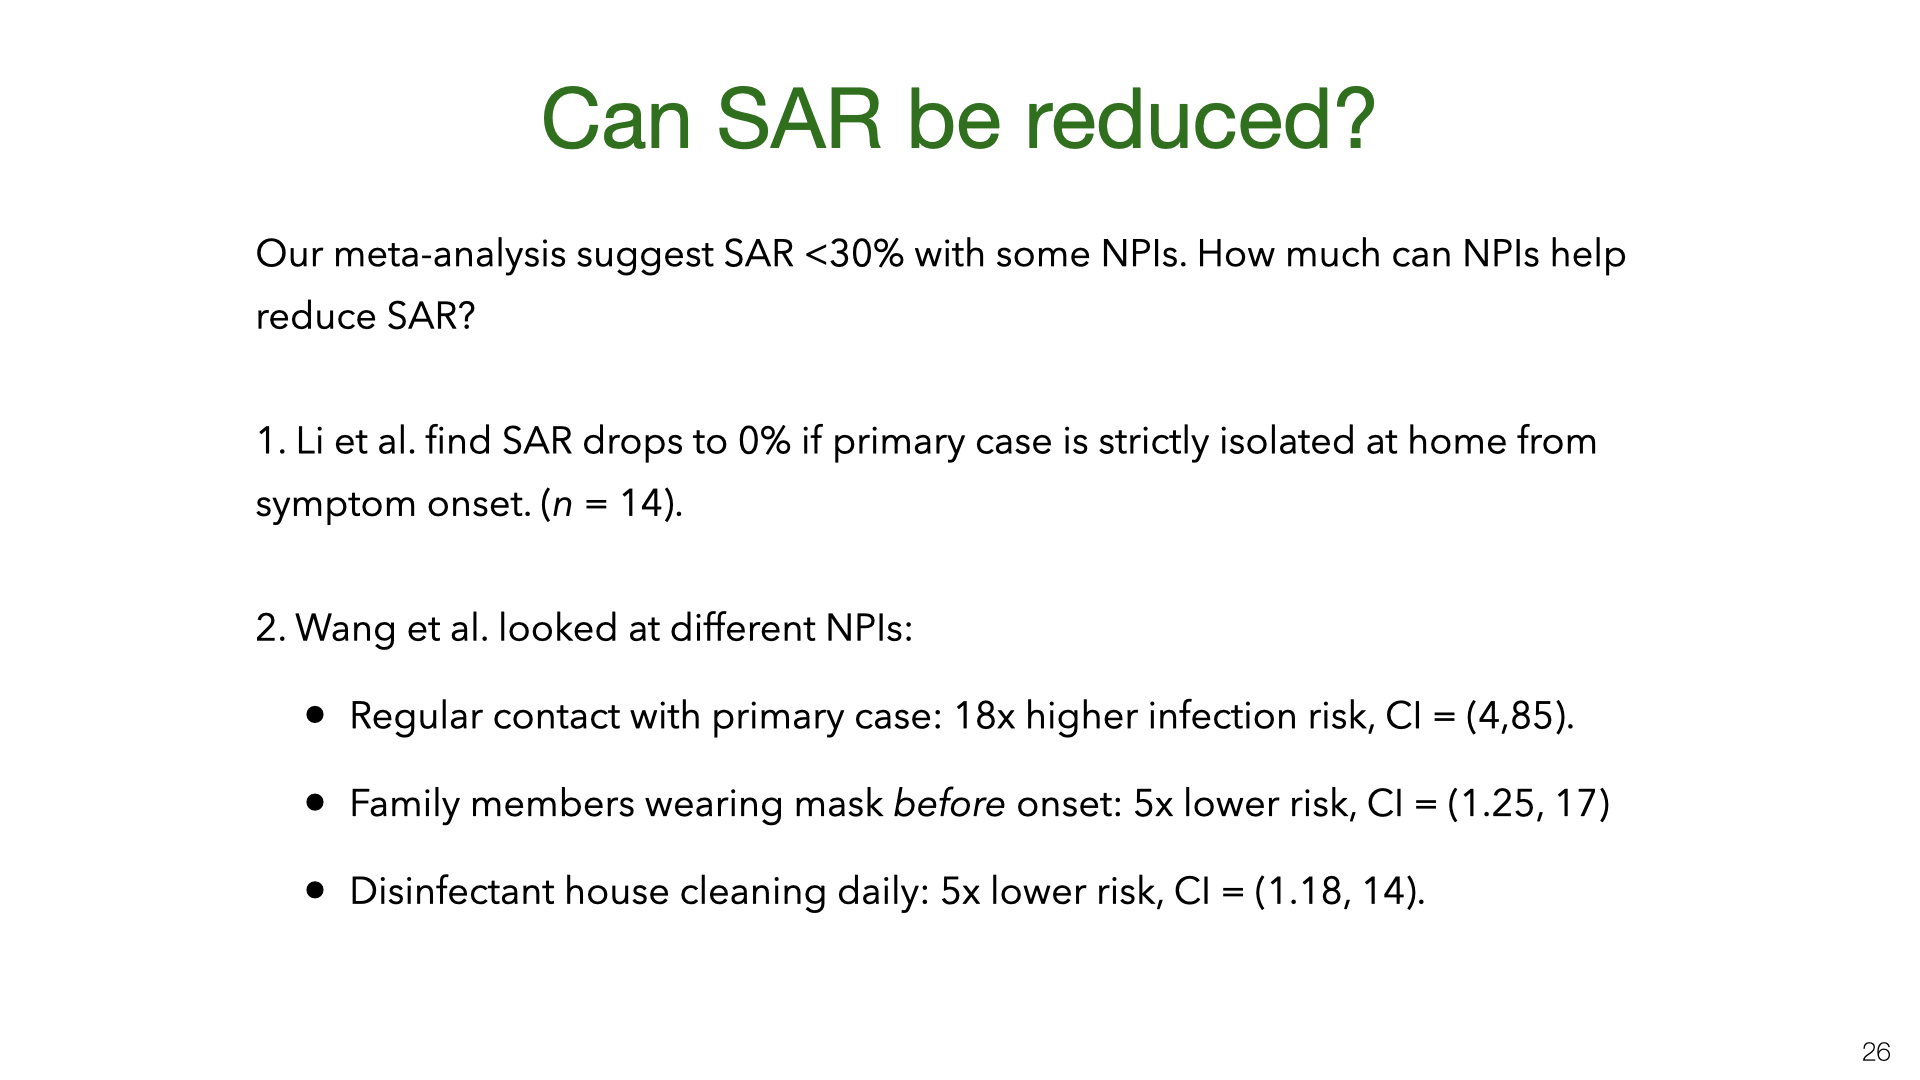
Our results show that SAR varies a lot between experiments. Some of this variation is probably explained by NPIs (non-pharmaceutical interventions) taken by households to reduce transmission. However, for most studies we don’t have information about NPIs. There are two exceptions. Both are observational studies with fairly small n, and so this is not watertight evidence. Each study suggests that avoiding contact with the primary case and using standard NPIs (masks and disinfectant cleaning of surfaces) reduce the SAR. We think it’s likely that other standard NPIs also reduce SAR: e.g. having close contact outdoors vs indoors, hand hygiene, and so on.
For more, read the paper or the full version of the slide show.
4 comments
Comments sorted by top scores.
comment by gjm · 2020-07-06T19:40:31.707Z · LW(p) · GW(p)
Does (or could) your analysis distinguish between "someone in the household" with, say, "someone you are sleeping in the same bed as"? It's very common for relationships within a household to be highly varied in ways that seem relevant.
Replies from: Owain_Evans↑ comment by Owain_Evans · 2020-07-06T20:30:39.385Z · LW(p) · GW(p)
There is a small number of studies that distinguish spouse from other relationships. See Figure S5 of this paper. I don't think there's enough data to draw a strong empirical conclusion. Most of our data for estimating SAR is from China/Korea/Taiwan and I'd guess these are mostly nuclear families or extended family (not many group house / flatmates).
comment by greylag · 2020-07-08T20:01:13.065Z · LW(p) · GW(p)
estimate the chance of being infected by an infected household member as 30%
Given how contagious this disease seems to be, why is this not higher? Am I misunderstanding what this is measuring? Given you are uninfected, and someone in your household is infected, you have a 1 in 3 chance of contracting Covid?
Replies from: Owain_Evans↑ comment by Owain_Evans · 2020-07-09T11:38:58.738Z · LW(p) · GW(p)
You are understanding correctly. Here are some things to keep in mind:
- The reproductive number R before lockdowns was estimated at 2-3. People are infectious for 4-7 days. The average person has contact with about 10 other people daily (paper). So there could be 20-50 unique contacts over 4-7 days. Maybe 10-30 of those are higher risk contacts (long duration, close proximity). So only 5-33% of higher risk contacts are being infected (using these very rough numbers). So I'd say that Covid is not very contagious. Note that R for measles is 12-18!
- There is probably some overdispersion. Say 20% of people do 60-80% of all infecting. So many people cause zero new infections. I'd presume such people just aren't very infectious and so even if they spend a lot of time with household members they won't infect them.
- The 30% is averaging over all household members, which includes children. Children are probably less susceptible (e.g. they might have 50% lower risk of infection).
- Once someone develops Covid symptoms, many households will intervene to reduce exposure. If adult children get sick, they are likely to try to isolate from their older parents.