When the uncertainty about the model is higher than the uncertainty in the model
post by Stuart_Armstrong · 2014-11-28T18:12:58.376Z · LW · GW · Legacy · 78 commentsContents
  Black Monday
  Castle Bravo
  Physician, wash thyself
None
78 comments
Most models attempting to estimate or predict some elements of the world, will come with their own estimates of uncertainty. It could be the Standard Model of physics predicting the mass of the Z boson as 91.1874 ± 0.0021 GeV, or the rather wider uncertainty ranges of economic predictions.
In many cases, though, the uncertainties in or about the model dwarf the estimated uncertainty in the model itself - especially for low probability events. This is a problem, because people working with models often try to use the in-model uncertainty and adjust it to get an estimate of the true uncertainty. They often realise the model is unreliable, but don't have a better one, and they have a measure of uncertainty already, so surely doubling and tripling this should do the trick? Surely...
The following three cases are going to be my go-to examples for showing what a mistake this can be; they cover three situations: extreme error, being in the domain of a hard science, and extreme negative impact.
Black Monday
On October 19, 1987, the world's stock markets crashed, shedding a huge value in a very short time. The Dow Jones Industrial Average dropped by 22.61% that day, losing between a fifth and a quarter of its value.
How likely was such an event, according to the prevailing models of the time? This was apparently a 20-sigma event, which means that the event was twenty standard deviations away from the expected behaviour.
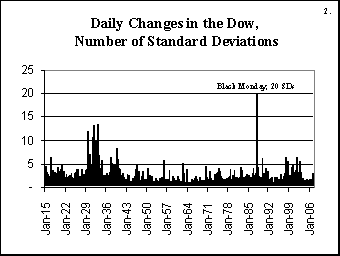
Such events have a probability of around 10-50 of happening, which in technical mathematical terms is classified as "very small indeed". If every day were compressed into a second, and the stock markets had been running since the big bang... this gives us only about 1017 seconds. If every star in the observable universe ran its own stock market, and every day were compressed into a second, and we waited a billion times the lifetime of the universe... then we might expect to observe a twenty sigma event. Once.
No amount of reasonable "adjusting" of the probability could bring 10-50 into something plausible. What is interesting, though, is that if we took the standard deviation as the measure of uncertainty, the adjustment is much smaller. One day in a hundred years is a roughly 3x10⁻⁵ event, which corresponds very roughly to three standard deviations. So "simply" multiplying the standard deviation by seven would have been enough. It seems that adjusting ranges is more effective than adjusting probabilities.
Castle Bravo
But economics is a soft science. Surely errors couldn't occur in harder sciences, like physics? In nuclear bomb physics, where the US had access to the best brains and the best simulations, and some of the best physical evidence (and certainly a very high motivation to get it right), such errors could not occur? Ok, maybe at the very beginning, but by 1954, the predictions must be very accurate?

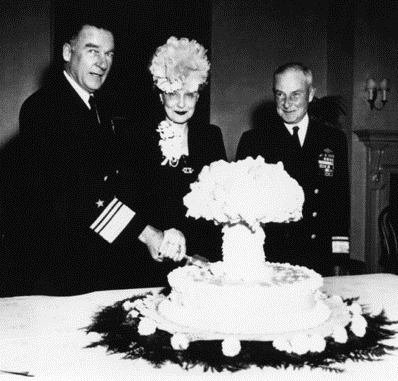
The Caste Bravo hydrogen bomb was the highest yield nuclear bomb ever detonated by the United States (though not necessarily intended to be). The yield was predicted to be 6 megatons of TNT, within a maximum range of 4 to 8. It ended up being an explosion of 15 megatons of TNT, around triple the expectation, with fallout landing on inhabited islands(on the Rongelap and Utirik atolls) and spreading across the world, killing at least one person (a Japanese fisherman).
What went wrong? The bomb designers considered that the lithium-7 isotope used in the bomb was essentially inert, when in fact it... wasn't. And that was sufficient to triple the yield of the weapon, far beyond what the designers had considered possible.
Again, extending the range is more successful than adjusting the probabilities of high events. And even the hard sciences are susceptible to great errors.
Physician, wash thyself
The previous are good examples of dramatic underestimates of uncertainty by the model's internal measure of uncertainty. They are especially good because we have numerical estimates of the internal uncertainty. But they lack one useful rhetorical component: evidence of a large scale disaster. Now, there are a lots of of models to choose from which dramatically underestimated the likelihood of disaster, but I'll go with one problem in particular: the practice that doctors used to have of not washing their hands.
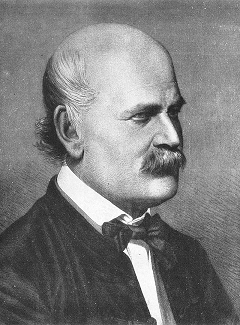
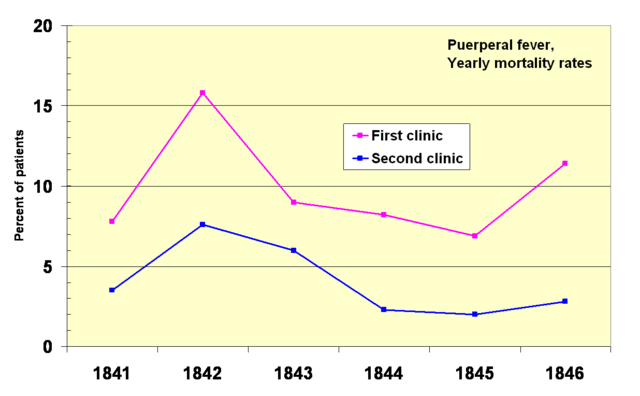
Ignaz Semmelweis noted in 1847 that women giving birth in the presence of doctors died at about twice the rate of those attended only by midwives. He correctly deduced that doctors were importing something from their experiments on cadavers, and that this was causing the women to die. He instituted a policy of using a solution of chlorinated lime for washing hands between autopsy work and the examination of patients - with great success, sometimes even reducing the death rate to zero in some months.
This caused a problem. Semmelweis was unable to convince other doctors about this, for a variety of standard biases. But the greatest flaw was that he had no explanation for this behaviour. Yes, he could point at graphs and show improvements - but there was nothing in standard medical theory that could account for it. The other doctors could play around with their models or theories for days, but they could never explain this type of behaviour.
His claims, in effect, lacked scientific basis. So they ignored them. Until Pasteur came up with a new model, there was just no way to understand these odd results.
The moral of this is that sometimes the uncertainty can not only be much greater than that of the model. Sometimes the uncertainty isn't even visible anywhere in the model.
And sometimes making these kinds of mistakes can lead to millions of unnecessary deaths, and the decisions made (using doctors for childbirths) have the absolute opposite effect than was intended.
78 comments
Comments sorted by top scores.
comment by mwengler · 2014-11-29T16:37:21.669Z · LW(p) · GW(p)
The "model" you never name for the stock price distribution is a normal or Gaussian distribution. You point out that this model fails spectacularly to predict the highest variability point 20 sigma event. What you don't point out that this model fails to predict even the 5 sigma events.
Looking at the plot of "Daily Changes in the Dow," we see it is plotted over fewer than 95 years. Each trading year has a little less than 260 trading days in it. So plotted should be at most 24,000 daily changes. For a normal distribution, a 1/24000 event, the biggest event we would expect to happen once on this whole graph, would be somewhere between 4 and 4.5 sigma.
But instead of seeing one, or close to one 4.5 sigma or higher events in 24,000 daily changes, we see about 28 by my rough count looking at the graph. The data starts in 1915. By 1922 we have seen 5 "1 in100 years" events.
My point being: by 1922, we know the model that daily changes in the stock market fit a normal or gaussian distribution is just pure crap. We don't need to wait 70 years for 20 sigma event to know the model isn't just wrong, it is stupid. We suspect this fact within the first year or two of data, and we know with high reliability that the model is garbage by 1922.
What I don't understand is why anybody rational would ever state the data fits a normal distribution, in the trivially obvious event that even within a few hundred events, we see an overwhelmingly obvious excess of large daily changes from what a normal distribution would predict.
One need not go to a mathematically well-described alternative distribution to produce a much better prediction of how often 20 sigma events will actually occur. Simply plotting the histogram of daily changes will show the tail probability falling off much more slowly than a normal distribution predicts. Before the 20 sigma event occurs, one might by estimating from the actual distribution of changes underestimate its probably by a factor of a few (or not, I have not done the exercise on this data), but one will not have underestimated it by tens of orders of magnitude.
There is no "uncertainty" in modeling daily stock market changes as normally (or log-normally) distributed. One can look at just the first few 100 points in the measured data, to be CERTAIN that a normal or a log-normal distribution is simply wrong.
Replies from: Stuart_Armstrong↑ comment by Stuart_Armstrong · 2014-12-01T11:05:54.115Z · LW(p) · GW(p)
The model used is the Black-Scholes model with, as you point out, a normal distribution. It endures, despite being clearly wrong, because there doesn't seem to be any good alternatives.
Replies from: Cthulhoo, Larks, Azathoth123↑ comment by Cthulhoo · 2014-12-04T10:52:20.550Z · LW(p) · GW(p)
I doesn't endure, not in Risk Management, anyways. Some alternatives for equities are e.g. the Heston Model or other stochastic volatilities approaches. Then, there is the whole filed of systemic risk which studies correlated crashes: events when a bunch of equities all crash at the same time are way more common than they should be and people are aware of this. See e.g. this anaysis that uses a Hawk model to capture the clustering of the crashes.
Replies from: Stuart_Armstrong↑ comment by Stuart_Armstrong · 2014-12-04T12:28:13.651Z · LW(p) · GW(p)
B-S endures, but is generally patched with insights like these.
Replies from: Cthulhoo↑ comment by Cthulhoo · 2014-12-04T14:27:43.709Z · LW(p) · GW(p)
B-S endures, but is generally patched with insights like these.
I think I can see what you mean, and in fact I partially agree, so I'll try to restate the argument. Correct me if you think I got it wrong. In my experience it's true that B-S is still used for quick and dirty bulk calculations or by organizations that don't have the means to implement more complex models. But the model's shortcomings are very well understood by the industry, and risk managers absolutely don't rely on this model when e.g. calculating the capital requirement for Basel or Solvency purposes. If they did, the regulators will utterly demolish their internal risk model.
There is still a lot of work to be done, and there is what you call model uncertainty at least when dealing with short time scales, but (fortunately) there's been a lot of progress since B-S.
↑ comment by Azathoth123 · 2014-12-02T02:55:41.608Z · LW(p) · GW(p)
How about the Black-Scholes model with a more realistic distribution?
Or does BS make annoying assumptions about its distribution, like that it has a well-defined variance and mean?
Replies from: ChristianKl↑ comment by ChristianKl · 2014-12-03T18:39:38.850Z · LW(p) · GW(p)
It assumes that the underlying model follows a Gaussian distribution but as Mandelbrot showed a Lévy distribution is a better model.
Black-Scholes is a name for a formula that was around before Black and Scholes published. Beforehand it was simply a heuristic used by traders. Those traders also did scale a few parameters around in a way that a normal distribution wouldn't allow. Black-Scholes then went and proved the formula correct for a Gaussian distribution based on advanced math.
After Black-Scholes got a "nobel prize" people stated to believe that the formula is actually measuring real risk and betting accordingly. Betting like that is benefitial for traders who make bonuses when they win but who don't suffer that much if they lose all the money they bet. Or a government bails you out when you lose all your money.
The problem with Levy distributions is that they have a parameter c that you can't simply estimate by having a random sample in the way you can estimate all the parameters of Gaussian distribution if you have a big enough sample.
*I'm no expert on the subject but the above is my understanding from reading Taleb and other reading.
Replies from: Lumifer↑ comment by Lumifer · 2014-12-03T18:47:08.699Z · LW(p) · GW(p)
I'm no expert on the subject
That is painfully visible.
I don't think contributing noise to LW is useful.
Replies from: ChristianKl↑ comment by ChristianKl · 2014-12-03T19:03:55.996Z · LW(p) · GW(p)
That is painfully visible.
Then please point me to the errors in the argument I made.
I don't think contributing noise to LW is useful.
The point of having discussions is to refine ideas. I do not believe that potential of being wrong is a reason to avoid talking about something.
Replies from: Lumifer↑ comment by Lumifer · 2014-12-03T19:27:45.142Z · LW(p) · GW(p)
You didn't make an argument. You posted a bunch of sentences which are, basically, nonsense.
I do not believe that potential of being wrong is a reason to avoid talking about something.
The problem is not the potential of being wrong, the problem is coherency and having some basic knowledge in the area which you are talking about.
If you have no clue, ask for a gentle introduction, don't spout nonsense on the forum.
Replies from: ChristianKl↑ comment by ChristianKl · 2014-12-03T19:46:00.722Z · LW(p) · GW(p)
I did read Nassim Taleb description of the situation in "Fooled By Randomness" and "The Black Swan", so I'm not sure whether you think I misrepresented Taleb or whether you think Talebs arguments are simply wrong.
"No clue" is not a good representation of my knowledge because I did read Taleb as introduction for the topic. That doesn't make me an expert, but it does give me a opinion on the topic that might be true or false.
comment by ahbwramc · 2014-11-29T00:49:09.862Z · LW(p) · GW(p)
Confidence levels inside and outside an argument seems related.
Replies from: Stuart_Armstrong↑ comment by Stuart_Armstrong · 2014-11-29T14:59:58.060Z · LW(p) · GW(p)
Added a link to that, thanks.
comment by Lumifer · 2014-11-29T04:35:15.815Z · LW(p) · GW(p)
This was apparently a 20-sigma event
That's just a complicated way of saying "the model was wrong".
So "simply" multiplying the standard deviation by seven would have been enough.
Um... it's not that easy. If your model breaks down in a pretty spectacular fashion you don't get to recover by inventing a multiple for your standard deviation. In the particular case of the stock markets, one way would be to posit a heavy-tailed underlying distribution and if it's sufficiently heavy-tailed the standard deviation isn't even defined. Another, a better way would be to recognize that the underlying generating process is not stable.
In general, the problem with recognizing the uncertainty of your model is that you still need a framework to put it into and if your model blew up you may be left without any framework at all.
Replies from: Stuart_Armstrong↑ comment by Stuart_Armstrong · 2014-11-29T14:59:45.457Z · LW(p) · GW(p)
Yes. I simply noted that taking your uncertainty range and arbitrarily expanding it was a better option that taking your uncertainty estimates and arbitrarily increasing them.
Replies from: Lumifer↑ comment by Lumifer · 2014-11-30T02:06:18.636Z · LW(p) · GW(p)
No, I don't really think so. In which way is it "a better option"?
If your model is clearly wrong, making ad hoc adjustments to its outputs will produce nothing but nonsense.
Replies from: Stuart_Armstrong↑ comment by Stuart_Armstrong · 2014-12-01T10:59:31.756Z · LW(p) · GW(p)
But some ad hoc adjustments are better than others. Black-Scholes has been clearly wrong for a long time, but there's no better option around. So use it, and add ad hoc adjustments that are more defensible.
Replies from: mwengler, EHeller, Lumifer, Richard_Kennaway↑ comment by mwengler · 2014-12-03T16:26:20.560Z · LW(p) · GW(p)
First of all, Black-Scholes is not a model of price variations of stocks. It is a model for putting values on options contracts, contracts that give their owner the right to buy or sell a stock at a particular price at a particular time in the future.
You are saying Black-Scholes is a model of stock prices probably because you recall correctly that Black-Scholes includes a model for stock price variations. To find the Black-Scholes options prices, one assumes (or models) stock price variations so that the logarithm of the variations is a normally distributed random variable. The variance, or width, of the normal distribution is simply determined by the volatility of the stock, which is determined from plotting the histogram of price variations of the stock.
The histogram of the logarithm of the variations fits a normal distribution quite well out to one or two sigma. But beyond 2 sigma or so, there are many more high variation events than the normal distribution predicts.
So if you just multiplied the variance by 7 or whatever to account for the prevalence of 20-sigma events, yes, you would now correctly predict the prevalence of 20-sigma events, but you would severely underestimate the prevalence of 1, 2, 3, 4... 19 sigma events. So this is not at all a good fix. You are attempting to fit something that is NOT bell-curved shape by covering it with a wider bell-curve.
Meanwhile, how good is black-scholes, and is there something better for options? For short dated options (less than a year to expiration), its pretty good. The calculation is more influenced by the -2sigma to 2sigma part of the curve which is accurately predicted as a log-normal, than it is by the outliers. But for longer dated options, the outliers become more and more important.
Are there better models than black-scholes for predicting options values? Yes, if you don't mind dealing with GIGO. There are models that effectively let you specify the probability distribution function curve completely, and then calculate various options prices from that. The GIGO, garbage in garbage out, arises because the "correct" probability distribution, in detail, is not known a priori. If it turns out the stock is going up, there will be more excess probability on the positive variations side then the negative variations side. If it turns out the stock is going down, it will be the other way. If you knew ahead of time whether the stock was going up or going down, you wouldn't need a calculation as complex as black-scholes to know how to get rich from that knowledge.
Replies from: Stuart_Armstrong↑ comment by Stuart_Armstrong · 2014-12-04T12:45:38.336Z · LW(p) · GW(p)
First of all, Black-Scholes is not a model of price variations of stocks.
Yes, I should be more careful when using terms. As you said, I used B-S as informal term for the log-normal variation assumptions.
↑ comment by EHeller · 2014-12-01T19:01:04.049Z · LW(p) · GW(p)
So back when I worked for a major bank, no one was really using Black-Scholes for pricing anymore. For specific uses cases, there very much are (proprietary) better options, and people use them instead of just making ad-hoc adjustments to a broken model.
↑ comment by Lumifer · 2014-12-01T16:07:07.853Z · LW(p) · GW(p)
But some ad hoc adjustments are better than others.
You keep asserting that but provide no arguments and don't explain what do you mean by "better".
Black-Scholes has been clearly wrong for a long time
Huh? Black-Scholes doesn't tell you what the price of the option is because you don't know one of the inputs (volatility). Black-Scholes is effectively a mapping function between price and volatility.
So use it, and add ad hoc adjustments
I don't understand what do you mean. In situations where Black-Scholes does not apply (e.g. you have discontinuities, aka price gaps) people use different models. Volatility smile is not a "patch" on Black-Scholes, it's an empirically observed characteristic of prices in the market and Black-Scholes is perfectly fine with it (again, being a mapping between volatility and price).
Replies from: Stuart_Armstrong↑ comment by Stuart_Armstrong · 2014-12-01T16:49:22.915Z · LW(p) · GW(p)
You keep asserting that but provide no arguments and don't explain what do you mean by "better".
The two examples in the post here are not sufficient?
Volatility smile is not a "patch" on Black-Scholes, it's an empirically observed characteristic of prices in the market and Black-Scholes is perfectly fine with it (again, being a mapping between volatility and price).
From the Wikipedia article on the subject "This anomaly implies deficiencies in the standard Black-Scholes option pricing model which assumes constant volatility..."
Replies from: Lumifer↑ comment by Lumifer · 2014-12-01T17:15:23.731Z · LW(p) · GW(p)
The two examples in the post here are not sufficient?
The two examples being the 20-sigma move and the volatility smile?
In the first example, I don't see how applying an ad hoc multiplier to a standard deviation either is "better" or makes any sense at all. In the second example, I don't think the volatility smile is an ad hoc adjustment to Black-Scholes.
This anomaly implies deficiencies
The Black-Scholes model, like any other model, has assumptions. As is common, in real life some of these assumptions get broken. That's fine because that happens to all models.
I have the impression that you think Black-Scholes tells you what the price of the option should be. That is not correct. Black-Scholes, as I said, is just a mapping function between price and implied volatility that holds by arbitrage (again, within the assumptions of the Black-Scholes model).
↑ comment by Richard_Kennaway · 2014-12-01T12:19:30.683Z · LW(p) · GW(p)
Black-Scholes has been clearly wrong for a long time, but there's no better option around.
Why is there nothing better? Given the importance to the financial world of the problem that B-S claims to be a solution to, surely people must have been trying to improve on it?
Replies from: Stuart_Armstrong, William_Quixote↑ comment by Stuart_Armstrong · 2014-12-01T12:36:03.007Z · LW(p) · GW(p)
I really don't know. I did try and investigate why they didn't, for instance, use other stable distributions than the normal one (I've been told that these resulted in non-continuous prices, but I haven't found the proof of that). It might be conservatism - this is the model that works, that everyone uses, so why deviate?
Also, the model tends to be patched (see volatility smiles) rather than replaced.
Replies from: mwengler, AnthonyC↑ comment by mwengler · 2014-12-03T16:36:40.147Z · LW(p) · GW(p)
If you plot a histogram of price variations, you see it is quite well fit by a log-normal distribution for about 99% of the daily price variations, and it is something like 1% of the daily variations that are much larger than the prediction says they should be. Since log-normal fits quite well for 99% of the variations, this pretty much means that anything other than a log-normal will fit way less of the data than does a log-normal. That's why they don't use a different distribution.
The 1% of price variations that are too large are essentially what are called "black swans." The point of Taleb's talking about black swans is to point out that this is where all the action is, this is where the information and the uncertainty are. On 99 out of 100 days you can treat a stock price as if it is log-normally distributed, and be totally safe. You can come up with strategies for harvesting small gains from this knowledge and walk along picking small coins up from trading imperfections and do well. (The small coin usually cited is the American $0.05 coin called a nickel.)
But Taleb pointed out that the math makes picking up these nickels look like a good idea because it neglects the presence of these high variation outliers. You can walk along for 100 days picking up nickels and have maybe $5.00 made, and then on the 101st day the price varies way up or way down and you lose more than $5.00 in a single day! Taleb describes that as walking along in front of steam rollers picking up nickels. Not nearly as good a business as picking up nickels in a safe environment.
Replies from: Stuart_Armstrong↑ comment by Stuart_Armstrong · 2014-12-04T12:46:18.162Z · LW(p) · GW(p)
Interesting, and somewhat in line with my impressions - but do you have a short reference for this?
Replies from: mwengler, mwengler↑ comment by mwengler · 2014-12-06T08:48:44.264Z · LW(p) · GW(p)
Sorry can't give you a reference. I wrote code a few years ago to look at this effect. I found that code and here is one figure I plotted. This is based on real stock price data for QCOM stock price 1999 through 2005. In this figure, I am looking at stock prices about 36 days apart.
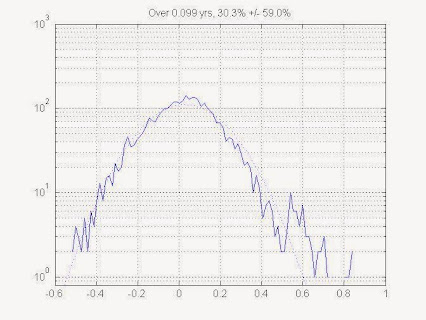 Stock price volatility from data. The random variable is log(P2/P1), the log of the later price to the earlier price. In this plot, P2 occurs 0.1 years after P1. A histogram is plotted with a logarithmic axis for the histogram count. A gaussian (bell curve) is fitted to the histogram, with a logarithmic y-axis, a gaussian is just a parabola. You can see the fit is great, except for some outliers on the positive side. Some of these outliers are quite a lot higher than the fitted gaussian, these are events that occur MANY TIMES more often that a log-normal distribution would suggest.
↑ comment by Stuart_Armstrong · 2014-12-08T08:51:50.074Z · LW(p) · GW(p)
Thanks, that's very useful!
↑ comment by mwengler · 2014-12-09T15:38:20.933Z · LW(p) · GW(p)
Stuart, since you asked I spent a little bit of time to write up what I had found and include a bunch more figures. If you are interested, they can be found here: http://kazart.blogspot.com/2014/12/stock-price-volatility-log-normal-or.html
Replies from: Stuart_Armstrong↑ comment by Stuart_Armstrong · 2014-12-09T17:57:26.902Z · LW(p) · GW(p)
Cheers!
↑ comment by AnthonyC · 2014-12-01T18:50:46.762Z · LW(p) · GW(p)
Interested financial outsider - what would it mean for prices to be non-continuous?
Replies from: Lumifer, Stuart_Armstrong↑ comment by Lumifer · 2014-12-01T19:10:53.458Z · LW(p) · GW(p)
what would it mean for prices to be non-continuous?
A stock closed at $100/share and opened at $80/share -- e.g. the company released bad earnings after the market closed.
There were no prices between $100 and $80, the stock gapped. Why is this relevant? For example, imagine that you had a position in this stock and had a standing order to sell it if the price drops to $90 (a stop-loss order). You thought that your downside is limited to selling at $90 which is true in the world of continuous prices. However the price gapped -- there was no $90 price, so you sold at $80. Your losses turned out to be worse than you expected (note that sometimes a financial asset gaps all the way to zero).
In the Black-Scholes context, the Black-Scholes option price works by arbitrage, but only in a world with continuous prices and costless transactions. If the prices gap, you cannot maintain the arbitrage and the Black-Scholes price does not hold.
Replies from: mwengler↑ comment by mwengler · 2014-12-03T16:39:30.627Z · LW(p) · GW(p)
Right, good explanation. Just to make it clearer in an alternate way, I would reword the last sentence:
- If the prices gap, you cannot maintain the arbitrage and the Black-Scholes based strategy which was making you steady money is all the sudden faced with a large loss that more than wipes out your gains.*
↑ comment by ChristianKl · 2014-12-03T18:36:17.893Z · LW(p) · GW(p)
If your function isn't continous you can't use Calculus and therefore you lose your standard tools. That means a lot of what's proven in econophysics simply can't be used.
↑ comment by Lumifer · 2014-12-03T17:07:04.276Z · LW(p) · GW(p)
Well, that's not quite what I mean.
There are many ways to derive the Black-Scholes option price. One of them is to show that that in the Black-Scholes world, the BS price is the arbitrage-free price (see e.g. here). The price being arbitrage-free depends on the ability to constantly be updating a hedge and that ability depends on prices being continuous.
If you change the Black-Scholes world by dropping the requirement for continuous asset prices, the whole construction falls apart. Essentially, the Black-Scholes formula is a solution to a particular stochastic differential equation and if the underlying process is not continuous, the math breaks down.
The real world, however, is not the Black-Scholes world and there ain't no such thing as a "Black-Scholes based strategy which was making you steady money".
↑ comment by Stuart_Armstrong · 2014-12-01T20:19:03.362Z · LW(p) · GW(p)
I don't know. I assume it means that stock prices would be subject to jumps at all scales. I just know this was a reason given for using normal distributions.
↑ comment by William_Quixote · 2014-12-01T12:26:03.275Z · LW(p) · GW(p)
Primarily because real world options pricing is influenced by a near infinite number of variables, many of which are non financial and BS is a model with a few variables all of which are financial in nature. I don't think there could be one model that featured all potnecialy relevant non financial variables. If there was, it wouldn't be computationaly tractable.
BS tends to be off on tail risk where specifc non financial events can have a big impact on a company or a specifc option. So the best aproach is to model the core financial risk with BS and use ad hoc adjustments to increase tail risk based on relevent non financial factors for a specific company.
Replies from: Stuart_Armstrong↑ comment by Stuart_Armstrong · 2014-12-01T12:26:55.320Z · LW(p) · GW(p)
BS fails even on purely financial issues - its tails are just too thin.
Replies from: Lumifer↑ comment by Lumifer · 2014-12-01T16:10:10.617Z · LW(p) · GW(p)
BS fails even on purely financial issues
So why don't you become rich by exploiting this failure? If Black-Scholes fails in an obvious (to you) manner, options in the market must be mispriced and you can make a lot of money from this mispricing.
Replies from: CronoDAS, EHeller, Stuart_Armstrong, ChristianKl, None↑ comment by CronoDAS · 2014-12-06T00:51:04.408Z · LW(p) · GW(p)
The market can stay irrational longer than you can stay solvent.
Replies from: Lumifer↑ comment by Lumifer · 2014-12-09T18:09:42.501Z · LW(p) · GW(p)
In this case you don't have to wait for the market to become rational. If the options are mispriced, you will be able to realize your (statistically expected) gains at the expiration.
Financial instruments that expire (like options or, say, most bonds) allow you to take advantage of the market mispricing even if the market continues to misprice the securities.
Replies from: CronoDAS↑ comment by CronoDAS · 2014-12-11T23:31:02.648Z · LW(p) · GW(p)
True, but if most of your statistically expected gains comes from rare events, you can still go broke before you get a winning lottery ticket, even if the lottery is positive expected value. I have no idea if there are any real-world financial instruments that work like this, though.
Replies from: Lumifer↑ comment by Lumifer · 2014-12-12T03:23:47.222Z · LW(p) · GW(p)
if most of your statistically expected gains comes from rare events, you can still go broke before you get a winning lottery ticket, even if the lottery is positive expected value.
True -- that's why risk management is a useful thing :-)
And yes, options are real-world financial instruments that work like that.
↑ comment by Stuart_Armstrong · 2014-12-01T16:46:46.560Z · LW(p) · GW(p)
Ok, here's an obvious failure: volatility smiles. Except that that's known and you can't exploit it. And people tend to stop using BS for predicting large market swings. Most of the opportunities for exploiting the flaws of BS are already covered by people who use BS+patches. There might be some potential for long term investments, though, where investors are provably less likely to exploit weaknesses.
Even if there's a known failure, though, you still might be unable to exploit it. In some situations, irrational noise traders can make MORE expected income that more rational traders; this happens because they take on more risk than they realise. So go broke more often, but, still, an increasing fraction of the market's money ends up in noise traders' hands.
Replies from: Lumifer↑ comment by Lumifer · 2014-12-01T16:56:24.786Z · LW(p) · GW(p)
Ok, here's an obvious failure
Why is it a failure and a failure of what, precisely?
people tend to stop using BS for predicting large market swings
Sense make not. Black-Scholes is a formula describing a relationship between several financial variables, most importantly volatility and price, based on certain assumptions. You don't use it to predict anything.
In some situations, irrational noise traders can make MORE expected income that more rational traders; this happens because they take on more risk than they realise.
I don't quite understand that sentence as applied to reality. The NBER paper presents a model which it then explores, but it fails to show any connection to real life. As a broad tendency (with lots of exceptions), taking on more risk gives you higher expected return. How is this related to Black-Scholes, market failures, and inability to exploit market mispricings?
Replies from: Stuart_Armstrong↑ comment by Stuart_Armstrong · 2014-12-01T17:17:04.055Z · LW(p) · GW(p)
You don't use it to predict anything.
Come on now, be serious. Would you ever write this:
"General relativity is a formula describing a relationship between several physical variables, most importantly momentum and energy, based on certain assumptions. You don't use it to predict anything." ?
Replies from: Lumifer↑ comment by Lumifer · 2014-12-01T17:31:42.109Z · LW(p) · GW(p)
Come on now, be serious.
I am serious. The market tells you the market's forecast for the future via prices. You can use Black-Scholes to translate the prices which the market gives you into implied volatilities. But that's not a "prediction" -- you just looked at the market and translated into different units.
Can you give me an example of how Black-Scholes predicts something?
Replies from: Stuart_Armstrong↑ comment by Stuart_Armstrong · 2014-12-01T18:23:39.734Z · LW(p) · GW(p)
BS is not just an equation, it is also a model. It predicts the relationships between the volatility and price of the underlying assets, and price of the derivative (and risk free rate, and a few other components). In as much as you can estimate the volatility (the rest is pretty clear) you can see whether the model is correct. And it often is, but not always:
See for instance: http://en.wikipedia.org/wiki/Black%E2%80%93Scholes_model#Black.E2.80.93Scholes_in_practice
Now you might say that the equation shouldn't be used as a model... but it is, and as such, makes predictions.
Replies from: Lumifer↑ comment by Lumifer · 2014-12-01T19:00:10.583Z · LW(p) · GW(p)
BS is not just an equation, it is also a model
Yes. Or, rather, there is a Black-Scholes options pricing model which gives rise to the Black-Scholes equation.
It predicts the relationships
No, it does not predict, it specifies this relationship.
In as much as you can estimate the volatility (the rest is pretty clear) you can see whether the model is correct.
Heh. And how are you going to disambiguate between your volatility estimate being wrong and the model being wrong?
Let me repeat again: Black-Scholes does not price options in the real world in the sense that it does not tell you what the option price should be. Black-Scholes is two things.
First, it's a model (a map in local terms) which describes a particular simple world. In the Black-Scholes world, for example, prices are continuous. As usual, this model resembles the real world in certain aspects and does not match it on other aspects. Within the Black-Scholes world, the Black-Scholes option price holds by arbitrage -- that is, if someone offers a market in options at non-BS prices you would be able to make riskless profits off them. However the real world is not the Black-Scholes world.
Second, it's a converter between price and implied volatility. In the options markets it's common to treat these two terms interchangeably in the recognition that given all other inputs (which are observable and so known) the Black-Scholes formula gives you a specific price for each volatility input and vice versa, gives you a specific implied volatility for each price input.
Replies from: Stuart_Armstrong, Larks↑ comment by Stuart_Armstrong · 2014-12-04T13:07:44.418Z · LW(p) · GW(p)
No, it does not predict, it specifies this relationship.
And specifies it incorrectly (in as much as it purports to model reality). The volatility smile is sufficient to show this, as the implied volatility for the same underlying asset is different for different options based on it.
↑ comment by Larks · 2014-12-04T04:01:02.267Z · LW(p) · GW(p)
Yes, there's a reason we look at options-implied vol - it's because B-S and the like are where we get our estimates of vol from!
Replies from: Lumifer↑ comment by Lumifer · 2014-12-04T04:37:13.161Z · LW(p) · GW(p)
it's because B-S and the like are where we get our estimates of vol from!
In the sense that Black-Scholes converts prices to implied volatility, yes. However implied volatility from the options markets is a biased predictor of future realized volatility -- it tends to overestimate it quite a bit.
↑ comment by ChristianKl · 2014-12-03T18:39:04.607Z · LW(p) · GW(p)
Just because you can pick a strategy that should have an expected postivie return doesn't mean that you automatically get rich. People do drown in a river of average depth of 1 meter.
↑ comment by [deleted] · 2014-12-01T16:31:57.600Z · LW(p) · GW(p)
Knowing that there is a mispricing doesn't tell you what the correct price actually is, which is what you need to know in order to make better money than random-walk models.
Replies from: Lumifer↑ comment by Lumifer · 2014-12-01T16:48:06.530Z · LW(p) · GW(p)
Knowing that there is a mispricing doesn't tell you what the correct price actually is
In this particular case the problem mentioned is too thin tails of the underlying distribution. If you believe the problem is real, you know the sign of the mispricing and that's all you need.
Replies from: Vaniver↑ comment by Vaniver · 2014-12-03T20:00:54.093Z · LW(p) · GW(p)
For this particular example, this basically means that you can predict that LTCM will fail spectacularly when rare negative events happen. But could you reliably make money knowing that LTCM will fail eventually? If you buy their options that pay off when terrible things happen, you're trusting that they'll be able to pay the debts you're betting they can't pay. If you short them, you're betting that the failure happens before you run out of money.
Replies from: Lumifer, Larks↑ comment by Lumifer · 2014-12-03T21:42:52.067Z · LW(p) · GW(p)
But could you reliably make money knowing that LTCM will fail eventually?
Just LTCM, no. But (if we ignore the transaction costs which make this idea not quite practicable) there are enough far-out-of-the-money options being traded for me to construct a well-diversified portfolio that would allow me to reliably make money -- of course, only if these options were Black-Scholes priced on the basis of the same implied volatility as the near-the-money options and in reality they are not.
Replies from: Azathoth123↑ comment by Azathoth123 · 2014-12-04T04:36:49.478Z · LW(p) · GW(p)
This assumes the different black swans are uncorrelated.
Replies from: Lumifer↑ comment by Larks · 2014-12-04T04:02:10.214Z · LW(p) · GW(p)
you're trusting that they'll be able to pay the debts you're betting they can't pay.
LTCM should not be your counter-party! Also, using a clearinghouse eliminates much of the risk.
Replies from: CronoDAS↑ comment by CronoDAS · 2014-12-11T23:44:52.311Z · LW(p) · GW(p)
IIRC, LCTM ended up in disaster not only because of a Russian default/devaluation. They had contracts with Russian banks that would have protected them, except that the Russian government also passed a law making it illegal for Russian banks to pay out on those contracts. It's hard to hedge against all the damage a government can do if it wants.
Replies from: William_Quixote↑ comment by William_Quixote · 2014-12-12T00:34:07.428Z · LW(p) · GW(p)
As a historical note, the LTCM crisis was caused by Russias default, but LTCM did not bet on Russia or rely on Russian banks. LTCMs big bet was on a narrowing of the price difference between 30 year treasurys and 29 year treasurys. When Russia defaulted people moved out of risky assets into safe assets and lots of people bought 30 years. That temporary huge burst in demand led to a rise in the price of 30s. Given the high leverage of LTCM that was enouph to make them go bust.
Replies from: CronoDAS, Lumifercomment by [deleted] · 2014-11-30T22:11:23.195Z · LW(p) · GW(p)
Isn't this more or less what mixture models were made for?
Replies from: Stuart_Armstrong↑ comment by Stuart_Armstrong · 2014-12-01T11:05:09.370Z · LW(p) · GW(p)
Those can work, if you have clear alternative candidate models. But it's not clear how you would have done that here, in, say the second problem. The model you would have mixed with is something like "lithium-7 is actually reactive on relevant timescales here"; that's not really a model, barely a coherent assumption.
comment by Shmi (shminux) · 2014-11-28T22:37:09.684Z · LW(p) · GW(p)
Re Black Monday, and possibly Castle Bravo, this site devoted to Managing the Unexpected seems to have some relevant research and recommendations.
And I don't think that your last example is in the same category of uncertain models with certain predictions.
Replies from: Stuart_Armstrong↑ comment by Stuart_Armstrong · 2014-11-29T15:05:21.529Z · LW(p) · GW(p)
And I don't think that your last example is in the same category of uncertain models with certain predictions.
It is somewhat different, yes. Do you have a better example, still with huge negative impact?
comment by Larks · 2014-12-04T03:54:46.527Z · LW(p) · GW(p)
Such events have a probability of around 10-50 of happening
No, you cannot infer a probability just from a SD. You also need to know what type of distribution it is. You're implicitly assuming a normal distribution, but everyone knows asset price returns have negative skew and excess kurtosis.
You could easily correct this by adding "If you use a normal distribution...".
Replies from: Stuart_Armstrong↑ comment by Stuart_Armstrong · 2014-12-04T12:27:11.387Z · LW(p) · GW(p)
I'm not implicitly assuming it - the market models were the ones explicitly assuming it.
Replies from: Larks↑ comment by Larks · 2014-12-05T01:08:21.908Z · LW(p) · GW(p)
Up to this point in the post you haven't mentioned any models. If you give a probability without first mentioning a model for it to be relative to, the implication is that you are endorsing the implicit model. But this is just nit-picking.
More importantly, there are many models used by people in the market. Plenty of people use far more sophisticated models. You can't just say "the market models" without qualification or citation.
comment by Shmi (shminux) · 2014-11-30T17:01:40.873Z · LW(p) · GW(p)
Seems that (a generalization of) the equation 1 in the paper by Toby Ord http://arxiv.org/abs/0810.5515 linked in the comments to Yvain's post is something like what you are looking for.
Replies from: Stuart_Armstrong↑ comment by Stuart_Armstrong · 2014-12-01T11:02:16.405Z · LW(p) · GW(p)
This post is looking for salient examples of that type of behaviour.
comment by joaolkf · 2014-11-29T03:00:50.161Z · LW(p) · GW(p)
On October 18, 1987, what sort of model of uncertainty of models one would have to have to say the uncertainty over the 20-sigma estimative was enough to allow it to be 3-sigma? 20-sigma, give 120 or take 17? Seems a bit extreme, and maybe not useful.
Replies from: Stuart_Armstrong↑ comment by Stuart_Armstrong · 2014-11-29T15:02:05.488Z · LW(p) · GW(p)
This seems to depend almost entirely on what other models you had. A 1% belief in a wider model (say one using a Cauchy distribution rather than a normal one) might have been sufficient to make the result considerably less surprising.