Reflections on AI Timelines Forecasting Thread
post by Amandango · 2020-09-01T01:42:40.349Z · LW · GW · 7 commentsContents
  AGI timelines
    Summary of beliefs
    Emergence of categories
  Did this thread change people’s minds?
  Learnings about forecasting
    Vaguely defining the question worked surprisingly well
    Value of a template for predictions
    Creating AGI forecasting frameworks
  What’s next? Some open questions
    Questions I'm curious about
    Ideas we have for next steps
None
7 comments
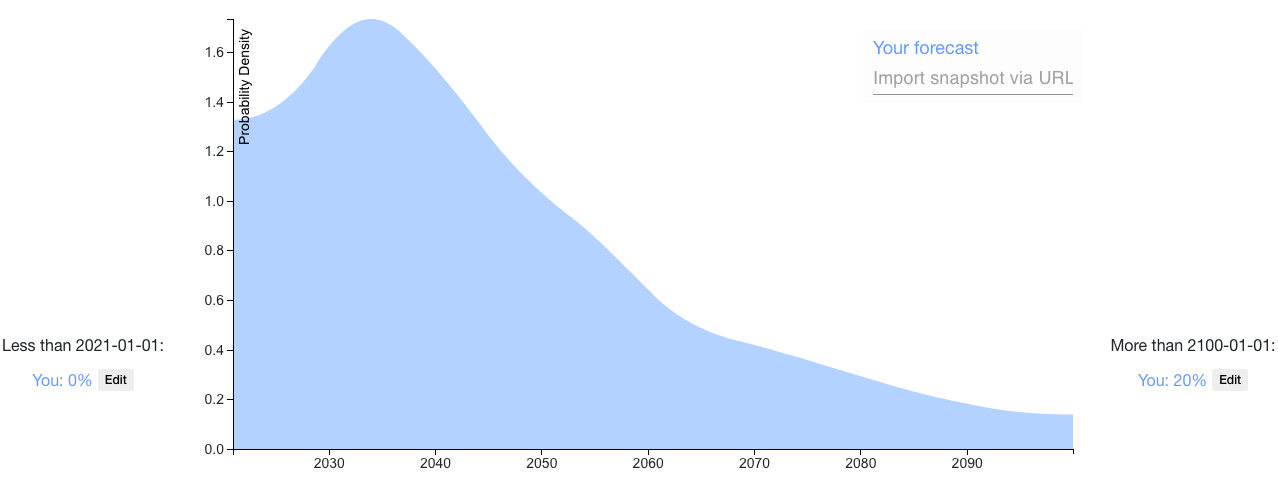
It’s been exciting to see people engage with the AI forecasting thread [LW · GW] that Ben, Daniel, and I set up! The thread was inspired by Alex Irpan’s AGI timeline update, and our hypothesis that visualizing and comparing AGI timelines could generate better predictions [LW(p) · GW(p)]. Ought has been working on the probability distribution tool, Elicit, and it was awesome to see it in action.
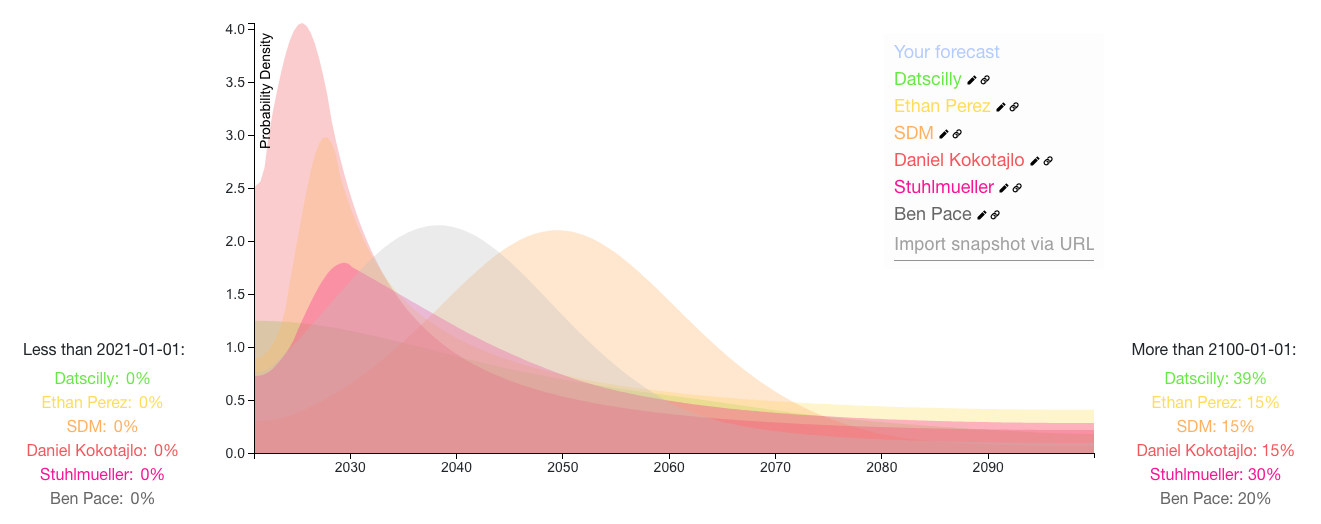
14 users shared their AGI timelines. Below are a number of their forecasts overlaid, and an aggregation of their forecasts.
Comparison of 6 top-voted forecasts
Aggregation, weighted by votes
The thread generated some interesting learnings about AGI timelines and forecasting. Here I’ll discuss my thoughts on the following:
- The object level discussion of AGI timelines
- How much people changed their minds and why
- Learnings about forecasting
- Open questions and next steps
AGI timelines
Summary of beliefs
We calculated an aggregation of the 14 forecasts weighted by the number of votes each comment with a forecast received. The question wasn’t precisely specified (people forecasted based on slightly different interpretations) so I’m sharing these numbers mostly for curiosity’s sake, rather than to make a specific claim about AGI timelines.
- Aggregated median date: June 20, 2047
- Aggregated most likely date: November 2, 2033
- Earliest median date of any forecast: June 25, 2030
- Latest median date of any forecast: After 2100
Emergence of categories
I was pleasantly surprised by the emergence of categorizations of assumptions. Here are some themes in the way people structured their reasoning:
- AGI from current paradigm (2023 – 2033)
- GPT-N gets us to AGI
- GPT-N + improvements within existing paradigm gets us to AGI
- AGI from paradigm shift (2035 – 2060)
- We need fundamental technical breakthroughs
- Quantum computing
- Other new paradigms
- We need fundamental technical breakthroughs
- AGI after 2100, or never (2100 +)
- We decide not to build AGI
- We decide to build tool AI / CAIS instead
- We move into a stable state
- It’s harder than we expect
- It’s hard to get the right insights
- We won’t have enough compute by 2100
- We can’t built AGI
- There’s a catastrophe that stops us from being able to build AGI
- We decide not to build AGI
- Outside view reasoning
- With 50% probability, things will last twice as long as they already have
- We can extrapolate from rate of reaching past AI milestones
When sharing their forecasts, people associated these assumptions with a corresponding date interval for when we would see AGI. I took the median lower bound and median upper bound for each assumption to give a sense of what people are expecting if each assumption is true. Here’s a spreadsheet with all of the assumptions. Feel free to make a copy of the spreadsheet if you want to play around and make edits.
Did this thread change people’s minds?
One of the goals of making public forecasts is to help people identify disagreements and resolve cruxes. The number of people who updated is one measure of how well this format achieves this goal.
There were two updates in comments on the thread (Ben Pace [LW(p) · GW(p)] and Ethan Perez [LW(p) · GW(p)]), and several others not explicitly on the thread. Here are some characteristics of the thread that caused people to update (based on conversations and inference from comments):
- It was easy to notice surprising probabilities. In most forecasts, Elicit’s bin interface meant probabilities were linked to specific assumptions. For example, it was easy to disagree with Ben Pace’s specific belief that with 30% probability, we’d reach a stable state and therefore wouldn’t get AGI before 2100. Seeing a visual image of people’s distributions also made surprising beliefs (like sharp peaks) easy to spot.
- Visual comparison provided a sense check. It was easy to verify whether you had too little or too much uncertainty compared to others.
- Seeing many people’s beliefs provides new information. Separate from the information provided by people’s reasoning, there’s information in how many people support certain viewpoints. For example, multiple people placed a non-trivial probability mass on the possibility that we could get AGI from scaling GPT-3.
- The thread catalyzed conversations outside of LessWrong
Learnings about forecasting
Vaguely defining the question worked surprisingly well
The question in this thread (“Timeline until human-level AGI”) was defined much less precisely than similar Metaculus questions. This meant people were able to forecast using their preferred interpretation, which provided more information about the range of possible interpretations and sources of disagreements at the interpretation level. For example:
- tim_dettmers’ forecast [LW(p) · GW(p)] defined AGI as not making ‘any "silly" mistakes,’ which generated a substantially different distribution
- datscilly’s forecast [LW(p) · GW(p)] used the criteria from this Metaculus question and this Metaculus question, including, for example: “Able to reliably pass a Turing test of the type that would win the Loebner Silver Prize.”
- Rohin Shah [LW(p) · GW(p)] predicted timelines for transformative AI
A good next step would be to create more consensus on the most productive interpretation for AGI timeline predictions.
Value of a template for predictions
When people make informal predictions on AGI, they often define their own intervals and ways of specifying probabilities (e.g. ‘30% probability by 2035’, or ‘highly likely by 2100’). For example, this list of predictions shows how vague a lot of timeline predictions are.
Having a standard template for predictions forces people to have numerical beliefs across an entire range. This makes it easier to compare predictions and compute disagreements across any range (e.g. this bet suggestion [LW(p) · GW(p)] based on finding the earliest range with substantial disagreement). I’m curious how much more information we can capture over time by encouraging standardized predictions.
Creating AGI forecasting frameworks
Ought’s mission is to apply ML to complex reasoning. A key first step is making reasoning about the future explicit (for example, by decomposing the components of a forecast, isolating assumptions, and putting numbers to beliefs) so that we can then automate parts of the process. We’ll share more about this in a blog post that’s coming soon!
In this thread, it seemed like a lot of people built their own forecasting structure from scratch. I’m excited about leveraging this work to create structured frameworks that people can start with when making AGI forecasts. This has the benefits of:
- Avoiding replication of cognitive work
- Clearly isolating the assumptions that people disagree with
- Generating more rigorous reasoning by encouraging people to examine the links between different components of a forecast and make them explicit
- Providing data that helps us automate the reasoning process
Here are some ideas for what this might look like:
- Decomposing the question more comprehensively based on the categories outlined above
- For example, creating your overall distribution by calculating: P(Scaling hypothesis is true) * Distribution for when we will get AGI | Scaling hypothesis is true + P(Need paradigm shift) * Distribution for when we will get AGI | Need paradigm shift + P(Something stops us) * Distribution for when we will get AGI | Something stops us
- Decomposing AGI timelines into the factors that will influence it
- For example, compute or investment
- Inferring distributions from easy questions
- For example, asking questions like: “If the scaling hypothesis is true, what’s the mean year we get AGI?” and use the answers to infer people’s distributions
What’s next? Some open questions
I’d be really interested in hearing other people’s reflections on this thread.
Questions I'm curious about
- How was the experience for other people who participated?
- What do people who didn’t participate but read the thread think?
- What updates did people make?
- What other questions would be good to make forecasting threads on?
- What else can we learn from information in this thread, to capture the work people did?
- How can Elicit be more helpful for these kinds of predictions?
- How else do you want to build on the conversation started in the forecasting thread?
Ideas we have for next steps
- Running more forecasting threads on other x-risk / catastrophic risks. For example:
- When will humanity go extinct from global catastrophic biological risks?
- How many people will die from nuclear war before 2200?
- When will humanity go extinct from asteroids?
- By 2100, how many people will die for reasons that would not have occurred if we solved climate change by 2030?
- More decomposition and framework creation for AGI timeline predictions
- We’re working on making Elicit as useful as we can for this!
7 comments
Comments sorted by top scores.
comment by Ethan Perez (ethan-perez) · 2020-09-01T03:13:37.904Z · LW(p) · GW(p)
It would be awesome to easily ensemble Elicit distributions (e.g., take a weighted average). If ensembling were easy, I would have definitely updated my distribution more aggressively, e.g., averaging my inside view / prosaic AGI scenario distribution [LW(p) · GW(p)] with datscilly's outside view distribution [LW(p) · GW(p)] (instead of a uniform distribution as an outside view), and/or other distributions which weighed different considerations more heavily (e.g., hardware constraints). It'd be quite informative to see each commenter's independent/original/prior distribution (before to viewing everyone else's), and then each commenter's ensembled/posterior distribution, incorporating or averaging with the distributions of others. I suspect in many cases these two distributions would look quite different, so it would be easy for people to quickly update their views based on the arguments/distributions of others (and see how much they updated).
Replies from: Amandango↑ comment by Amandango · 2020-09-07T01:48:15.938Z · LW(p) · GW(p)
Here's a colab you can use to do this! I used it to make these aggregations:
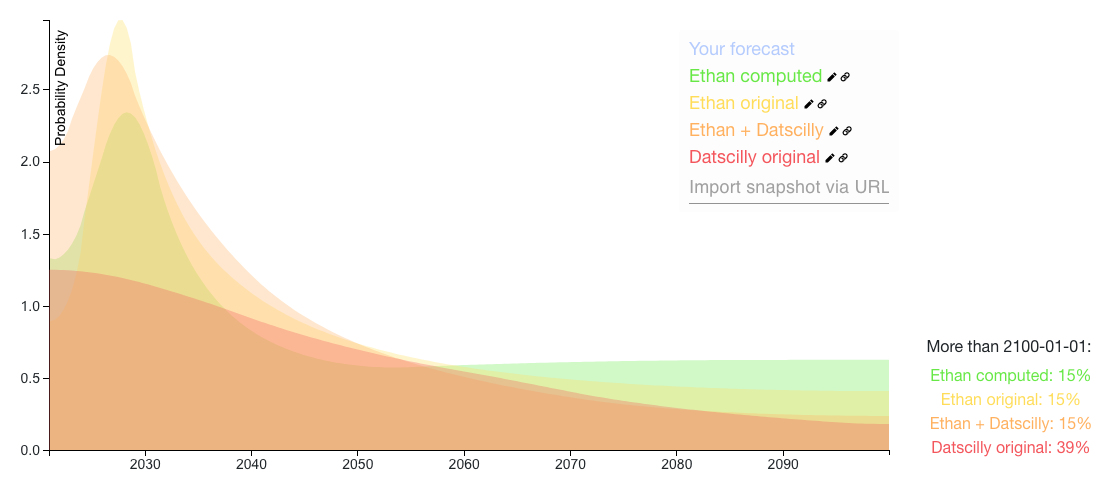
The Ethan + Datscilly distribution is a calculation of:
- 25% * Your inside view of prosaic AGI
- 60% * Datscilly's prediction (renormalized so that all the probability < 2100)
- 15% * We get AGI > 2100 or never
This has an earlier median (2040) than your original distribution (2046).
(Note for the colab: You can use this to run your own aggregations by plugging in Elicit snapshots of the distributions you want to aggregate. We're actively working on the Elicit API, so if the notebook breaks lmk so we can update it).
Replies from: ethan-perez↑ comment by Ethan Perez (ethan-perez) · 2020-09-07T02:20:25.213Z · LW(p) · GW(p)
Wow thanks for doing this! My takeaways:
- Your "Ethan computed" distribution matches the intended/described distribution from my original prediction comment. The tail now looks uniform, while my distribution had an unintentional decay that came from me using Elicit's smoothing.
- Now that I see how uniform looks visually/accurately, it does look slightly odd (without any decay towards zero), and a bit arbitrary that the uniform distribution ends at 2100. So I think it makes a lot of sense to use Datscilly's outside view as my outside view prior as you did! So overall, I think the ensembled distribution more accurately represents my beliefs, after updating on the other distributions in the LessWrong AGI timelines post.
- The above ensemble distribution looks pretty optimistic, which makes me wonder if there is some "double counting" of scenarios-that-lead-to-AGI between the inside and outside view distributions. I.e., Datscilly's outside view arguably does incorporate the possibility that we get AGI via "Prosaic AGI" as I described it.
comment by Matthew Barnett (matthew-barnett) · 2020-09-03T10:21:16.733Z · LW(p) · GW(p)
Here, Metaculus predicts when transformative economic growth will occur. Current status:
25% chance before 2058.
50% chance before 2093.
75% chance before 2165.
Replies from: joshjacobson↑ comment by Josh Jacobson (joshjacobson) · 2021-04-06T23:37:02.738Z · LW(p) · GW(p)
This has very recently (over the past week) changed drastically to the median being 2189.
comment by Davidmanheim · 2020-09-03T06:04:37.643Z · LW(p) · GW(p)
"A good next step would be to create more consensus on the most productive interpretation for AGI timeline predictions. "
Strongly agree with this. I don't think the numbers are meaningful, since AGI could mean anything from "a CAIS system-of-systems that can be used to replace most menial jobs with greater than 50% success," to "a system that can do any one of the majority of current jobs given an economically viable (<$10m) amount of direct training and supervision" to "A system that can do everything any human is able to do at least as well as that human, based only on available data and observation, without any direct training or feedback, for no marginal cost."
Replies from: Amandango↑ comment by Amandango · 2020-09-07T01:55:49.614Z · LW(p) · GW(p)
I also just discovered BERI's x-risk prediction market question set and Jacobjacob & bgold's AI forecasting database [LW · GW], which seem really helpful for this!