Posts
Comments
An update: We've set up a way to link your LessWrong account to your Elicit account. By default, all your LessWrong predictions will show up in Elicit's binary database but you can't add notes or filter for your predictions.
If you link your accounts, you can:
* Filter for and browse your LessWrong predictions on Elicit (you'll be able to see them by filtering for 'My predictions')
* See your calibration for LessWrong predictions you've made that have resolved
* Add notes to your LessWrong predictions on Elicit
* Predict on LessWrong questions in the Elicit app
If you want us to link your accounts, send me an email (amanda@ought.org) with your LessWrong username and your Elicit account email!
This was a good catch! I did actually mean world GDP, not world GDP growth. Because people have already predicted on this, I added the correct questions above as new questions, and am leaving the previous questions here for reference:
If you're the question author, you can resolve your question on Elicit by clicking 'Yes' or 'No' in the expanded question!
How to add your own questions:
- Go to elicit.org/binary
- Type your question into the field at the top
- Click on the question title, and click the copy URL button
- Paste the URL into the LessWrong editor
See our launch post for more details!
You can search for the question on elicit.org/binary and see the history of all predictions made! E.G. If you copy the question title in this post, and search by clicking Filter then pasting the title into "Question title contains," you can find the question here.
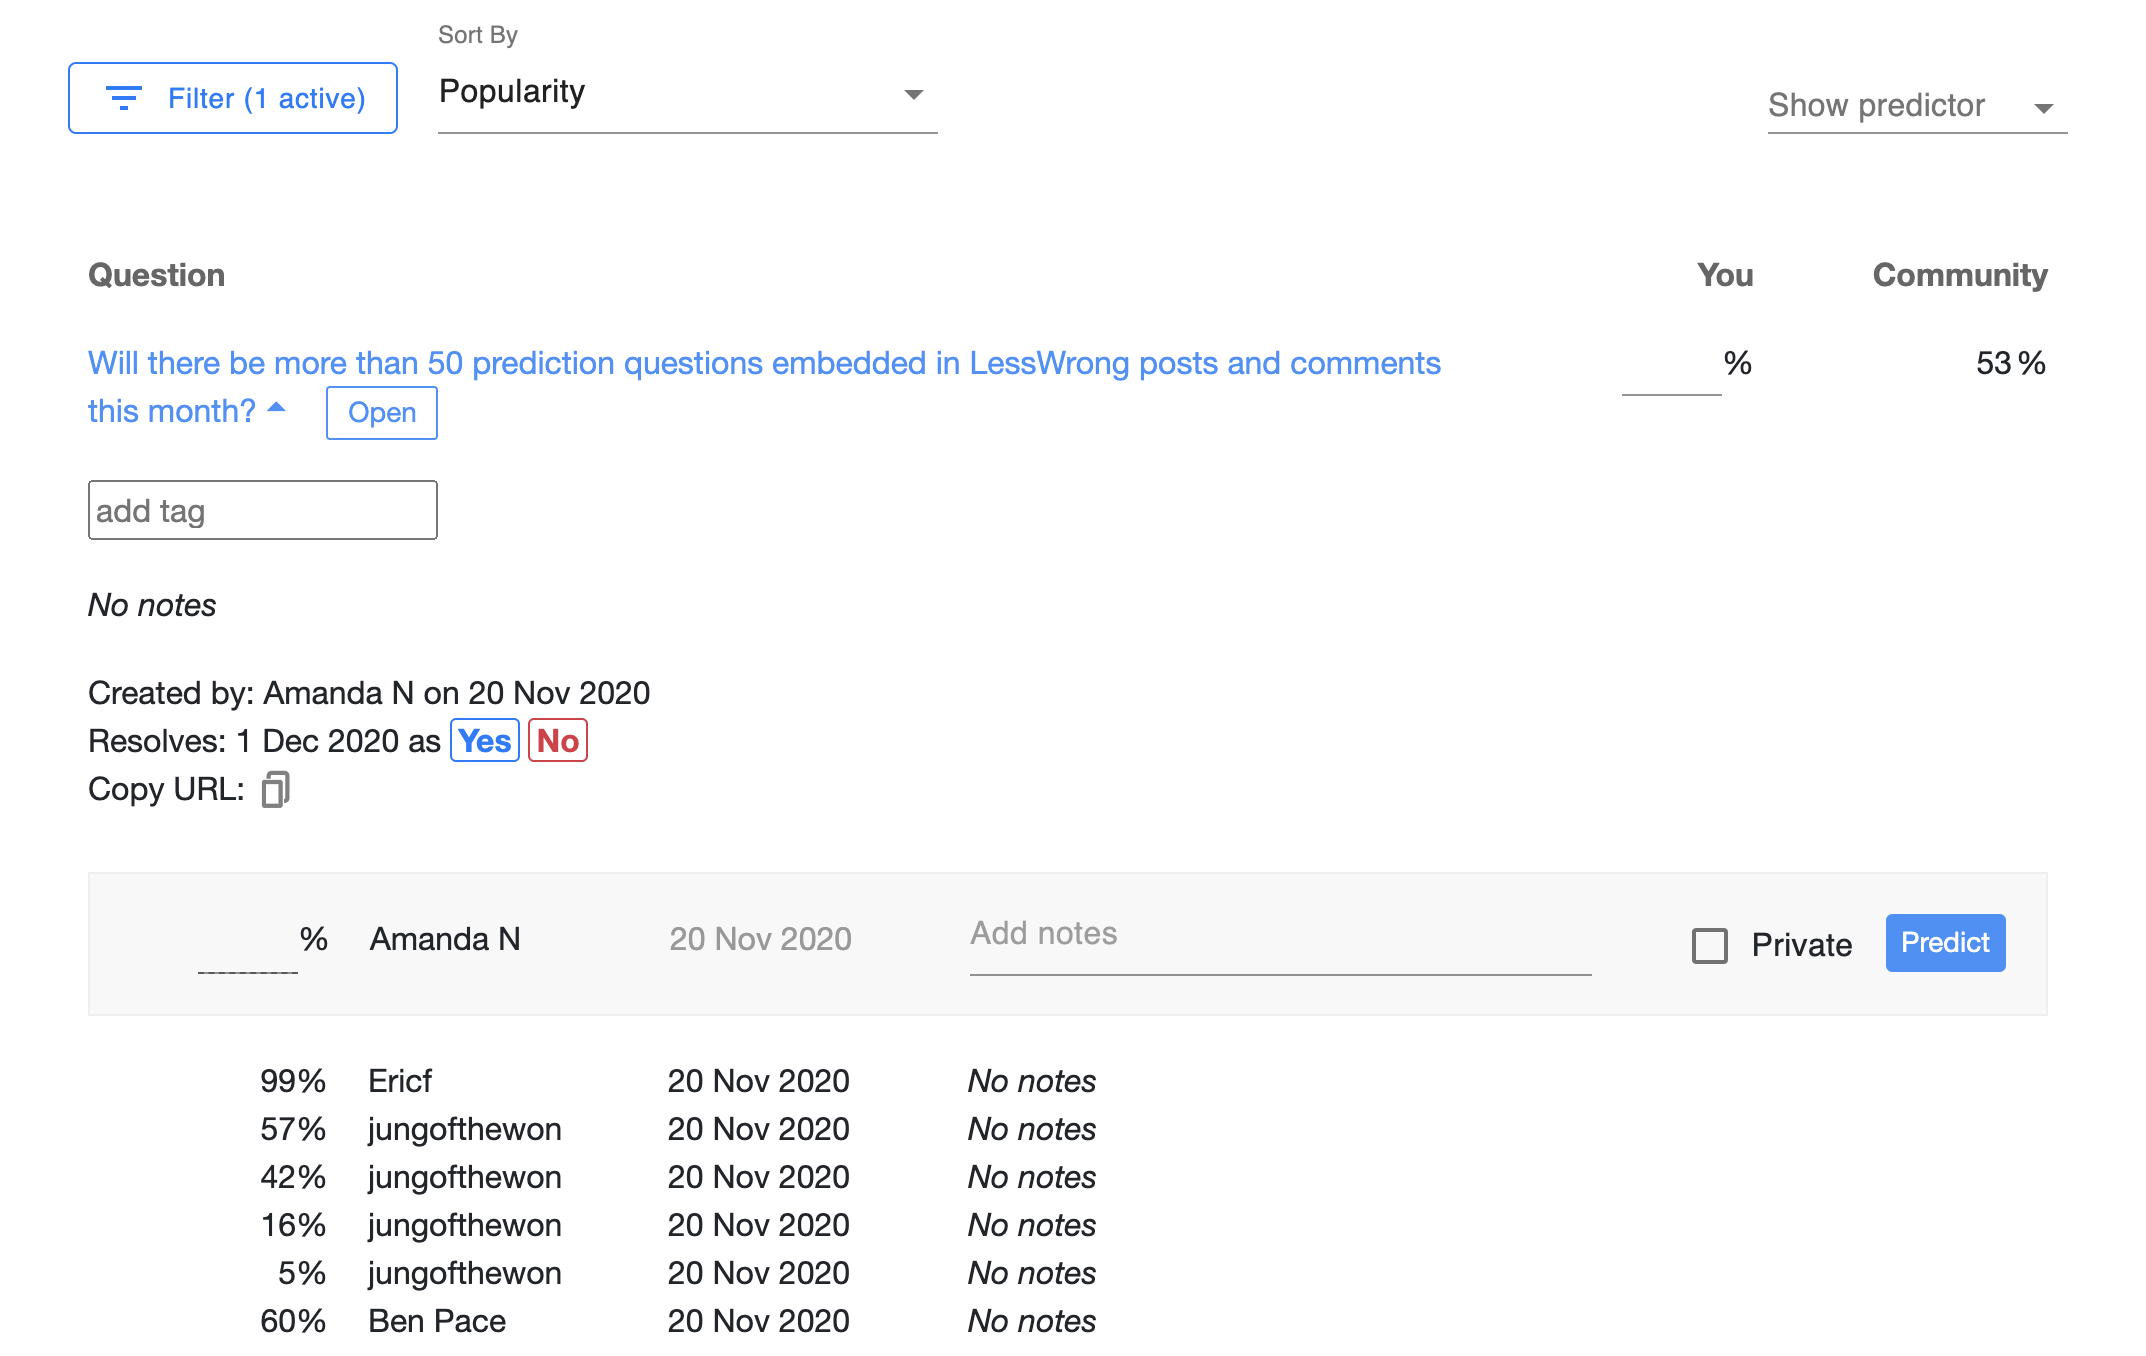
I'm counting using this to express credence on claims as a non-prediction use!
Thanks!! It's primarily intended for prediction, but I feel excited about people experimenting with different ways of using this and seeing which are most useful & how they change discussions, so am interested to see what happens if you use it for other purposes too.
Thanks Jacob!!
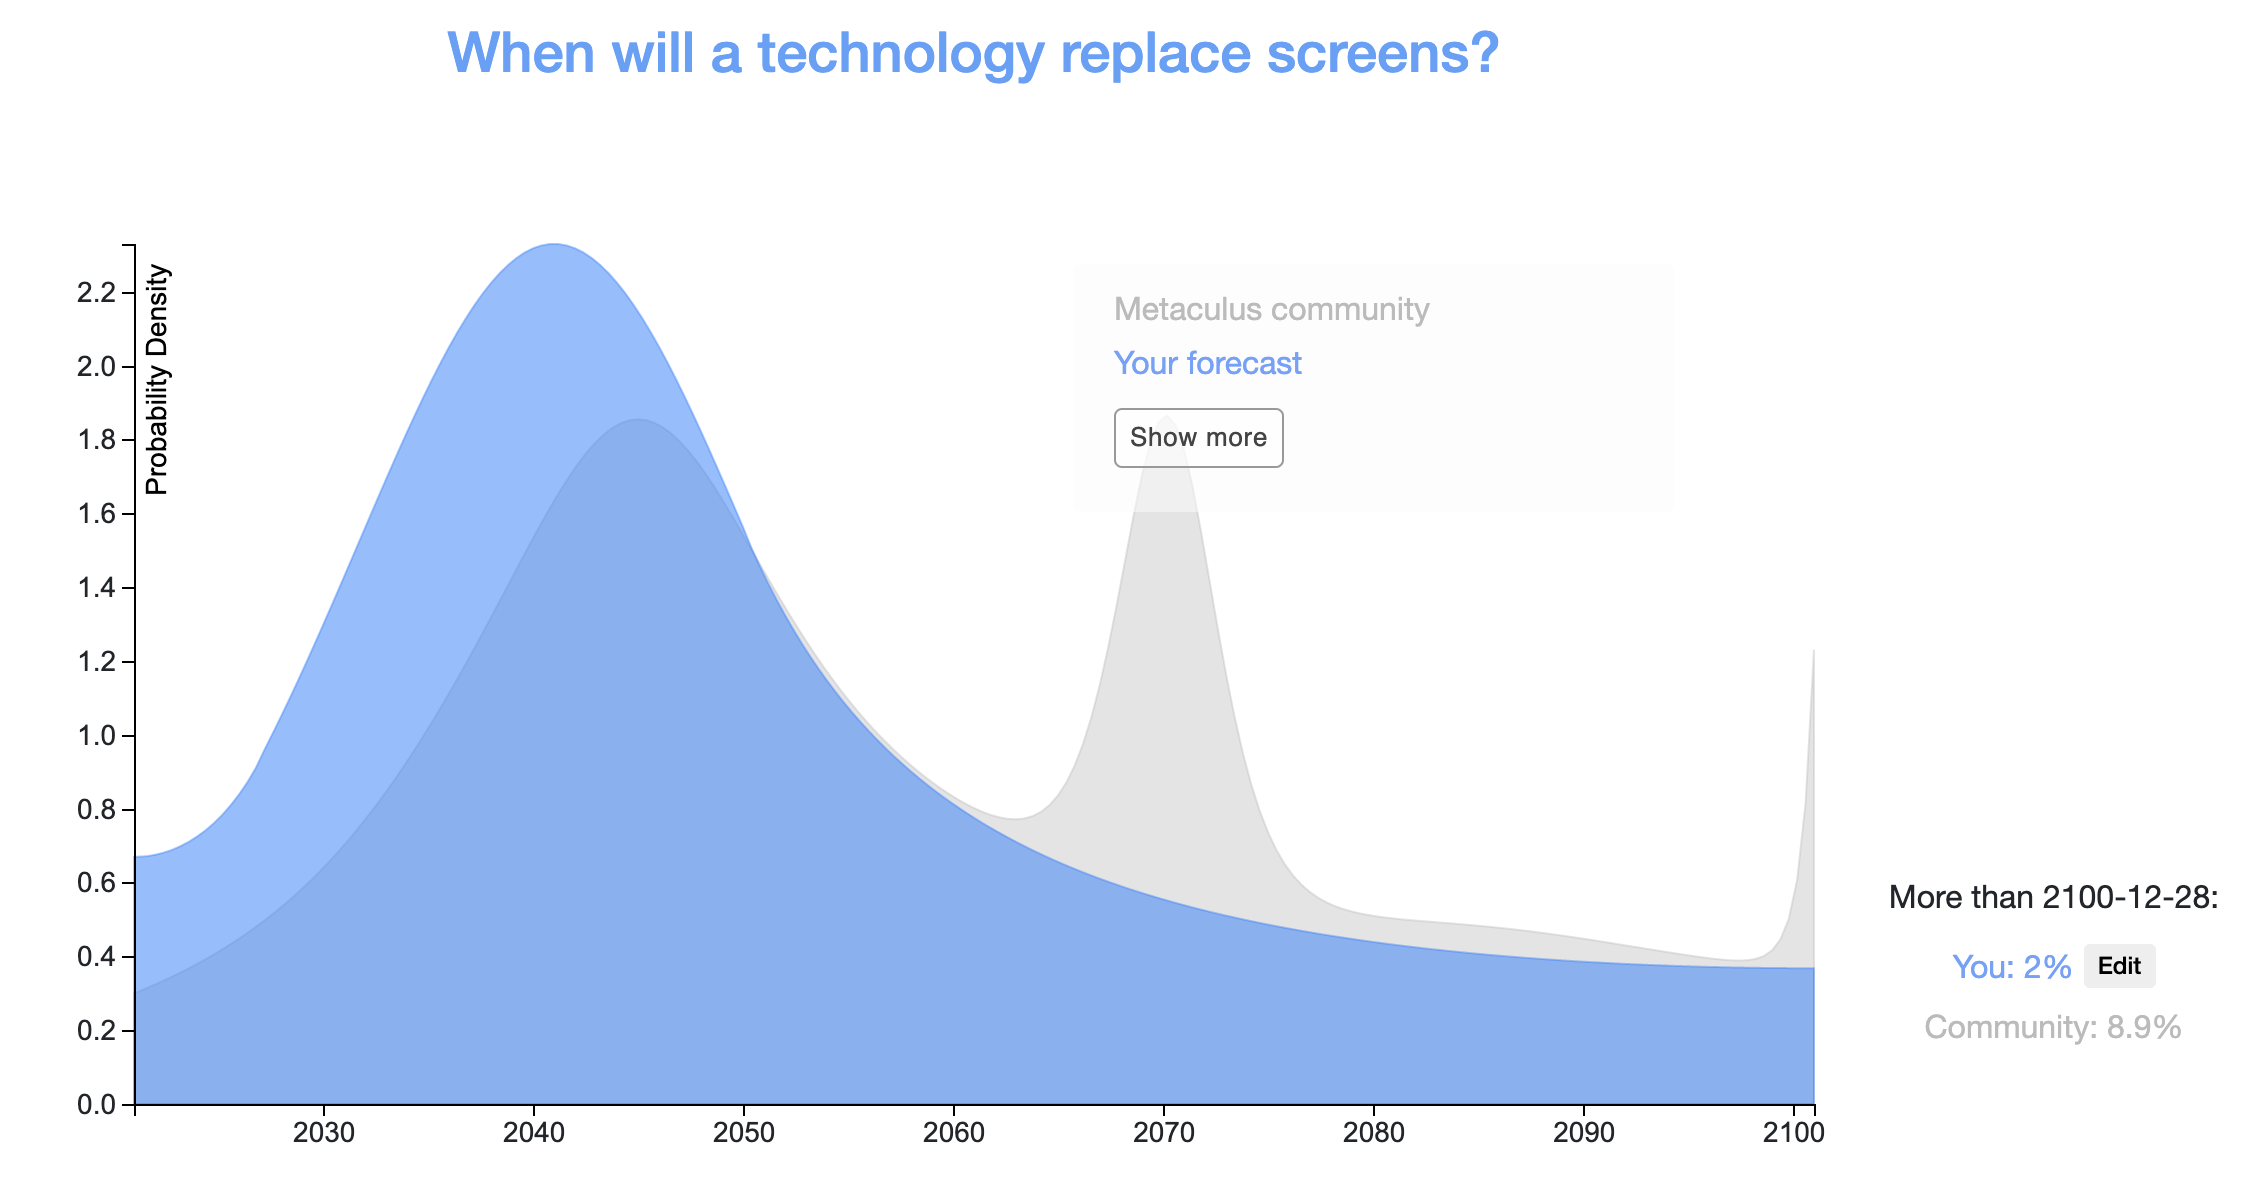
I don't feel super strongly about this, but think it'd be fun to bet on if anyone disagrees with me (here are the Metaculus resolution details):
When will a technology replace screens? (snapshot link here)
This is a really good point, thanks for bringing this up! We'll look into how to improve this.
Yeah this seems pretty reasonable. It's actually stark looking at the Our World in Data – that seems really high per year. Do you have your model somewhere? I'd be interested to see it.
A rough distribution (on a log scale) based on the two points you estimated for wars (95% < 1B people die in wars, 85% < 10M people die in wars) gives a median of ~2,600 people dying. Does that seem right?
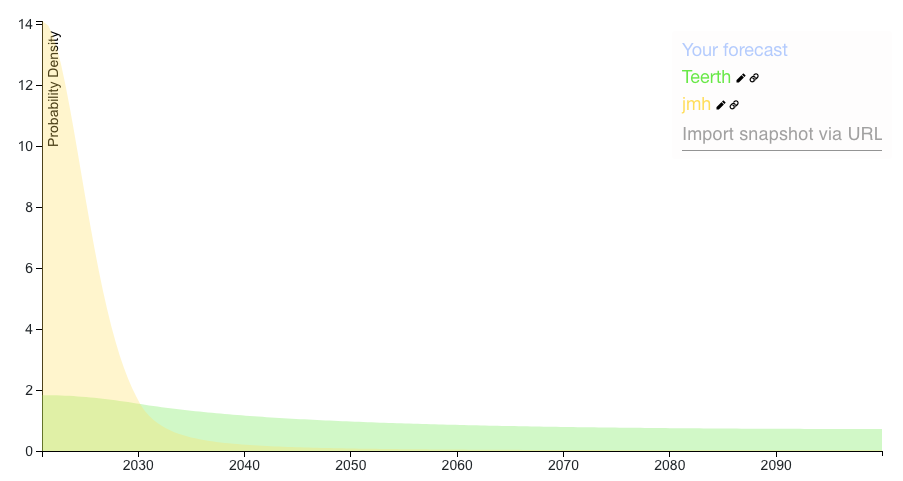
I noticed that your prediction and jmh's prediction are almost the exact opposite:
- Teerth: 80%: No human being would be living on another celestial object (Moon, another planet or asteroid) (by 2030)
- jmh: 90%: Humans living on the moon (by 2030)
(I plotted this here to show the difference, although this makes the assumption that you think the probability is ~uniformly distributed from 2030 – 2100). Curious why you think these differ so much? Especially jmh, since 90% by 2030 is more surprising - the Metaculus prediction for when the next human being will walk on the moon has a median of 2031.
Thank you for putting this spreadsheet database together! This seemed like a non-trivial amount of work, and it's pretty useful to have it all in one place. Seeing this spreadsheet made me want:
- More consistent questions such that all these people can make comparable predictions
- Ability to search and aggregate across these so we can see what the general consensus is on various questions
I thought the 2008 GCR questions were really interesting, and plotted the median estimates here. I was surprised by / interested in:
- How many more deaths were expected from wars than other disaster scenarios
- For superintelligent AI, most of the probability mass was < 1M deaths, but there was a high probability (5%) on extinction
- A natural pandemic was seen as more likely to cause > 1M deaths than an engineered pandemic (although less likely to cause > 1B deaths)
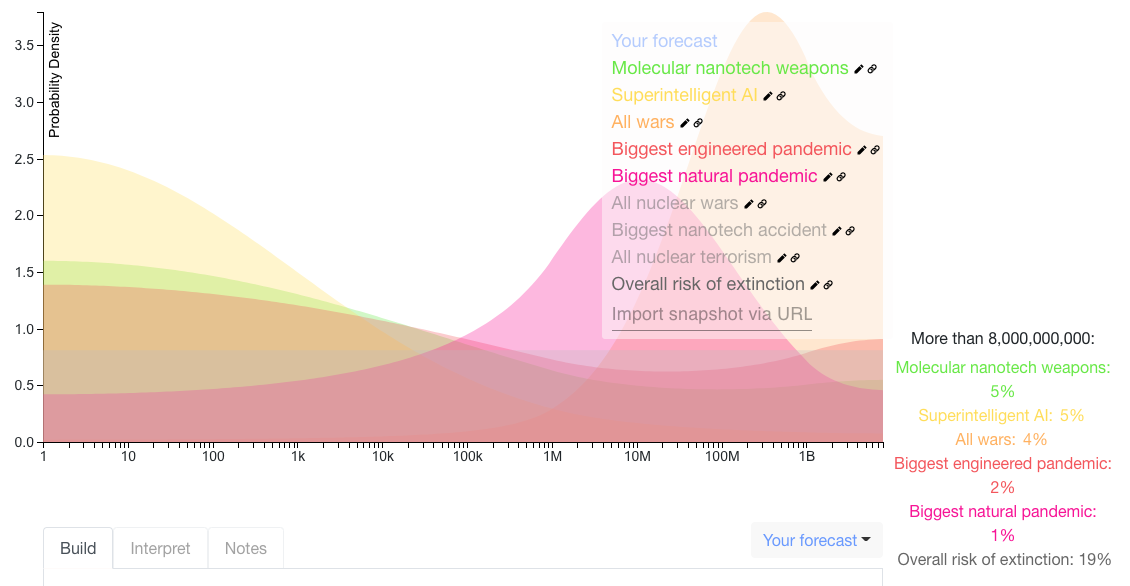
FYI, this is on a log scale. I plotted extinction as > 8B deaths.
(posted a similar comment on the EA forum link, since it seems like people are engaging more with this post there)
This is a really great conditional question! I'm curious what probability everyone puts on the assumption (GPT-N gets us to TAI) being true (i.e. do these predictions have a lot of weight in your overall TAI timelines)?
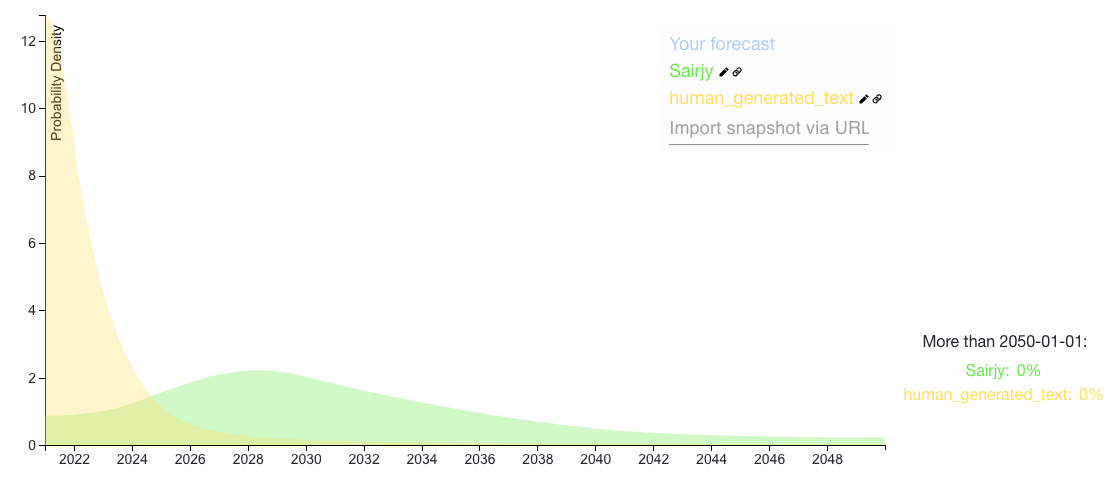
I plotted human_generated_text and sairjy's answers:
I also just discovered BERI's x-risk prediction market question set and Jacobjacob & bgold's AI forecasting database, which seem really helpful for this!
Here's a colab you can use to do this! I used it to make these aggregations:
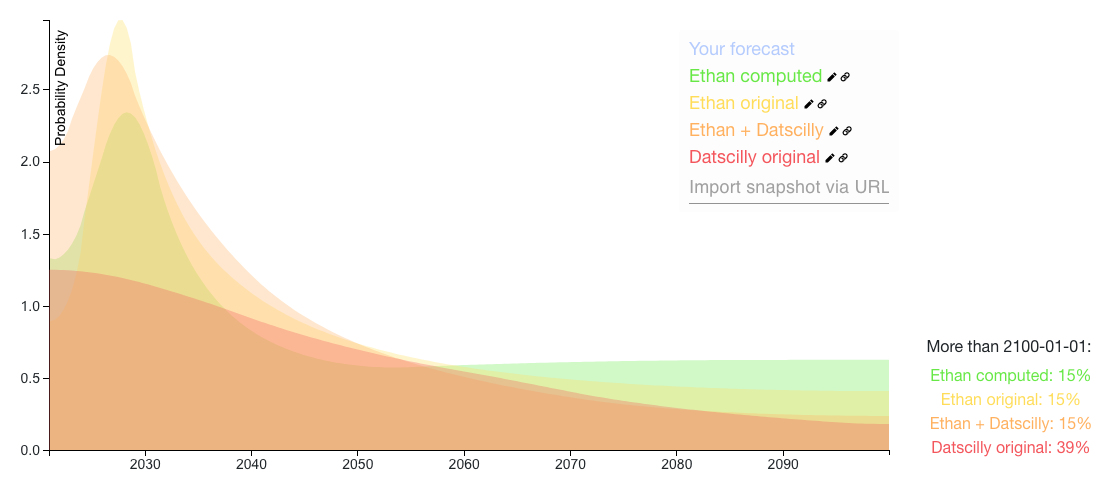
The Ethan + Datscilly distribution is a calculation of:
- 25% * Your inside view of prosaic AGI
- 60% * Datscilly's prediction (renormalized so that all the probability < 2100)
- 15% * We get AGI > 2100 or never
This has an earlier median (2040) than your original distribution (2046).
(Note for the colab: You can use this to run your own aggregations by plugging in Elicit snapshots of the distributions you want to aggregate. We're actively working on the Elicit API, so if the notebook breaks lmk so we can update it).
This links to a uniform distribution, guessing you didn't mean that! To link to your distribution, take a snapshot of your distribution, and then copy the snapshot url (which appears as a timestamp at the bottom of the page) and link that.
Daniel and SDM, what do you think of a bet with 78:22 odds (roughly 4:1) based on the differences in your distributions, i.e: If AGI happens before 2030, SDM owes Daniel $78. If AGI doesn't happen before 2030, Daniel owes SDM $22.
This was calculated by:
- Identifying the earliest possible date with substantial disagreement (in this case, 2030)
- Finding the probability each person assigns to the date range of now to 2030:
- Finding a fair bet
- According to this post, a bet based on the arithmetic mean of 2 differing probability estimates yields the same expected value for each participant. In this case, the mean is (5%+39%)/2=22% chance of AGI before 2030, equivalent to 22:78 odds.
- $78 and $22 can be scaled appropriately for whatever size bet you're comfortable with
The blue distribution labeled "Your distribution" in this snapshot is Alex's updated 2020 prediction.
I can help with this if you share the post with me!
Oh yeah that makes sense, I was slightly confused about the pod setup. The approach would've been different in that case (still would've estimated how many people in each pod were currently infected, but would've spent more time on the transmission rate for 30 feet outdoors). Curious what your current prediction for this is? (here is a blank distribution for the question if you want to use that)
Here’s my prediction for this! I predicted a median of March 1, 2029. Below are some of the data sources that informed my thinking.
- Base rates:
- iPhone: ~30% of US owns an iphone in 2020. This is ~10 years from when it was launched in 2007.
- Smartphones: Launched in 1992, 30% penetration in 2011 (19 years)
- Tablet: iPad launched in 2010, tablets reached 30% penetration in 2013 (3 years, not a perfect reference point because iPads are just a subset of tablets)
- How many people currently use AR/AR glasses?
- 6% of the US used a VR headset once a month in 2018
- 18% used AR in 2018
- I assume most of this is iphone apps, including Pokemon Go that had 60 million monthly active users in 2017
- 150,000 snapchat spectacles were sold in 2017
- When will major AR glasses products be released?
Related Metaculus question: When will sales of a non-screen technology be greater than sales of a screen technology?
Here's my prediction, and here's a spreadsheet with more details (I predicted expected # of people who would get COVID). Some caveats/assumptions:
- There's a lot of uncertainty in each of the variables that I didn't have time to research in-depth
- I didn't adjust for this being outdoors, you can add a row and adjust for that if you have a good sense of how it would affect it.
- I wasn't sure how to account for the time being 3 hours. My sense is that if you're singing loudly at people < 1m for 3 hours, this is going to be a pretty high infection rate. Also, I assumed they weren't wearing masks because of the singing. I'm most uncertain about this though
- You didn't mention how big the pods are. I assumed 10 people in a pod, but it would change it if this were much smaller.
Either expected number of people who get covid or number of microcovids generated by the event works as a question! My instinctive sense is that # of people who get covid will be easier to quickly reason about, but I'll see as I'm forecasting it.
In a similar vein to this, I found several resources that make me think it should be higher than 1% currently and in the next 1.5 years:
- This 2012/3 paper by Vincent Müller and Nick Bostrom surveyed AI experts, in particular, 72 people who attended AGI workshops (most of whom do technical work). Of these 72, 36% thought that assuming HLMI would at some point exist, it would be either ‘on balance bad’ or ‘extremely bad’ for humanity. Obviously this isn't an indication that they understand or agree with safety concerns, but directionally suggests people are concerned and thinking about this.
- This 2017 paper by Seth Baum identified 45 projects on AGI and their stance on safety (page 25). Of these, 12 were active on safety (dedicated efforts to address AGI safety issues), 3 were moderate (acknowledge safety issues, but don’t have dedicated efforts to address them), and 2 were dismissive (argue that AGI safety concerns are incorrect). The remaining 28 did not specify their stance.
If people don't have a strong sense of who these people are/would be, you can look through this google scholar citation list (this is just the top AI researchers, not AGI researchers).
We're ok with people posting multiple snapshots, if you want to update it based on later comments! You can edit your comment with a new snapshot link, or add a new comment with the latest snapshot (we'll consider the latest one, or whichever one you identify as your final submission)
Would the latter distribution you described look something like this?