Unknown Knowns
post by Zvi · 2018-08-28T13:20:00.982Z · LW · GW · 17 commentsContents
  Fig. 4: Prediction market and survey beliefs.
None
17 comments
Previously (Marginal Revolution): Gambling Can Save Science
A study was done to attempt to replicate 21 studies published in Science and Nature.
Beforehand, prediction markets were used to see which studies would be predicted to replicate with what probability. The results were as follows (from the original paper):
Fig. 4: Prediction market and survey beliefs.
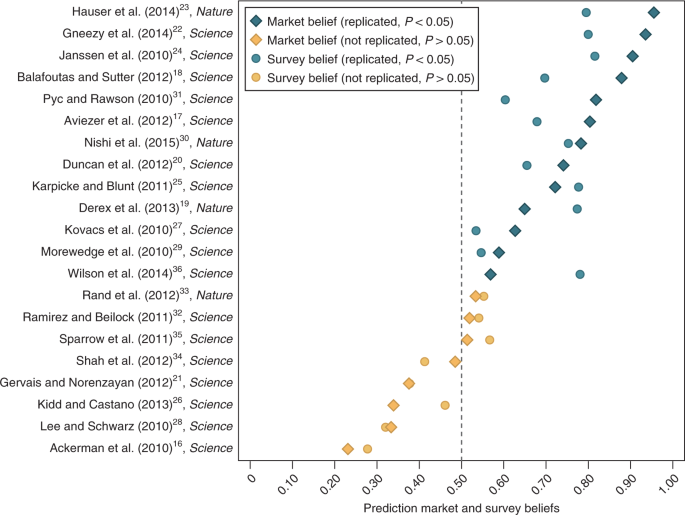
The prediction market beliefs and the survey beliefs of replicating (from treatment 2 for measuring beliefs; see the Supplementary Methods for details and Supplementary Fig. 6 for the results from treatment 1) are shown. The replication studies are ranked in terms of prediction market beliefs on the y axis, with replication studies more likely to replicate than not to the right of the dashed line. The mean prediction market belief of replication is 63.4% (range: 23.1–95.5%, 95% CI = 53.7–73.0%) and the mean survey belief is 60.6% (range: 27.8–81.5%, 95% CI = 53.0–68.2%). This is similar to the actual replication rate of 61.9%. The prediction market beliefs and survey beliefs are highly correlated, but imprecisely estimated (Spearman correlation coefficient: 0.845, 95% CI = 0.652–0.936, P < 0.001, n = 21). Both the prediction market beliefs (Spearman correlation coefficient: 0.842, 95% CI = 0.645–0.934, P < 0.001, n = 21) and the survey beliefs (Spearman correlation coefficient: 0.761, 95% CI = 0.491–0.898, P < 0.001, n = 21) are also highly correlated with a successful replication.
That is not only a super impressive result. That result is suspiciously amazingly great.
The mean prediction market belief of replication is 63.4%, the survey mean was 60.6% and the final result was 61.9%. That’s impressive all around.
What’s far more striking is that they knew exactly which studies would replicate. Every study that would replicate traded at a higher probability of success than every study that would fail to replicate.
Combining that with an almost exactly correct mean success rate, we have a stunning display of knowledge and of under-confidence.
Then we combine that with this fact from the paper:
Second, among the unsuccessful replications, there was essentially no evidence for the original finding. The average relative effect size was very close to zero for the eight findings that failed to replicate according to the statistical significance criterion.
That means there was a clean cut. Thirteen of the studies successfully replicated. Eight of them not only didn’t replicate, but showed very close to no effect.
Now combine these facts: The rate of replication was estimated correctly. The studies were exactly correctly sorted by whether they would replicate. None of the studies that failed to replicate came close to replicating, so there was a ‘clean cut’ in the underlying scientific reality. Some of the studies found real results. All others were either fraud, p-hacking or the light p-hacking of a bad hypothesis and small sample size. No in between.
The implementation of the prediction market used a market maker who began anchored to a 50% probability of replication. This, and the fact that participants had limited tokens with which to trade (and thus, had to prioritize which probabilities to move) explains some of the under-confidence in the individual results. The rest seems to be legitimate under-confidence.
What we have here is an example of that elusive object, the unknown known: Things we don’t know that we know. This completes Rumsfeld’s 2×2. We pretend that we don’t have enough information to know which studies represent real results and which ones don’t. We are modest. We don’t fully update on information that doesn’t conform properly to the formal rules of inference, or the norms of scientific debate. We don’t dare make the claim that we know, even to ourselves.
And yet, we know.
What else do we know?
17 comments
Comments sorted by top scores.
comment by Bucky · 2019-12-11T23:48:27.954Z · LW(p) · GW(p)
Tldr; I don’t think that this post stands up to close scrutiny although there may be unknown knowns anyway. This is partly due to a couple of things in the original paper which I think are a bit misleading for the purposes of analysing the markets.
The unknown knowns claim is based on 3 patterns in the data:
“The mean prediction market belief of replication is 63.4%, the survey mean was 60.6% and the final result was 61.9%. That’s impressive all around.”
“Every study that would replicate traded at a higher probability of success than every study that would fail to replicate.”
“None of the studies that failed to replicate came close to replicating, so there was a ‘clean cut’ in the underlying scientific reality.”
Taking these in reverse order:
Clean cut in results
I don’t think that there is as clear a distinction between successful and unsuccessful replications as stated in the OP:
"None of the studies that failed to replicate came close to replicating"
This assertion is based on a statement in the paper:
“Second, among the unsuccessful replications, there was essentially no evidence for the original finding. The average relative effect size was very close to zero for the eight findings that failed to replicate according to the statistical significance criterion.”
However this doesn’t necessarily support the claim of a dichotomy – the average being close to 0 doesn’t imply that all the results were close to 0, nor that every successful replication passed cleanly. If you ignore the colours, this graph from the paper suggests that the normalised effect sizes are more of a continuum than a clean cut (central section b is relevant chart).
Eyeballing that graph, there is 1 failed replication which nearly succeeded and 4 successful which could have failed. If the effect size shifted by less than 1 S.D. (some of them less than 0.5 S.D.) then the success would have become a failure or vice-versa (although some might have then passed at stage 2). [1]
Monotonic market belief vs replication success
Of the 5 replications noted above, the 1 which nearly passed was ranked last by market belief, the 4 which nearly failed were ranked 3, 4, 5 and 7. If any of these had gone the other way it would have ruined the beautiful monotonic result.
According to the planned procedure [1], the 1 study which nearly passed replication should have been counted as a pass as it successfully replicated in stage 1 and should not have proceeded to stage 2 where the significance disappeared. I think it is right to count this as an overall failed replication but for the sake of analysing the market it should be listed as a success.
Having said that, the pattern is still a very impressive result which I look into below.
Mean market belief
The OP notes that there is a good match between the mean market belief of replication and the actual fraction of successful replications. To me this doesn’t really suggest much by way of whether the participants in the market were under-confident or not. If they were to suddenly become more confident then the mean market belief could easily move away from the result.
If the market is under-confident, it seems like one could buy options in all the markets trading above 0.5 and sell options in all the ones below and expect to make a profit. If I did this then I would buy options in 16/21 (76%) of markets and would actually increase the mean market belief away from the actual percentage of successful replications. By this metric becoming more confident would lower accuracy.
In a similar vein, I also don’t think Spearman coefficients can tell us much about over/under-confidence. Spearman coefficients are based on rank order so if every option on the market became less/more confident by the same amount, the Spearman coefficients wouldn’t change.
Are there unknown knowns anyway?
Notwithstanding the above, the graph in the OP still looks to me as though the market is under-confident. If I were to buy an option in every study with market belief >0.5 and sell in every study <0.5 I would still make a decent profit when the market resolved. However it is not clear whether this is a consistent pattern across similar markets.
Fortunately the paper also includes data on 2 other markets (success in stage 1 of the replication based on 2 different sets of participants) so it is possible to check whether these markets were similarly under-confident. [2]
If I performed the same action of buying and selling depending on market belief I would make a very small gain in one market and a small loss in the other. This does not suggest that there is a consistent pattern of under-confidence.
It is possible to check for calibration across the markets. I split the 63 market predictions (3 markets x 21 studies) into 4 groups depending on the level of market belief, 50-60%, 60-70%, 70-80% and 80-100% (any market beliefs with p<50% are converted to 1-p for grouping).
For beliefs of 50-60% confidence, the market was correct 29% of the time. Across the 3 markets this varied from 0-50% correct.
For beliefs of 60-70% confidence, the market was correct 93% of the time. Across the 3 markets this varied from 75-100% correct.
For beliefs of 70-80% confidence, the market was correct 78% of the time. Across the 3 markets this varied from 75-83% correct.
For beliefs of 80-100% confidence, the market was correct 89% of the time. Across the 3 markets this varied from 75-100% correct.
We could make a claim that anything which the markets show in the 50-60% range are genuinely uncertain but that for everything above 60% we should just adjust all probabilities to at least 75%, maybe something like 80-85% chance.
If I perform the same buying/selling that I discussed previously but set my limit to 0.6 instead of 0.5 (i.e. don’t buy or sell in the range 40%-60%) then I would make a tidy profit in all 3 markets.
But I’m not sure whether I’m completely persuaded. Essentially there is only one range which differs significantly from the market being well calibrated (p=0.024, two-tailed binomial). If I adjust for multiple hypothesis testing this is no longer significant. There is some Bayesian evidence here but not enough to completely persuade me.
Summary
I don’t think the paper in question provides sufficient evidence to conclude that there are unknown knowns in predicting study replication. It is good to know that we are fairly good at predicting which results will replicate but I think the question of how well calibrated we are remains an open topic.
Hopefully the replication markets study will give more insights into this.
***
[1] The replication was performed in 2 stages. The first was intended to have a 95% change of finding an effect size of 75% of the original finding. If the study replicated here it was to stop and ticked off as a successful replication. Those that didn’t replicate in stage 1 proceeded to stage 2 where the sample size was increased in order to have a 95% change of finding effect sizes at 50% of the original finding.
[2] Fig 7 in the supplementary information shows the same graph as in the OP but basing on Treatment 1 market beliefs which relate to stage 1 predictions. This still looks quite impressively monotonic. However the colouring system is misleading for analysing market success as the colouring system related to success after stage 2 of the replication but the market was predicting stage 1. If this is corrected then the graph look a lot less monotonic, flipping the results for Pyc & Rawson (6th), Duncan et al. (8th) and Ackerman et al. (19th).
Replies from: Benito↑ comment by Ben Pace (Benito) · 2019-12-12T00:07:26.256Z · LW(p) · GW(p)
This is awesome :) Thank you very much for reading through it all and writing down your thoughts and conclusions.
comment by Benquo · 2018-09-02T02:52:24.152Z · LW(p) · GW(p)
80,000 Hours now has a quiz up where you can test your own ability to guess which studies replicated: https://www.lesswrong.com/posts/KsyD6GmFN2EtirX74/psychology-replication-quiz [LW · GW]
comment by Richard_Ngo (ricraz) · 2018-08-28T13:34:31.176Z · LW(p) · GW(p)
That result is suspiciously amazingly great.
After this sentence, I thought you were going in an entirely different direction. I am also somewhat suspicious. How trustworthy is the replication paper?
Replies from: Bucky↑ comment by Bucky · 2018-09-12T08:36:00.483Z · LW(p) · GW(p)
Looking at the comments on the quiz link post [LW · GW], the average was 34.8/42. Using the same scoring system the prediction market would have got 36/42 (3 didn't replicate which the market gave >50% credence to). If competent laypeople (some of whom by their own admission didn't spend long on the task) can get 34.8, 36 doesn't seem unreasonable.
I think the paper looks especially impressive due to the ability to give probability estimates but having done the quiz the ones I got wrong were amongst those which I felt least confident about.
comment by Ben Pace (Benito) · 2018-09-05T21:43:11.897Z · LW(p) · GW(p)
I curated this post; I really appreciated having the post's framing. It made the study's implications for the old debate on modesty really clear and crisp, and I doubt I'd've framed it as clearly in my own head had I found out about the study a different way.
comment by jmh · 2018-08-29T17:24:24.464Z · LW(p) · GW(p)
Like ricraz I was initially expecting a different post but like was was done.
However we still have the underlying problem that the replication test performed does not seem to do what it claims. https://www.sciencenews.org/blog/context/debates-whether-science-broken-dont-fit-tweets has some interesting comments I think. If I understood correctly the conclusion that a later test produced a different p-value says nothing about the underlying hypothesis -- in other words the hypothesis is not tested, only the data. So unless this is all about running the same data sets....but that suggest other problems.
comment by Ben Pace (Benito) · 2019-11-28T07:49:22.955Z · LW(p) · GW(p)
This is a very interesting post that seems to be a clean example of a really important problem. If it's true, I expect it will be an important building block in my model of the world.
However, I feel confused about it. For example, the participants had limited tokens and the ignorance prior was set before they traded, which appears to have induced underconfidence by default, and it's not clear to me whether this entire effect is explained by that. Also the blue diamonds aren't actually a great predictor of the blue circles and I don't know why that would happen.
So I'm nominating this for review. If people review it in detail and find it's valid, then I think it's very important, but they might not, and that's also valuable work.
Replies from: Raemon↑ comment by Raemon · 2019-11-28T21:39:06.059Z · LW(p) · GW(p)
I.... had totally forgotten what the actual content of this post was (I looked at it while pondering things to nominate, vaguely remember some anecdote that led up to 'and therefore, unknown knowns' exist, and thinking 'well, it might be important that unknown knowns exist, but I haven't used that in the past year so probably shouldn't nominate it.)
But, yeah, the meat of this post seems incredibly important-if-true.
comment by orthonormal · 2019-12-07T22:26:16.706Z · LW(p) · GW(p)
I think this explanation is mostly true, but the participants may have been more confident of the relative degree of fishiness than the absolute degree. A single unknown variable affecting all of the studies (in this case, the degree of truly invisible fudging in the field) ought to regress each individual probability away from extremes somewhat.
comment by johnswentworth · 2019-11-28T17:15:52.708Z · LW(p) · GW(p)
Second Bena's nomination
comment by Adam Zerner (adamzerner) · 2018-08-31T04:25:42.909Z · LW(p) · GW(p)
Any example that comes to mind is with poker. Say you just sit down at the table and a kid with a backwards baseball cap and sunglasses makes an aggressive move. A lot of people will fold with the rationale:
I have a feeling he's bluffing, but I just sat down so I don't know. I have to see him prove that he's capable before I give him credit.
Similar example: take the same situation and replace the kid with a twenty-something year old asian. Twenty-something year old asians tend to be aggressive. People know that, but often still won't give the player credit for being capable of bluffing because they "don't want to stereotype".
Replies from: pktechgirl, sara-34↑ comment by Elizabeth (pktechgirl) · 2018-09-08T16:24:20.403Z · LW(p) · GW(p)
Given that the stereotypes are known to all players and can be manipulated (moreso the baseball cap than race), refusing to believe the signals seems like the correct thing at high level tables where all players can be assumed to have thought through their presentation. Even with something like race, if the 20 year old asian knows you think he's likely to be aggressive, he can use that to his advantage.
Replies from: adamzerner↑ comment by Adam Zerner (adamzerner) · 2018-09-08T18:23:28.077Z · LW(p) · GW(p)
I would probably have thought the same thing if I didn't play poker, but my impression from playing poker is that players just aren't that sophisticated (in this manner) at anything but the highest of stakes.
↑ comment by sara-34 · 2018-10-08T21:17:05.581Z · LW(p) · GW(p)
I think a little more goes into it with poker, at least with Texas Hold'em. The odds change every time a new card is laid down. The player who goes all-in before the flop might actually have a pair of Aces, but another player could still win with a flush once all the cards are down.
I'm not sure what your underlying point here is - I might not be disagreeing with you. One lesson I take from poker is that there is little cost to folding when the stakes are high, but a very large cost to betting and being wrong. It is safer to sit and watch for a while and wait for a hand you have great confidence in before challenging the "all-in" player.
Similarly, there seems to be greater social down-sides to believing something that turns out to be false than to be skeptical of something that turns out to be true.
Replies from: adamzerner↑ comment by Adam Zerner (adamzerner) · 2018-10-10T00:14:33.176Z · LW(p) · GW(p)
The central point I'm making is that people often know that the kid with a backwards baseball cap and sunglasses is likely to be bluffing, even though they don't know that they know it, and thus it's an example of an unknown known.
It is true that the cards change every hand, and so the kid may not be bluffing, but the probabilities don't change (for a given context), so the kid is just as likely to be bluffing each time (for a given context). Eg. on a 964 flop, if the kid is the preflop raiser, he could have AA, but on that flop he's likely to be bluffing, say, 80% of the time.