Factors of mental and physical abilities - a statistical analysis
post by dynomight · 2021-08-17T20:42:28.310Z · LW · GW · 25 commentsThis is a link post for https://dynomight.net/general-intelligence/
Contents
  Physical tests are correlated
  Mental tests are correlated
  What do we see?
  Factor analysis is like a cigar
    Simulations
  The meaning of cigars
  Mental tests aren't not cigars
  Directions of variation
  What would g look like?
  Takeaways
None
25 comments
(Cross-posted with various interactive elements (videos, expandy/contracty boxes) that required slightly awkward substitutes here.)
Is there a general factor of intelligence?
This question is a trap. If you try to answer it, you’ll find yourself beset by semantic questions. What’s intelligence? What’s a factor? And if you get past those, you’ll then find a bleak valley of statistical arcana. What do the eigenvalues look like? Do they imply causality?
This is all backward. If your goal is to understand the external world, you can skip the hand wringing and start by looking at the damn data. So let’s do that.
Physical tests are correlated
To start, let’s forget about intelligence, and ask an easier question: Does it make sense to refer to some people as “more physically fit” than others? Is that reasonable, or do we need to break things down by strength, speed, coordination, etc.?
To answer this, I looked for studies that gave people batteries of different physical tests. I found three that make enough information available to analyze.
| Paper | Population |
|---|---|
| Baumgartner and Zuidema, 1972 | 283 male and 336 female college students in Michigan |
| Marsh and Redmaye, 1994 | 105 students at two private girls' schools in Sydney |
| Ibrahim et al., 2011 | 330 Malaysian students aged 12-15 |
Here are the correlations among the different tests in the first study. The columns are the same as the rows---so the 3rd square in the first row is the correlation between hand grip and pull-ups.

This is males. (Females are similar, except with lower correlations in upper-body strength.)
Here are links for Marsh and Redmaye and Ibrahim et al..
Most tests are positively correlated, and none are negative. Is this surprising? I don't know. For our purposes, we just want this as a point of comparison.
Mental tests are correlated
We can do the same analysis with batteries of mental tests. For whatever reason, many more studies have been done with mental tests, so I picked four of the best studies.
| Paper | Population |
|---|---|
| Alderton et al. 1997 | 12,813 members of the US Navy, Army, and Air Forces |
| Deary, 2000 | 365 representative Scottish people |
| Chabris 2011 | 111 Boston adults 18 - 60 years old |
| MacCann et al., 2014 | 688 students from colleges around the US. |
Here are the correlations in the first study.

This test battery is designed to measure aptitude for various military tasks. Some of these, like tracking and target identification, are partly physical.
Here are links for Deary and Chabris and MacCann et al..
What do we see?
The same basic pattern holds for both physical and mental tests.
First, almost everything is positively correlated. You might imagine that people with more upper-body strength would be worse runners---what with the extra muscle they need to carry around. You might imagine that people who are good at paragraph comprehension would be worse at math. But that's not what happens.
Second, more similar stuff is more correlated. It's natural that chin-ups are strongly correlated with pull-ups, or that arithmetic reasoning is strongly correlated with mathematics knowledge. It's more surprising that hand-grip strength is correlated with the 75-yd dash or that paragraph comprehension is correlated with target identification. These more surprising correlations are weaker (but still positive).
Third, the results are robust. The tests span several decades, different countries, and many different test batteries. The basic pattern doesn't change.
Things are correlated. No one seems to seriously dispute this. So why all the debates?
For one thing, the discussion sometimes ascends into meta-controversy. There are many arguments to be had about the definition of "general intelligence". Some people even debate if there is anything controversial! (I take no position here, but note that the "not surprising" camp doesn't seem to agree on why it's not surprising...)
On the lower planes of argument, the main issue is if the tests are just correlated or if there's something deeper going on underneath of them. Here, the burden of proof falls on whoever claims there is something deeper.
Aside: The mental correlations are somewhat stronger than the physical ones, but don't take that too seriously. The mental tests used more diverse populations than the physical tests. Imagine doing physical tests on a group of 20-year-olds. If you throw in a bunch of 80-year-olds, they'll be worse at everything and correlations will shoot up.
Factor analysis is like a cigar
The typical argument that there's something deeper happening relies on a statistical technique called factor analysis. This is usually described with fancy technical language, but the basic idea is just that you can summarize all the tests for each person using a single number.
Let's make this concrete. Say you go out and grab random people and test them, and get this data:
| Person | Test 1 | Test 2 | Test 3 |
|---|---|---|---|
| Antonio | 1 | -1 | 1.5 |
| Bart | .67 | -.67 | 1 |
| Cathy | -0.5 | 0.5 | -0.75 |
| Dara | -2 | 2 | -3 |
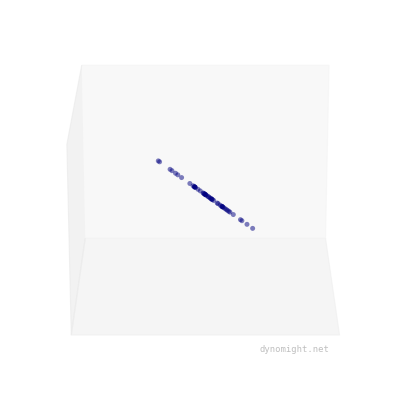
You can visualize the data as a magical rotating point-cloud:

Now, notice something important: This data is special, in that the points fall along a straight line. This means that even though each person took 3 tests, you can represent each person using a single number, namely their position on the line. If you tested lots of people, and the data looked like this, then each person's position along the line would be the "general factor".
Of course, real data would never exactly look like this. It would have noise! To reflect that, we need to build a "model". That is, we will try to build a "simulator" that can make fake data that (hopefully) looks like real data.
Simulations
The simplest simulator would be to just generate people along a line. First, pick some direction of variation. Then, to simulate a person (i.e. a set of test scores), draw a random number g from a standard "bell curve" Normal distribution to represent their position along the main direction.
Here's an example, where we choose a direction of variation similar to the dataset above. If you simulate a bunch of people, you'll get a dataset that looks like this:
Of course, real data will never look like that---there will always be "noise", either from measurement error, or from certain people randomly being good/bad at certain tasks. To account for this, let's update our simulator, by adding some random noise to each point. This produces data that looks like a cigar.
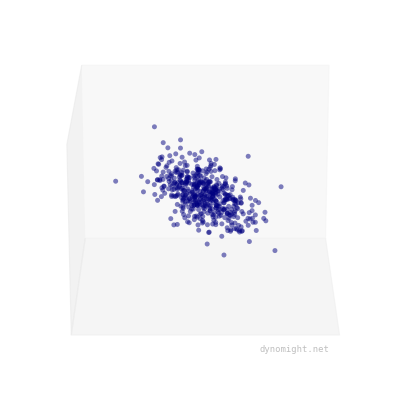
The critical thing here is that cigars are rotationally symmetric. If you "roll" the point cloud along the main axis of variation, it still looks basically the same.
Now we can finally say what factor analysis is. It's an algorithm that takes a real dataset and adjusts the shape of the cigar so that the simulated data will look as much like the real data as possible. It can modify the direction of variation, and how "thick" the cigar is, but that's it. (Note: all this describes the simplest possible variant of factor analysis, which is all we need here.)
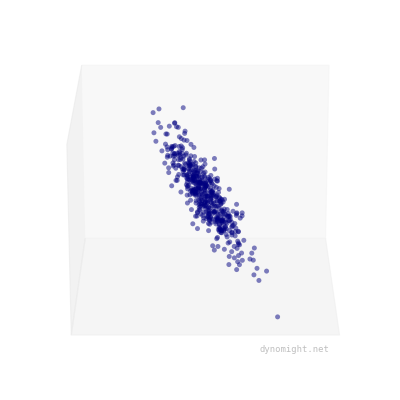
If your dataset looks like a cigar, factor analysis will fit well. If not, it will fit poorly. Here's an example of the kind of data factor analysis can't represent:
The meaning of cigars
Factor analysis tries to approximate your data with a cigar. Why should you care about this?
Let's back up. As we saw earlier, physical and mental tests are correlated. If you learn that Bob scored well on paragraph comprehension that raises your estimate for how Bob will do on coding speed.
But say your data was a cigar. Take Bob's position along the length of the cigar, and call it g. Say Bob's value for g is low. If that's all you know, and you had to guess Bob's coding speed, you'd give a low number.
Now, suppose that in addition to g, you learn that Bob did well on paragraph comprehension. How does this change your estimate of Bob's coding speed? Amazingly, it doesn't. The single number g contains all the shared information between the tests.
In a cigar distribution, once you know g, everything else is just random noise---one test no longer tells you anything about any other. (Mathematically, once you control for g, the partial correlations of the tests are zero.)
In a non-cigar distribution, this doesn't happen. There's no single number that will make all the tests uncorrelated. Some interesting structure would remain unexplained.
Mental tests aren't not cigars
So, what does real data look like? Is it a cigar? Can we capture all the structure with a single number?
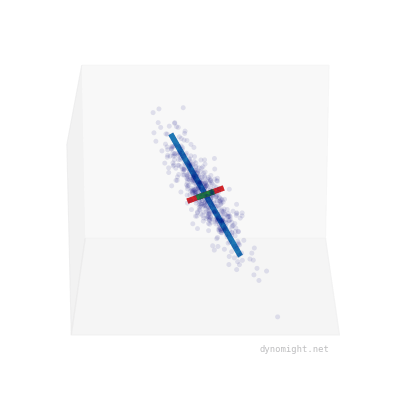
Here I took the earlier cigar data, and manually drew three lines to capture the "shape" of the data:
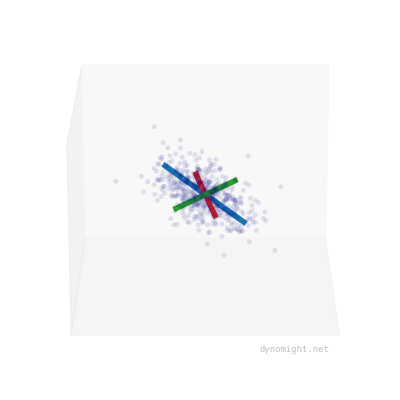
The blue line corresponds to the main direction of variation, while the shorter red and green lines correspond to the random noise added to each point. You can see that the shorter lines are the same length. This happens because factor analysis models are rotationally symmetric.
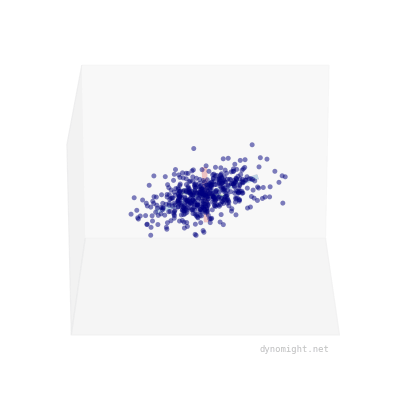
In contrast, here's the earlier "non-cigar" data:
Here, the shorter green and red lines are different lengths, reflecting that there is no rotational symmetry.
OK, I lied. I didn't draw the lines manually. There's a simple algorithm that can automatically compute these for any dataset. (By computing a singular value decomposition of the covariance matrix, if those words mean anything to you.) The details don't particularly matter, just that we can automatically find lines that span a point cloud. This will be important when we move beyond three dimensions.
So now we have a plan: We will take a real dataset, compute these lines, and see how long they are. If we have one long line and a bunch of equal-length short lines, then the data is cigar-like, meaning that a single variable explains all the "interesting" latent structure. If we have a bunch of lines of random lengths, then the data isn't cigar-like, meaning that we can't summarize things with one number.
I'd like to show you the real data from the datasets above, but none of them seem to be publicly available. Still, we can approximate it by generating data from a multivariate Normal with the known covariance.
Here are the first three tests of Alderton et al.'s (Paragraph comprehension, work knowledge, and general science).
It's not a perfect cigar, but it's not exactly not a cigar either. Here are the relative lengths of the three directions in decreasing order:
1st direction (blue line):   0.890
2nd direction (red line):    0.362
3rd direction (green line):  0.279
What if we use all seven tests? We can't make pretty pictures in seven dimensions, but we can still do the math. With N tests, a factor analysis model always produces 1 "long" direction and N-1 "short" directions. If we plot the length of the directions, it should look like this:

In contrast, here's how things would look if all the tests were completely uncorrelated.

What do the lengths on real data look like? Well, judge for yourself. Here's Alderton et al.:

And here are Deary and Chabris and MacCann et al..
Do these look exactly like what factor analysis can produce? No. But it's a reasonable approximation.
Directions of variation
Here's another way of visualizing things. For any dataset, we can take the principal direction of variation (the blue line) and look at its length along each of the tests. This says, essentially, how much each of the tests contributes to the main direction of variation. Here's what we get if we do that for Alderton et al.:

Calculating g is similar to taking a simple average of the test scores, though the weights are slightly higher on some tasks than others.
If we calculate g like this for each person, we can then compute the partial correlations. These are the correlations once you control for g. Here's what that gives for Alderton et al.:

Mostly it's a sea of gray, indicating that the partial correlations are all quite small. The other studies look broadly similar.
If factor analysis was a perfect fit, these would all be zero, which they aren't. But they are pretty small, meaning that in each case, the single number g captures most of the interesting correlations.
What would g look like?
Factor analysis is a decent but not perfect model of mental tests. What does this tell us about how intelligence works? Well, suppose that factor analysis was a perfect model. Would that mean that we're all born with some single number g that determines how good we are at thinking?
No. A perfect fit would only mean that, across a population, a single number would describe how people do on tests (except for the "noise"). It does not mean that number causes test performance to be correlated.
This is a point that often comes up in "refutations" of the existence of g. People argue, essentially, that even though tests are correlated, they might be produced by many independent causes. I'd go further---we know there are many causes. While intelligence is strongly heritable, it's highly polygenic. Dozens of genes are already known to be linked to it, and more are likely to be discovered. How "broad" the effects of individual genes are is an active research topic. It's harder to quantify environmental influences, but there are surely many that matter there, too.
So, no, the above data doesn't imply that there's no magical number g hidden in our brains, just like it doesn't imply that there's single number in our bodies that says how good we are at running, balancing, or throwing stuff. But that doesn't change the fact that a single number provides a good description of how good we are at various mental tasks.
Suppose you're hiring someone for a job that requires a few different mental tasks. (Arithmetic, sequential memory, whatever.) If you knew someone's g, you could guess how well they'd do at each task. But it would only be a guess! To really know, you still need to test the skills individually. That's the key word: Individually. It's not that g tells you everything---it doesn't---it's just that once you know g, how good someone is at one task doesn't tell you anything about how good they'll be at another.
Again, that's assuming factor analysis were a perfect fit. Which it isn't. Though it's close.
Takeaways
- Skill at mental and physical tasks are positively correlated. More similar stuff is more correlated.
- A factor analysis model tries to model data with a "cigar" shape. These models fit mental and physical tests reasonably well, but not perfectly.
- Call the position along the "long axis" of the cigar g. A perfect fit wouldn't mean that g contains all the information about how good someone is at different tasks---only that it contains all shared information.
(Thanks to Aaron Bergman for comments on a draft of this essay.)
25 comments
Comments sorted by top scores.
comment by Radford Neal · 2021-08-17T23:28:28.242Z · LW(p) · GW(p)
You say: "Note: all this describes the simplest possible variant of factor analysis, which is all we need here."
Unfortunately, I think using this simplest variant makes some of your later statements misleading. In particular, the way you phrase "is there a general factor?" as being equivalent to "is the data cigar-shaped?" is correct only if the amount of noise in each measurement is the same. But there is no reason for the measurement of one quantity to have the same amount of noise as the measurement of some different quantity. Once one admits this, one needs to use a real factor analysis procedure (eg, maximum likelihood estimation), which won't be equivalent to singular-value decomposition, and which won't be as visually simple as looking for a cigar shape.
Replies from: dynomight↑ comment by dynomight · 2021-08-18T00:40:13.562Z · LW(p) · GW(p)
Thanks for the reply. I certainly agree that "factor analysis" often doesn't make that assumption, though it was my impression that it's commonly made in this context. I suppose the degree of misleading-ness here depends on how often people assume isotropic noise when looking at this kind of data?
In any case, I'll try to think about how to clarify this without getting too technical. (I actually had some more details about this at one point but was persuaded to remove them for the sake of being more accessible.)
Replies from: Radford Neal↑ comment by Radford Neal · 2021-08-18T00:50:46.222Z · LW(p) · GW(p)
I'm not sure how often people assume equal noise in all measurements, but I suspect it's more often than they should - there must be a temptation to do so in order that simple methods like SVD can be used (just like Bayesian statisticians sometimes use "conjugate" priors because they're analytically tractable, even if they're inappropriate for the actual problem).
Note that it's not really just literal "measurement noise", but also any other sources of variation that affect only one measured variable.
Replies from: dynomight↑ comment by dynomight · 2021-08-18T17:04:34.656Z · LW(p) · GW(p)
Thanks, I clarified the noise issue. Regarding factor analysis, could you check if I understand everything correctly? Here's what I think is the situation:
We can write a factor analysis model (with a single factor) as
where:
- is observed data
- is a random latent variable
- is some vector (a parameter)
- is a random noise variable
- is the covariance of the noise (a parameter)
It always holds (assuming and are independent) that
In the simplest variant of factor analysis (in the current post) we use in which case you get that
You can check if this model fits by (1) checking that is Normal and (2) checking if the covariance of x can be decomposed as in the above equation. (Which is equivalent to having all singular values the same except one).
The next slightly-less-simple variant of factor analysis (which I think you're suggesting) would be to use where is a vector, in which case you get that
You can again check if this model fits by (1) checking that is Normal and (2) checking if the covariance of can be decomposed as in the above equation. (The difference is, now this doesn't reduce to some simple singular value condition.)
Do I have all that right?
Replies from: Radford Neal↑ comment by Radford Neal · 2021-08-19T02:24:13.780Z · LW(p) · GW(p)
Assuming you're using "C" to denote Covariance ("Cov" is more common), that seems right.
It's typical that the noise covariance is diagonal, since a general covariance matrix for the noise would render use of a latent variable unnecessary (the whole covariance matrix for x could be explained by the covariance matrix of the "noise", which would actually include the signal as well). (Though it could be that some people use a non-diagonal covariance matrix that is subject to some other sort of constraint that makes the procedure meaningful.)
Of course, it is very typical for people to use factor analysis models with more than one latent variable. There's no a priori reason why "intelligence" couldn't have a two-dimensional latent variable. In any real problem, we of course don't expect any model that doesn't produce a fully general covariance matrix to be exactly correct, but it's scientifically interesting if a restricted model (eg, just one latent variable) is close to being correct, since that points to possible underlying mechanisms.
comment by tailcalled · 2021-08-18T11:39:13.862Z · LW(p) · GW(p)
This is a point that often comes up in "refutations" of the existence of g. People argue, essentially, that even though tests are correlated, they might be produced by many independent causes. I'd go further---we know there are many causes. While intelligence is strongly heritable, it's highly polygenic. Dozens of genes are already known to be linked to it, and more are likely to be discovered. It's harder to quantify environmental influences, but there are surely many that matter there, too.
So, no, there's no magical number g hidden in our brains, just like there's no single number in our bodies that says how good we are at running, balancing, or throwing stuff. But that doesn't change the fact that a single number provides a good description of how good we are at various mental tasks.
I disagree here. g can totally exist while being a wildly heterogenous mixture of different causes. As a point of comparison, consider temperature; there are many different things that can influence the temperature of an object, such as absorbing energy from or emitting energy via light/other EM waves, exothermic or endothermic chemical reactions, contact friction with a moving object, and similar. The key point is that all of these different causes of temperature variation follow the same causal rules with regards to the resulting temperature.
When it comes to the polygenic influence on g, the same pattern arises as it does for temperature; while there are many different genetic factors that influence performance in cognitive tasks, many of them do so in a uniform way, improving performance across all tasks. We could think of g as resulting from the sum of such cross-cutting influences, similar to how we might think of temperature variation as resulting from the sum of various heating and cooling influences. (Well, mathematically it's more complicated than that, but the basic point holds.)
Importantly, this notion of g is distinct from the average performance across tests (which we might call IQ). For instance, you can increase your performance on a test (IQ score) by getting practice or instruction for the test, but this doesn't "transfer" to other tasks. The lack of cross-task transfer distinguishes g from these other things, and also it is what makes g so useful (since something that makes you better at everything will... well, make you better at everything).
Replies from: dynomight↑ comment by dynomight · 2021-08-18T12:01:17.826Z · LW(p) · GW(p)
Can I check if I understand your point correctly? I suggested we know that g has many causes since so many genes are relevant and thus f you opened up a brain, you wouldn't be able to "find" g in any particular place. It's the product of a whole bunch of different genes, each of which is just coding for some protein, and they all interact in complex ways. If I understand you correctly, you're pointing out that there could be a sort of "causal bottleneck" of sorts. For example, maybe all the different genes have complex effects, but all that really matters is how they affect neuronal calcium channel efficiency or something. Thus, if you opened up a brain, you could just check how efficient the calcium channels are and you're done. Is that right?
If this is right, I do agree that I seem to be over-claiming a bit here. There's nothing that precludes the possibility of a "bottleneck" as far as I know, (though it seems sorta implausible in my not-at-all-informed opinion)
Replies from: tailcalled↑ comment by tailcalled · 2021-08-18T13:36:33.742Z · LW(p) · GW(p)
Well, there's sort of a spectrum of different positions one could take with regards to the realism of g:
- One could argue that g is pure artifact of the method, and not relevant at all. For instance, some people argue that IQ tests just measure "how good you are at tests", argue that things like test-taking anxiety or whatever are major influences on the test scores, etc..
- One could argue that g is not a common underlying cause of performance on tests, but instead a convenient summary statistic; e.g. maybe one believes that different abilities are connected in a "network", such that learned skill at one ability transfers to other "nearby" abilities. In that case, the g loadings would be a measure of how central the tests are in the network.
- One could argue that there are indeed common causes that have widespread influence on cognitive ability, and that summing these common causes together gives you g, without necessarily committing to the notion that there is some clean biological bottleneck for those common causes.
- One could argue that there is a simple biological parameter which acts as a causal bottleneck representing g.
Of these, the closest position that your post came to was option 2, though unlike e.g. mutualists, you didn't commit to any one explanation for the positive manifold. That is, in your post, you wrote "It does not mean that number causes test performance to be correlated.", which I'd take to be distancing oneself from positions 3+. Meanwhile, out of these, my comment defended something inbetween options 3 and 4.
You seem to be asking me about option 4. I agree that strong versions of option 4 seem implausible, for probably similar reasons to you; it seems like there is a functional coordination of distinct factors that produce intelligence, and so you wouldn't expect strong versions of option 4 to hold.
However, it seems reasonable to me to define g as being the sum of whichever factors have an positive effect on all cognitive abilities. That is, if you have some genetic variant which makes people better at recognizing patterns, discriminating senses, more knowledgeable, etc., then one could just consider this variant to be part of g. This would lead to g being composed of a larger number of heterogeneous factors, some of which might possibly not be directly observable anymore (e.g. if they are environmental factors that can no longer be tracked); but I don't see anything wrong with that? It would still satisfy the relevant causal properties.
(Of course then there's the question of whether all of the different causes have identical proportions of effect on the abilities, or if some influence one ability more and others influence another ability more. The study I linked tested for this and only included genetic variants that had effects in proportion to the g factor loadings. But I'm not sure their tests were well-powered enough to test it exactly. If there is too much heterogeneity between the different causes, then it might make sense to split them into more homogeneous clusters of causes. But that's for future research to figure out.)
Replies from: dynomight↑ comment by dynomight · 2021-08-18T13:56:32.592Z · LW(p) · GW(p)
Thanks, very clear! I guess the position I want to take is just that the data in the post gives reasonable evidence for g being at least the convenient summary statistic in 2 (and doesn't preclude 3 or 4).
What I was really trying to get at in the original quote is that some people seem to consider this to be the canonical position on g:
- Factor analysis provides rigorous statistical proof that there is some single underlying event that produces all the correlations between mental tests.
There are lots of articles that (while not explicitly stating the above position) refute it at length, and get passed around as proof that g is a myth. It's certainly true that position 5 is false (in multiple ways), but I just wanted to say that this doesn't mean anything for the evidence we have for 2.
Replies from: tailcalled↑ comment by tailcalled · 2021-08-18T14:06:32.261Z · LW(p) · GW(p)
I agree that a simple factor analysis does not provide anything even close to proof of 3 or 4, but I think it's worth noting that the evidence on g goes beyond the factor-analytic, e.g. with the studies I linked.
Replies from: dynomight↑ comment by dynomight · 2021-08-18T16:38:18.943Z · LW(p) · GW(p)
Thanks for pointing out those papers, which I agree can get at issues that simple correlations can't. Still, to avoid scope-creep, I've taken the less courageous approach of (1) mentioning that the "breadth" of the effects of genes is an active research topic and (2) editing the original paragraph you linked to to be more modest, talking about "does the above data imply" rather than "is it true that". (I'd rather avoid directly addressing 3 and 4 since I think that doing those claims justice would require more work than I can put in here.) Anyway, thanks again for your comments, it's useful for me to think of this spectrum of different "notions of g".
comment by wangscarpet · 2021-08-20T02:57:07.741Z · LW(p) · GW(p)
"Now, suppose that in addition to g, you learn that Bob did well on paragraph comprehension. How does this change your estimate of Bob's coding speed? Amazingly, it doesn't. The single number g contains all the shared information between the tests."
I don't think this is right, if some fraction of the test for g is paragraph comprehension. If g is the weighted average between paragraph comprehension and addition skill, knowing g and paragraph comprehension gives you addition skill.
Replies from: Richard_Kennaway↑ comment by Richard_Kennaway · 2021-08-20T07:54:28.151Z · LW(p) · GW(p)
Yes, conditioning on g makes all the observations anti-correlated with each other (assuming for simplicity that the coefficients that define g are all positive). The case of two factors has come up on LW a few times, but I don't have a reference: if you can get into an exclusive university by a combination of wealth and intelligence, then among its members wealth and intelligence will be anticorrelated, .
When all the eigenvalues after the first are equal, what has zero correlation conditional on g is the measurements along the corresponding principal axes, which are other linear combinations of the observations.
Replies from: tailcalled↑ comment by tailcalled · 2021-08-20T08:37:41.942Z · LW(p) · GW(p)
Sort of. The problem with the post is that it doesn't distinguish between g (the underlying variable that generates the cigar shape) and IQ (your position along the cigar, which will be influenced by not just g but also noise/test specificities). If you condition on IQ, everything becomes anticorrelated, but if you condition on g, they become independent.
Replies from: Richard_Kennaway↑ comment by Richard_Kennaway · 2021-08-20T10:24:47.492Z · LW(p) · GW(p)
g is the thing that factor analysis gives you, and is your position along the cigar. When all other eigenvalues are equal, conditioning on g makes all the observed variables anticorrelated, and all the other factors uncorrelated.
The cigar is also constructed by factor analysis. Factor analysis is the method of finding the best fitting ellipsoid to the data. There is nothing in factor analysis about underlying “real” variables that the observations are noisy measurements of, nor about values along the principal axes being noisy observations of “real” factors.
Replies from: tailcalled↑ comment by tailcalled · 2021-08-20T10:58:09.696Z · LW(p) · GW(p)
g is the thing that factor analysis gives you, and is your position along the cigar.
g is generally defined as being the underlying cause that leads to the different cognitive tests correlating. This is literally what is meant by the equation:
x = wg + e
Factor analysis can estimate g, but it can't get the exact value of g, due to the noise factors. People sometimes say "g" when they really mean the estimate of g, but strictly speaking that is incorrect.
Factor analysis is the method of finding the best fitting ellipsoid to the data.
This is incorrect. Principal component analysis is the method for finding the best fitting ellipsoid to the data. Factor analysis and principal component analysis tend to yield very similar results, and so are usually not distinguished, but when it comes to the issue we are discussing here, it is necessary to distinguish.
There is nothing in factor analysis about underlying “real” variables that the observations are noisy measurements of, nor about values along the principal axes being noisy observations of “real” factors.
Factor analysis (not principal component analysis) makes the assumption that the data is generated based on an underlying factor + noise/specificities. This assumption may be right or wrong; factor analysis does not tell you that. But under the assumption that it is right, there is an underlying g factor that makes the variables independent (not negatively correlated).
comment by romeostevensit · 2021-08-20T19:38:07.591Z · LW(p) · GW(p)
I've been hoping for a long time for someone to do a nice write-up on factor analysis. This is great.
comment by Maxwell Peterson (maxwell-peterson) · 2021-08-18T17:52:24.626Z · LW(p) · GW(p)
Great use of many sequential plots to take the reader through small inferential steps. I always hear about g but never understood it and was so confused that I just kind of ignored it whenever it came up - this helped me get it more.
comment by IlyaShpitser · 2021-08-18T13:17:16.439Z · LW(p) · GW(p)
Replies from: tailcalled, gjm"Well, suppose that factor analysis was a perfect model. Would that mean that we're all born with some single number g that determines how good we are at thinking?"
"Determines" is a causal word. Factor analysis will not determine causality for you.
I agree with your conclusion, though, g is not a real thing that exists.
↑ comment by tailcalled · 2021-08-18T18:11:25.552Z · LW(p) · GW(p)
I agree with your conclusion, though, g is not a real thing that exists.
What would your response be to my defense of g here [LW(p) · GW(p)]?
(As far as I can tell, there are only three problems with the study I linked: 1. due to population structure, the true causal effects of the genes in question will be misestimated (this can be fixed with within-family studies, as was done with a similar study on Externalizing tendencies, 2. the study might lack the power to detect subtle differences between the genes in their specific degrees of influences on abilities, which if detected might 'break apart' g into multiple distinct factors, 3. the population variance in g may be overestimated when fit based on phenotypic rather than causally identified models. Of these, I think issue 2 is unlikely to be of practical importance even if it is real, while issue 1 is probably real but will gradually get fixed, and issue 3 is concerning and lacks a clear solution. But your "g is not a real thing that exists" sounds like you are more pessimistic about this than I am.)
Replies from: IlyaShpitser↑ comment by IlyaShpitser · 2021-08-18T21:56:41.753Z · LW(p) · GW(p)
My response is we have fancy computers and lots of storage -- there's no need to do psychometric models of the brain with one parameter anymore, we can leave that to the poor folks in the early 1900s.
How many parameters does a good model of the game of Go have, again? The human brain is a lot more complicated, still.
There are lots of ways to show single parameter models are silly, for example discussions of whether Trump is "stupid" or not that keep going around in circles.
↑ comment by tailcalled · 2021-08-19T07:30:56.553Z · LW(p) · GW(p)
This seems to be an argument for including more variables than just g (which most psychometric models IME already do btw), but it doesn't seem to support your original claim that g doesn't exist at all.
(Also, g isn't a model of the brain.)
↑ comment by gjm · 2021-08-18T14:15:52.012Z · LW(p) · GW(p)
(You seem to have put your comments in the quote-block as well as the thing actually being quoted.)
Since immediately after the bit you quote OP said:
No. A perfect fit would only mean that, across a population, a single number would describe how people do on tests (except for the "noise"). It does not mean that number causes test performance to be correlated.
it doesn't seem to me necessary to inform them that "determines" implies causation or that factor analysis doesn't identify what causes what.
(Entirely unfairly, I'm amused by the fact that you write '"Determines" is a causal word' and then in the very next sentence use the word "determine" in a non-causal way. Unfairly because all that's happening is that "determine" means multiple things, and OP's usage does indeed seem to have been causal. But it may be worth noting that if the model were perfect, then indeed g would "determine how good we are at thinking" in the same sense as that in which factor analysis doesn't "determine causality for you" but one might have imagined it doing so.)
comment by mukashi (adrian-arellano-davin) · 2021-08-18T01:31:43.707Z · LW(p) · GW(p)
That was a great post. Thanks
What did you use to make the rotating plots?
Replies from: dynomight↑ comment by dynomight · 2021-08-18T01:50:59.193Z · LW(p) · GW(p)
I used python/matplotlib. The basic idea is to create a 3d plot like so:
fig = plt.figure()
ax = fig.add_subplot(111, projection='3d')
Then you can add dots with something like this:
ax.scatter(X,Y,Z,alpha=.5,s=20,color='navy',marker='o',linewidth=0)
Then you save it to a movie with something like this:
def update(i, fig, ax):
    ax.view_init(elev=20., azim=i)
    return fig, ax

frames = np.arange(0, 360, 1)
anim = FuncAnimation(fig, update, frames=frames, repeat=True, fargs=(fig, ax))
writer = 'ffmpeg'
anim.save(fname, dpi=80, writer=writer, fps=30)
I'm sure this won't actually run, but it gives you the basic idea. (The full code is a complete nightmare.)