Covid 7/9: Lies, Damn Lies and Death Rates
post by Zvi · 2020-07-09T13:40:01.359Z · LW · GW · 13 commentsContents
  Positive Test Counts
  Deaths by Region
  Positive Test Percentages
  Nevertheless, She Persisted Talking To Her Area Man About Exponential Growth
  Covid: Beyond Death
  I’m Not Dead Yet
  Protecting the Vulnerable
  Better Treatment
  Fraud
  Mask On, Mask Off
  Testing Delayed is Testing Denied
  Taking Authorities to School
  Temporary Immunity Ending Real Soon Now Watch Continues
  Predictions for Next Week
None
13 comments
Previously: Covid 7/2: It Could Be Worse
When I posted the link on Twitter, I joked that we already knew this week’s headline.
It turns out we didn’t. Not quite yet. I’m waiting on that one until next week.
Here’s what I said last week about death rates not picking up:
June 18 starts the surge in positive tests that represents the full second wave. June 23 represents when it accelerates. My default assumption has been one week to test positive, and about two weeks after that to see the average death.
That would mark the surge in deaths to start around July 2. In other words, today, with things picking up speed on July 7.
So no, this isn’t weird. Not yet. But if there is no spike in the next seven days, then that’s pretty weird. If that actually happened, I’d look more carefully at hospitalization data, which I usually disregard as not worth the trouble. But mostly I’d be terribly confused. The infection fatality rate seems to clearly have fallen, but why would it have fallen so much so quickly now that a surge in infections doesn’t kill more people? Quite the tall order.
Today is July 9. There was no rise in death rates starting on July 2. The holiday weekend shifted a bunch of reporting forward a few days, so tracking changes this week has been wonky. Death rate only picked up on July 7-8, and much of that was delayed reporting. Death rate this week is only slightly higher than last week’s.
It needs to be said up front. This is really weird. It’s not as weird as it looked before the last two days, but it’s still weird. I’m not going to back away and pretend it isn’t weird. Time to further investigate and break down potential causes, along with other news.
First, let’s run the numbers.
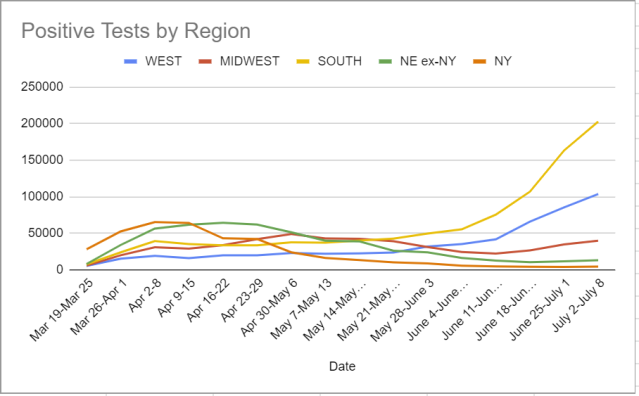
Positive Test Counts
| Date | WEST | MIDWEST | SOUTH | NORTHEAST |
| May 7-May 13 | 22419 | 43256 | 37591 | 56892 |
| May 14-May 20 | 22725 | 42762 | 40343 | 52982 |
| May 21-May 27 | 23979 | 39418 | 42977 | 37029 |
| May 28-June 3 | 32200 | 31504 | 50039 | 33370 |
| June 4-June 10 | 35487 | 24674 | 55731 | 22693 |
| June 11-June 17 | 41976 | 22510 | 75787 | 17891 |
| June 18-June 24 | 66292 | 26792 | 107,221 | 15446 |
| June 25-July 1 | 85761 | 34974 | 163,472 | 16303 |
| July 2-July 8 | 103,879 | 40139 | 202,863 | 18226 |
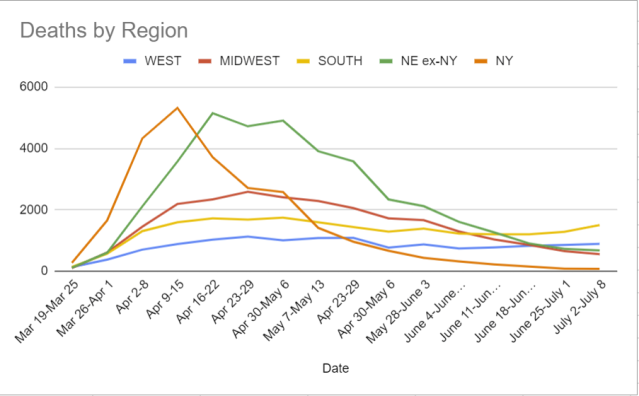
Deaths by Region
| Date | WEST | MIDWEST | SOUTH | NORTHEAST |
| May 7-May 13 | 1082 | 2288 | 1597 | 5327 |
| Apr 23-29 | 1090 | 2060 | 1442 | 4541 |
| Apr 30-May 6 | 775 | 1723 | 1290 | 3008 |
| May 28-June 3 | 875 | 1666 | 1387 | 2557 |
| June 4-June 10 | 743 | 1297 | 1230 | 1936 |
| June 11-June 17 | 778 | 1040 | 1207 | 1495 |
| June 18-June 24 | 831 | 859 | 1204 | 1061 |
| June 25-July 1 | 858 | 658 | 1285 | 818 |
| July 2-July 8 | 894 | 559 | 1503 | 761 |
Positive Test Percentages
| Date | USA tests | Positive % | NY tests | Positive % |
| May 7-May 13 | 2,172,015 | 7.5% | 202,980 | 8.2% |
| May 14-May 20 | 2,628,492 | 6.1% | 246,929 | 5.6% |
| May 21-May 27 | 2,687,257 | 5.5% | 305,708 | 3.5% |
| May 28-June 3 | 3,055,035 | 5.0% | 417,929 | 2.2% |
| June 4-June 10 | 3,182,937 | 4.4% | 438,695 | 1.4% |
| June 11-June 17 | 3,459,903 | 4.6% | 442,951 | 1.1% |
| June 18-June 24 | 3,646,283 | 5.9% | 440,833 | 1.0% |
| June 25-July 1 | 4,336,532 | 7.0% | 419,696 | 1.2% |
| July 2-July 8 | 4,512,567 | 8.1% | 429,804 | 1.1% |
Less increase in overall positive rates than feared, but no sign of things becoming stable. New York looking like it might not head right back into the fire.
Nevertheless, She Persisted Talking To Her Area Man About Exponential Growth
Death rates have not fallen as much as a naive measurement would imply, because it takes time for deaths to accumulate as infection rates have gone up. The last two days imply rates have fallen less than we thought. The numbers are likely, shall we say, not fully accurate. But death rates have fallen. That’s excellent news.
The problem is that if we can’t otherwise contain the spread of the virus, a huge share of everyone not under a hard personal lockdown is going to get infected on our way to herd immunity.
Looking at the second and third derivatives we see, it doesn’t seem like there’s much hope of halting the exponential without bold new action. Aside from new mask mandates, I see essentially no new bold action.
You can reduce the multiplier on the exponential. That buys you a little time. But the exponential is going to dominate the multiplier, unless the multiplier keeps falling rapidly. I don’t see how that happens remotely fast enough.
Covid: Beyond Death
Before we discuss death, it is also important to remember that death is not the only consequence of Covid-19. I haven’t made enough mention of this in prior posts.
I do not know of good statistics on longer-term consequences for survivors of Covid-19, or how those consequences break down by age or other risk factors.
What I do know is that there is substantial risk of permanent lung and other damage, including in the relatively young.
The two closest people to our family who have had Covid-19 are our older son’s former teacher, and a personal trainer I used to use and have known for years. The trainer’s whole life revolved around working out, eating right and getting others to do the same. It wasn’t merely a job but a passion for her.
The good news is that both survived. The bad news is, neither has fully recovered. Months later, both are still getting regular medical treatments for ongoing problems. The damage appears permanent. The trainer’s heart and lungs are both permanently damaged, and it’s unclear she’ll ever be able to do her job properly again. Life for both remains no fun.
So, seriously folks, if you’re old enough to be reading this, you do not want to get Covid-19. You really, really don’t want to get Covid-19. Death is not he only thing that can go wrong. It’s not worth it.
It’s also a pretty bad time to get infected in many places. There’s a decent chance the health care system will not be fully there to help you, and any recent gains from better treatment will get more than reversed.
Stay safe to the extent it is feasible to do so. Don’t merely follow some official guidelines or simple rules like ‘wear a mask’ or ‘keep six feet apart’ and ‘wash your hands and don’t touch your face’ although you should also totally do those three things. Think hard about what you’re physically doing. It’s not optional until you get a positive antibody test.
I’m Not Dead Yet
Last week, I offered six potential explanations for the falling death rates. We could group them into three basic categories.
Explanations 1+5: We are doing a better job treating people who get infected.
Explanations 2+3+6: Different people are getting infected who are less vulnerable.
Explanation 4: We are increasingly covering up deaths.
I put some responsibility on each of the three categories.
Protecting the Vulnerable
The first category carries some weight and is essentially neutral news. It’s good that less people are dying, but it’s bad in the sense that everyone’s personal risk if infected hasn’t changed. One must be increasingly cautious even if death rates are down.
And they can easily be down a lot from this if things adjust! Remember my best guess at death rates by age and comorbidity. Infect everyone under age 50 that doesn’t have diabetes and isn’t obese, and the expected death rate would be about 0.03%, versus a best-guess IFR of between 0.5% and 1%, and a case fatality rate for the United States that is falling steadily but still over 3.5%. Fatalities are mostly a function of how many old and vulnerable people are infected, rather than how many infections there are across age groups.
Perhaps the surge in infections is young people modifying their behaviors, while old people don’t modify their own. In that case, you’d expect the infection rate to go up while deaths didn’t go up much or even continued to slowly decline.
For a while.
After enough cycles of this, the young would infect the old more even if the old didn’t change behavior. So unless they lock down even further than before, the death rate would start rising back up. The difference is this would be a delayed reaction. We’d see it only in infections that happened after the wave was well underway. Instead of deaths starting to increase on July 2 and accelerating on July 7, as I predicted last week, we’d see a slower ramp-up effect starting in mid-to-late July. The fatality rate would fall, but the level of deaths would still increase. When we got to herd immunity, we’d have successfully kept a lot of our most vulnerable safe, but far from all of them.
Reports are that the average age of infection in Florida is down to about 37, from a previous level of 60. That’s a big change. Fauci says this is happening throughout the South.
I think we should accept this is likely a lot of the story. It’s a big gain, but it’s a one time gain and it doesn’t impact your personal risk. Thus, we shouldn’t expect much additional gain from better protecting people going forward, beyond than the ‘gains’ from opening schools. The death rate has dropped as much from this as it is going to drop.
Better Treatment
There have also been reports that our treatment techniques are improving, and claims our testing has improved. These would be the best possible news.
On testing, see the section below about testing. Testing is actively getting worse at this point, rather than better, with long wait times. Things were improving before, but now they’re worse again, so these gains should reverse.
Hospital capacity is filling up, and treatment is getting rationed out of necessity more and more. It’s March all over again in a new location, and once again we were not prepared. The only difference is that this time there is even less excuse. These gains too should largely reverse.
I don’t have a good sense of how much better our knowledge is in terms of cashing it out in earlier detection of need to test slash be concerned, or in terms of better outcomes. I doubt anyone is that confident in the magnitude here. Given the amount of newsworthiness of a genuine breakthrough, I have to assume gains have been gradual accumulation of technique, and that it has a moderate but real effect. Nothing dramatic.
Fraud
That brings us to fraud.
It is clear that there was a lot of pressure from those in power, especially in the South, to report less deaths so that they could continue to reopen. The question is how much suppression or delay actually happened.
There are levels of fraud that might be going on.
We certainly had unusually large delays in reporting of deaths this week due to the holiday weekend. People don’t hang on in “Jefferson still lives” style because it’s our nation’s birthday. Every weekend there’s reporting pushed into the future, both tests and deaths. If anything, test reporting was not delayed much this weekend, whereas death reporting was delayed a lot, unless my July 7 prediction came true far more dramatically than I would have expected.
How much pushing of deaths into the future there was, or otherwise time shifting results to make things look good, is unclear. My guess is quite a bit.
One simple option is to attribute the deaths to something else. There are plenty of reports of people who couldn’t get a test, or whose death was attributed to either an unknown cause or to something like heart disease, pneumonia or stroke, where Covid-19 may or may not have been a ‘contributing factor.’
A similar method is to have something called ‘probable’ Covid-19 deaths, and choose to ignore them. Then pile as many deaths as possible into that category. New Jersey had a huge bump in cases when it started counting such deaths. New York City did something similar that still isn’t in the state statistics as far as I can tell. I am confident that such deaths are not currently being counted. As the system gets taxed more, it is easier and easier to let such deaths not be counted.
I asked on Twitter if anyone could help me find statistics on the number of deaths from unknown causes over time – the ‘mysterious deaths’ that one report claimed were increasing quite a bit, perhaps enough to double the Covid-19 death rate. I got some likes but no one had an answer. If you do know, please help.
All of that presumes a certain amount of shame, a sort of ordinary decent fraud. It’s reporting at Simulacra Levels 2 or 3. You’re pretending that your numbers reflect reality, or at a minimum, you’re pretending to pretend. My gut says things are somewhere in between those two. Everyone who pays attention knows we miss a lot of deaths and infections, yet we keep quoting those numbers without an adjustment, but we still like to think the numbers have a link to the profound reality. In some places, things moved on to the cooking of the books, where the numbers are pretending to pretend, and the veil is just good enough that we can’t prove anything.
Then there’s outright making things up. Is this happening? I don’t know. I certainly hope not. The last two days give me hope that it isn’t happening. But if we stayed around 500 deaths per day for another week while hospitalizations keep rising, regardless of what happens to positive cases, that means they’ll have stopped pretending to pretend. The numbers will be whatever they choose to report, full simulacra level 4 material. We’ll know, with common knowledge, what kind of government we are dealing with.
There was a Bloomberg news headline that death rates were down and it was nothing to celebrate. It was rightfully widely mocked, because actual low death rates are absolutely a good thing. But if it reported this way next week, then no. It’s not a good thing. It should be presumed to be a very very bad thing. It would mean we are being lied to on a whole new level, and much if not all is lost.
We need to at least demand a plausible lie.
Mask On, Mask Off
Wear a mask. Everyone wear a forking mask. Avoid and shame anyone not wearing a mask. That is all.
It’s not all, mostly because every authority starting with the W.H.O. lied to us and said masks didn’t work outside the exact right situations. But still, that is all.
Note that the W.H.O. still had issues with whether the virus is airborne, presumably because people might have the ‘wrong’ reaction to them admitting that.
The current debacle with the C.D.C. saying testing doesn’t work outside of the exact right situations, to try and get people to react the way they want, shows we have learned nothing. It’s not working and it’s further poisoning the well.
I have an idea. Stop lying to people. Crazy, I know.
Testing Delayed is Testing Denied
My wife is a psychiatrist. Thus, she has a Quest account to allow her to order various tests when people need them. This past week, she got an email from Quest asking her not to order Covid-19 tests if she could avoid it – they are backlogged, and ordering more tests will delay getting results to everyone else who needs them.
This lines up with reports from Arizona and other Southern states of waits of over a week to get Covid-19 test results back.
A test that takes a week isn’t completely worthless. You get to look back on what you already had, after it’s done. So that’s useful. But mostly it’s a de facto antibody test. First you get the symptoms that justify getting the test. Then, after you’re symptomatic, you have to get a test, which in many of these areas is no small feat if you don’t need hospitalization. Then, about two weeks into the infection if you’re positive, you’ll learn your status.
In the meantime, you have to act like you’re infected, or act like you’re not infected, or try to make some compromise, and all your options are terrible. Everyone who has been in contact with you is in limbo. Everyone in your family is in a panic, not knowing what to do. You can’t follow proper protocols. It’s a very bad scene. It’s much worse than a mere ‘can’t contact trace.’
We are both running more tests and have an increasing backlog of test demand. That’s another way to see things are rapidly getting worse.
I hope that everyone reading this knows what must be done – we need to prioritize however many samples the system can handle and get them back quickly, and outright refuse the rest, while working to ramp up capacity for the future.
The question is how.
This is America, so allocating scarce health care resources by price is anathema.
Given we can’t do price, the obvious answer is need. Better to determine a priority queue, based on level of exposure, vulnerability and symptoms. Process the top priority tests until you run out of capacity. Repeat.
Tests becomes less valuable to get back over time, not more, so the solution of doing this in first in, first out order is almost the actual worst solution. It encourages more tests to pile up, and gradually gets worse with even a small imbalance, like a traffic jam.
We would be better off getting those in real danger tests, then doing a pure lottery for everyone not in need of hospitalization.
Of course, all of that assumes there is a finite amount of testing to distribute. That’s not true at all. There’s as much testing as we want to pay for and permit. The good news is that the answer to that is gradually going up. The better news is that it could go up a hell of a lot faster if we’d let it. It’s really, really easy to set up useful Covid-19 testing. If only it were legal.
Taking Authorities to School
Mike Pence has said “we don’t want the CDC’s guidelines to be the reason schools don’t reopen.”
Thing is, he’s one hundred percent right on this one. It has become common these days for many people to ‘say the quiet part out loud.’ This is no exception. We can now say out loud that the CDC’s guidelines have little correlation to what is actually safe.
We should reopen the schools if and only if it is safe enough to do so that it is worth the benefits.
What we absolutely not do is open the schools if and only if and to the extent possible they can abide by tons of other crazy regulations while also satisfying a technical requirement document that mixes arbitrary dictum with lots of ‘considers’ and ‘to the extent possibles’ that comes from an agency that (if you recall from last week) thinks that doing additional testing is not known to make a school safer.
This blog’s views on school are rather skeptical. Set those views aside, and assume that sending a child to school enriches their experience and prepares them for success and is not at all a prison where they are taught to obey arbitrary authority and guess the teacher’s password so they can be drones their whole lives. For the sake of argument, school good!
That does not make current plans of many places to partially reopen schools make sense.
Partial reopening, in practice, means students are in-person some of the time, in order to reduce class size and allow ‘proper social distancing.’
Parents who are uncomfortable sending kids to school at all will keep them home, which will help further reduce class size. That’s good.
Schools can be thought of as providing a basket of potential benefits.
To the extent that the benefit is logistical, this plan is terrible. If you need to go to a job, being free to do so half the time is not that useful. You still can’t do your job. Our society is not set up to allow this kind of half-measure to reap half the benefits.
To the extent that the benefit is social, this plan is terrible. Kids won’t be able to do social activities. That’s the whole point of social distancing.
To the extent that the benefit is physical activity and such, kids again likely won’t be able to do those things in any worthwhile way. A photo from a recess of each child in their chalk circle with their own ball remains perhaps the saddest thing I’ve ever seen.
To the extent that the benefit is signaling, burn the whole thing to the ground and nothing matters anyway.
To the extent that the benefit is educational, and I’m able to say that without laughing, it’s harder to predict. This plan does manage to potentially extract half or more of the benefits. In theory, one could even claim this is more than all of the benefits. Perhaps half the time in a 10-child class and half the time on one’s own to study is actually way better for learning than all the time in a 20-child class. Seems plausible, actually, even if you think the 20-child class is net useful. So presumably this is the argument in favor of the plan, if one could intelligently take advantage of the new structure. Somehow I don’t expect that to happen.
My expectation is that the needs of masks and social distancing guidelines, and the general confusion and paranoia and need to check off boxes, will take away all the potential gains while compounding the losses.
Could you redesign a school around the idea of checkpoints with adults to review and ask questions and introduce the next section, alternating with working on one’s own, with high customization and adaptation to each child, and have it be an improvement? Yes, I think you could.
That’s not remotely what’s going to happen almost anywhere.
All of this is being directly driven by CDC guidelines. Six feet has become even more fully a magical talisman one wraps around one’s self in order to create a Circle of Protection: Covid-19, the same way masks are now being talked about as the one and only true savior, because no one in authority believes most people can handle a story more subtle than that.
What will actually happen is that kids and teachers will be in rooms for hours on end, without windows, with bad circulation, mostly not even allowed to go to the bathroom. With many kids rotating between teachers after periods exactly long enough to ensure maximum infection opportunities. Or, if the kids would otherwise have always had the same teacher, the teacher will see the two halves of the class at different times. Everyone will be frustrated and mad and confused and distracted all the time.
Kids who are infected will give it to teachers who will pass it off at other times to other kids in other sections the next day. The gains from being young, having masks and being a few feet apart will be blown up by being constantly indoors with bad circulation.
Everything that follows is coming from the twin mandates ‘six feet apart’ and ‘given six feet apart, open the school.’ And regulations that prevent any creative solutions whatsoever.
Result, total clusterfork.
Instead, we need to choose from two options.
Option one is to admit that we can’t open the schools yet, at least in many or most places, and keep them closed until conditions improve.
As a bonus, we could admit that kids don’t need babysitters all the time. Yes, they do when they’re three. But at six years old, my son could be left alone in our house or backyard or the playground for a few hours, and if everyone thought that this was fine, it would be fine. We mostly don’t do it because society would think it insane and call the cops on us. Certainly by eight most kids are totally fine on their own. Everything to the contrary is people who are very bad at statistics. We could all use a little Christopher Titus parenting. A little. A lot would be bad. A little.
We won’t do that, of course. But it’s worth noting that not only are schools primarily babysitters, they’re babysitters we mostly never needed in the first place.
Option two is to admit that we need the schools, open them to all kids who want to go while giving parents the option of remote learning if they want it, and accept that it’s not going to be all that safe.
If schools are essential, they’re essential. Kids will be all right, those who live with the vulnerable can study from home. Vulnerable teachers can teach the at-home kids, and there are plenty of people who need jobs so hire more teachers to split up classes. Rent now-empty offices and hold classes outdoors to free up space. Get creative. Hope that’s good enough.
Either choice might be correct.
My take on this choice is that we should open the schools if either we can do so while containing the virus or we cannot contain the virus no matter what we do.
If we can contain the virus and get schools back, great, let’s do that and maintain people’s jobs and civil order and so on.
If we can’t contain the virus and get schools back, but we can contain the virus by closing schools, and it looks reasonable to hold out until a vaccine or other solution will let us reopen the schools, then it’s crazy to open the schools and we should keep them closed.
If we can’t contain the virus and get schools back, but we also can’t contain the virus by closing schools, then at this point a slower burn is worth little to us and might be actively counter-productive. Might as well reopen the schools for anyone who wants them.
We’ve managed to go down the path of nuking our economy pretty bad while also not stopping the virus. This gets us an outcome worse than either full suppression or full mitigation.
Our plan for the schools is similar.
Temporary Immunity Ending Real Soon Now Watch Continues
It seems like every week we get Dire Official Warnings that immunity to Covid-19 is short-lived. Often the reasoning is ‘another person pointed out that we don’t know how long immunity lasts.’ Other times it’s ‘we looked and people’s antibody counts are declining and oh noes.’ Or it looks like one person got reinfected.
We don’t know how long immunity lasts.
What we do know is that it lasts at least as long as this pandemic has been in the West, for essentially everyone. Reinfections are something every Responsible Journalist is on the lookout for as the next big Responsible Journalist scoop. Absence of evidence, in this case, is strong evidence of absence.
Note that when a study points out that people’s antibody counts are fading, yet there are no reports of reinfection, this implies that there is a lower than expected threshold of antibodies necessary to become immune, or even that the antibodies we are measuring aren’t the primary mechanism granting immunity from meaningful reinfection.
It seems appropriate to apply a modified form of the Lindsey Rule to the length of immunity. At the start, we had no idea how long it would last. Now we know it lasts at least four months before any substantial decrease takes place (we can’t assume that enough Chinese patients were re-exposed, or that China would report it if they were infected again, so to get enough bulk we have to start around March). The scary conclusion would be that immunity could be expected therefore to start to fade after about eight months. For the average person it would be expected then to last at least twice that long, so sixteen months, which is into vaccine territory. I consider that the conservative, scary estimate, that doesn’t use other priors. But my prior at the beginning, before any evidence, was already longer than that. Good news shouldn’t shorten that estimate.
In any case, yes, going for a herd immunity strategy carries some risk that immunity does not last as long as we would like. But mostly these concerns are, in practice, scaremongering, and deserve to be called out as such, so this is the periodic calling out.
Predictions for Next Week
I expect the rise in death rates from the last two days to continue, and things to get steadily worse on all fronts. Deaths are up in the South, as one would expect. This should accelerate.
I see no reason to expect us to turn the corner any time soon. As the health care system starts breaking down in the worst areas, we likely see the death rates rise faster than the case rates, rather than slower.
Eventually, of course, things left unchecked creates herd immunity and the corner does get turned.
At this pace, if we change almost nothing, how long will it take to turn that corner? Not that long. A few months. We are already at 60,000 plus reported cases per day plus exponential growth.
13 comments
Comments sorted by top scores.
comment by PeterMcCluskey · 2020-07-09T23:06:30.295Z · LW(p) · GW(p)
For suspicions about bad reporting of deaths, this CDC page (somewhat tricky to read) has relevant data in the column 'Symptoms, signs and abnormal clinical and laboratory findings, not elsewhere classified (R00-R99)'.
New York state showed an unusual surge that peaked in late February.
Many states have shown unusual increases in that category starting around mid April.
It looks like the deaths in that category for the week ending June 13 were about 2491 above 2019 levels (more recent weeks have less complete data).
The states with the biggest recent increases in that death category (using the difference from the comparable week in 2019, as a fraction of all deaths): Hawaii, New Mexico, Colorado, Nevada, Utah, and Ohio. I'm unsure what to make of this pattern.
Replies from: None, Zvi↑ comment by [deleted] · 2020-07-10T23:52:28.721Z · LW(p) · GW(p)
Oh my god... in the Florida data, the numbers of that 'not elsewhere classified' category are now twice the number of official COVID-coded deaths, and 4x baseline!
This would mean that they are mislabeling two thirds of the deaths. If you add up the excess deaths of that code and the covid deaths, the death rate did not actually decline in that state at all and instead has been in a plateau since April.
↑ comment by Zvi · 2020-07-10T15:23:15.905Z · LW(p) · GW(p)
That's it! Thanks. How did you do that calculation?
I see ways to do it but none that aren't annoying to implement. If I was a better coder I'd be tempted to write a scraper.
Replies from: PeterMcCluskey, spkoc↑ comment by PeterMcCluskey · 2020-07-10T19:04:57.071Z · LW(p) · GW(p)
I downloaded it in their csv format and whipped up this python program to process it (I hope someone improves on it):
#!/usr/bin/python
# -*- coding: utf-8 -*-

import re, sys, io, getopt, csv

def parse(filename):
    column_dict = {}
    list_states = []
    val_dict = {}
    week_dicts = {'2019' : {}, '2020': {}}
    with open(filename, 'r') as fd:
        reader = csv.reader(fd, delimiter=',', quotechar='"')
        for row in reader:
            if row[0] == 'Jurisdiction of Occurrence':
                for i, fld in enumerate(row):
                    column_dict[fld] = i
                unknown_col = column_dict['Symptoms, signs and abnormal clinical and laboratory findings, not elsewhere classified (R00-R99)']
                continue
            yyyymmdd = row[0][:10].replace('-', '')
            yyyy = row[1]
            week_num = int(row[2])
            tokens = row[3].split('/')
            yymmdd = "%s%02d%02d" % (tokens[2][-2:], int(tokens[0]), int(tokens[1]))
            state = row[0]
            mystery_deaths = row[unknown_col].strip(' ')
            all_deaths = row[column_dict['All Cause']].strip(' ')
            if not (state in list_states):
                list_states.append(state)
            #print("%s %6s %6s %-s" % (yyyymmdd, mystery_deaths, all_deaths, state))
            week_dicts[yyyy][week_num] = yymmdd
            val_dict[yyyy + str(week_num) + state] = (mystery_deaths, all_deaths)
            #break
    num_weeks = len(week_dicts['2020'].keys())
    start_week = 4
    s = "%15s" % ''
    s2 = "%15s" % ''
    for i in range(start_week, num_weeks + 1):
        s += "%6d " % i
        s2 += "%s " % week_dicts['2020'][i]
    print(s)
    print(s2)
    tot_w24 = 0
    for state in list_states:
        s = "%-15.15s " % state
        for week_num in range(start_week, num_weeks + 1):
            try:
                (mystery_deaths2020, all_deaths) = val_dict['2020' + str(week_num) + state]
                (mystery_deaths2019, all_deaths2019) = val_dict['2019' + str(week_num) + state]
            except KeyError:
                s += '       '
                continue
            try:
                delta = (float(mystery_deaths2020 or 0) - float(mystery_deaths2019 or 0)) / float(all_deaths)
            except ValueError:
                print("skip %s %s %s %s %s." % (state, week_num, mystery_deaths2019, mystery_deaths2020, all_deaths))
                s += '       '
                continue
            if week_num == 24:
                tot_w24 += float(mystery_deaths2020 or 0) - float(mystery_deaths2019 or 0)
            s += "%5.2f  " % (100*delta)
        print(s)
    print("tot_w24 %s" % tot_w24)

if __name__ == '__main__':
    import getopt
    avail_opts = ['acct=',
    ]
    (options, args) = getopt.getopt(sys.argv[1:], '', avail_opts)
    option_dict = {}
    for opt in options:
    option_dict[opt[0][2:]] = opt[1]
parse(args[0])comment by Adam Zerner (adamzerner) · 2020-07-09T22:37:22.855Z · LW(p) · GW(p)
At first I had sort of an outside view idea that a) other countries are successfully recovering, b) the US might have had a worse government response and more irresponsible citizens, but I don't think it's that far off from the reference class of these other countries, and thus c) the US won't have that much worse an outcome.
In retrospect this seems silly. Now it seems to me that because of how powerful exponential growth is, small-ish differences can totally lead to drastically different outcomes.
comment by romeostevensit · 2020-07-09T19:42:30.056Z · LW(p) · GW(p)
It was a good exemplar of simulacra levels when I went to google for risk models of eating take out food and I literally could not tell what, if any information any of the results were actually communicating.
comment by Ann (ann-brown) · 2020-07-09T17:10:44.823Z · LW(p) · GW(p)
Leaning towards tested antibodies not being the main/only form of immunity after reading https://medicalxpress.com/news/2020-06-immunity-covid-higher-shown.html , though we'll want to see how followup studies go.
comment by Maxime Riché (maxime-riche) · 2020-07-09T14:37:09.769Z · LW(p) · GW(p)
Explanations 1+5: We are doing a better job treating people who get infected.
Explanations 2+3+6: Different people are getting infected who are less vulnerable.
Explanation 4: We are increasingly covering up deaths.
I did not read everything... but between the 1st and 2 wage, there is ~ x5 time less death but ~ x2 more daily cases currently. Could this be also explained by much more tests being done?
Then the first wage would have been ~x10 time higher than reported in the comparaison and the second wage would currently be still below the first.
Replies from: None, luke-allen↑ comment by [deleted] · 2020-07-10T23:42:28.145Z · LW(p) · GW(p)
Here's a first-principles normalization - take national tests, and normalize the positives to the total number of tests performed. This assumes linear returns to testing which is wrong, but it produces a curve of the shape of ACTUAL infections (without telling you the true number, just its relative shape over time) that mirrors the death curve shifted by two weeks very closely:
https://twitter.com/econstatsnerd/status/1276629941384331264
Replies from: Zvi↑ comment by Luke Allen (luke-allen) · 2020-07-09T22:15:37.760Z · LW(p) · GW(p)
According to right-wing media I listened to with half-an-ear and thus cannot repeat their methodology, "they" changed the definition of "case" to include something related to contact tracing.
Man, it's hard to filter out noise in this environment. The Lancet has a paper from April on how China redefined cases to account for asymptomatics and contact tracing, and saw a huge jump in cases. But if the definition of "case" changes and there's a jump in the number of "cases," it probably means nobody's reinterpreting the previous number of cases with the new definition, either to scare people into wearing masks or so as not to confuse the public with changed numbers.
Replies from: wizzwizz4↑ comment by wizzwizz4 · 2020-07-10T15:05:36.606Z · LW(p) · GW(p)
or so as not to confuse the public with changed numbers
If you're withholding knowledge to avoid confusing people, chances are that your withholding is the primary source of confusion. Just say "new estimates" or "revised estimates" – job done.