Omicron Post #9
post by Zvi · 2021-12-23T21:50:10.466Z · LW · GW · 11 commentsContents
  Reactions
  Best Possible News?
  South Africa
    Results
    Conclusion
  United Kingdom
  Denmark
  Around the World
  Severity
  Severity Synthesis
  Threads
  Other
  Predictions Update
    Chance that Omicron has a 100% or bigger transmission advantage in practice versus Delta: 85% → 70%.
    Chance that Omicron is importantly (25%+ in the same person) more virulent than Delta: 3% → 2% (will delist this unless it goes back to 3% or more).
    Chance that Omicron is importantly (25%+ in the same person) less virulent than Delta: 50% → 75%.
    Will the CDC label Omicron a variant of high consequence before 2022? 9% → 5%.
    Chance we will be getting boosters modified for Omicron within 6 months of our previous booster shot: 30% → 25%.
    Chance we are broadly looking at a future crisis situation with widely overwhelmed American hospitals, new large American lockdowns and things like that: 30% → 20%.
    Generation time (serial interval) of Omicron is 3.5 days or less: %? → 75%
None
11 comments
For non-Omicron Covid news (and some additional Omicron news) this week, see the weekly post, the post on testing, and the post on the CDC nowcast.
First off, best possible personal news: Me and my family are feeling much better. The illness has passed. The rapid tests we did all came back negative, so it’s not quite best possible news of getting super mild infections and recovering, but I will very much take it. Thank you to everyone who sent their well-wishes, and to everyone who is sick now, I wish a speedy recovery to you as well.
Now, back to the rest of the Omicron wave.
There are three major fronts. There’s the question of what is happening and how many cases we have, there’s the question of how people are reacting and will react to it, and there’s the question of severity.
On the case front, it looked like the UK might have peaked, which would be big, but it now looks like that was premature. Still, that this could even look like it might have happened is a big piece of the puzzle. My best guess is that the generation time of Omicron is lower than we thought, which means R0 is lower, which means that it’s easier (but still hard, and long term still probably not feasible or advisable) to take enough action to slow it down.
On the severity front, we have a lot more data. As far as I can tell, it mostly tells a consistent story of modestly reduced severity for infection in a given individual (after controlling for everything) in the 30%-60% range, which will help a lot but is no match for exponential growth. I’d love to be conclusive, but it’s all super complex and convoluted. That’s what the bulk of this post is about.
On the reaction front, there have been a lot of extreme reactions to the Omicron situation, by individuals. I’m hearing and noticing a lot of folks deciding to lock it down for themselves. Many of them are doing so in order to ensure they can still have their family Christmas, which seems like an excellent reason even if one is not personally worried.
Reactions
The reaction has been so big that things looked like they might have halted or turned around somehow in the United Kingdom, although that’s looking less likely now. More on that in the UK section.
Individuals reacting is great, because they make much better judgment calls about what’s worthwhile and not worthwhile than broad regulatory rules, and also because of that other problem.

Where I disagree with Nate is that I don’t think the lack of credibility is a problem. I think it is a solution to the fact that the policymakers are not credible. If something isn’t credible, it’s good for us to treat it that way.
In perhaps related news, Mr. President, if you’re not simply lying, please please please have your people call me.

Best Possible News?
This is from a generally excellent overview thread from Bob Watcher. His frame is a fitting one, good news and bad news, with lots of both.
The tricky part is knowing what is good news, and what is bad news. So you think you can tell? It all depends on all the other news. Blowing through in six weeks could be a crisis and a disaster, or it could be mostly harmless and the way we wake up to a new birth of freedom. Missing a lot of cases could mean we’re about to get clobbered, or it could mean things are mostly harmless. And so on.
Plus what is good and bad news depends on what you already know, and thus what remains fixed. There’s always another level.
And thus, in an excellent thread, I found confirmation of what is maybe the best possible news, labeled quite reasonably as bad news, which I’d missed until now (paper, from Norway), and here a case study is plenty of information.

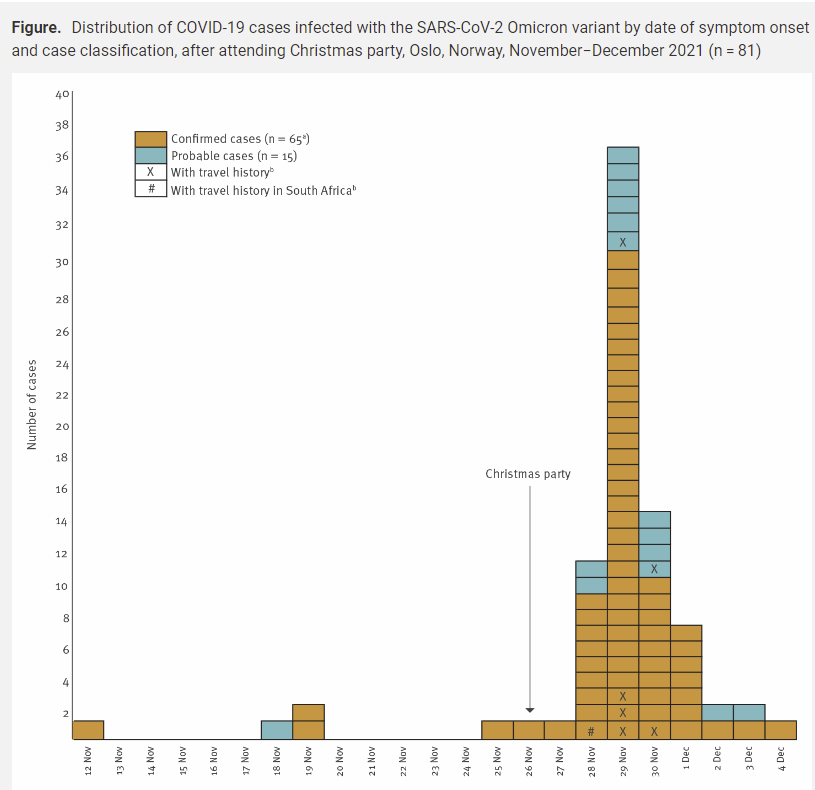
This is potentially the best possible news because of the interaction between R0 and generation time.
We know that Omicron was doubling every two days around the world. Then suddenly maybe it wasn’t.
But if symptom onset comes in three days, and you’re infectious in two, then doubling every two days is perhaps only once per generation. This also matches observations about rapid tests from Mina. There’s a chance we have to do is cut it down by half from here. And that, my friends, is within our powers. A little extra vaccination, a little more caution for a bit, a lot more asymptomatic cases, and the wave is over without overwhelming the hospitals. Huge if true.
Wait. It’s within our powers? Oh, no, maybe? Will we try and shut down everything for months on end for a virus that totally doesn’t justify it?
Or maybe that’s good, because if the choice continues to be left to the public, we’ll mostly make good decisions at this point, and it will be fine again?
It can be really hard to tell heaven from hell.
South Africa
What happened in South Africa, if this was the peak, was remarkable. They got away (mostly) clean. It certainly is suggestive of reduced severity, demographic differences can only go so far.

So far, so good, and it’s getting to be far enough along that this means something.

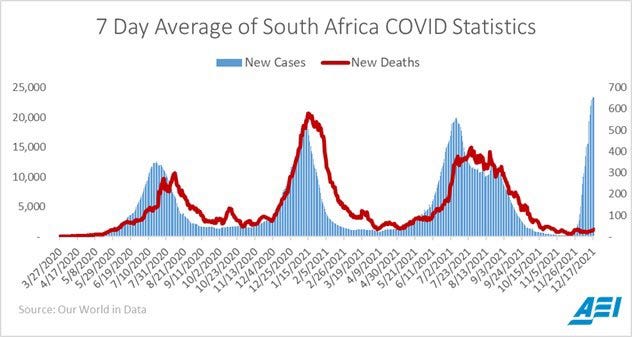
This requires analysis. There’s a new paper out of South Africa claiming Omicron is less severe. Let’s check it out. Their method was to take the whole of South Africa’s hospital system for Maximum Data, so let’s see what they got.
Results
From 1 October through 6 December 2021, 161,328 COVID-19 cases were reported nationally; 38,282 were tested using TaqPath PCR and 29,721 SGTF infections were identified. The proportion of SGTF infections increased from 3% in early October (week 39) to 98% in early December (week 48). On multivariable analysis, after controlling for factors associated with hospitalisation, individuals with SGTF infection had lower odds of being admitted to hospital compared to non-SGTF infections (adjusted odds ratio (aOR) 0.2, 95% confidence interval (CI) 0.1-0.3).
Among hospitalised individuals, after controlling for factors associated with severe disease, the odds of severe disease did not differ between SGTF-infected individuals compared to non-SGTF individuals diagnosed during the same time period (aOR 0.7, 95% CI 0.3-1.4). Compared to earlier Delta infections, after controlling for factors associated with severe disease, SGTF-infected individuals had a lower odds of severe disease (aOR 0.3, 95% CI 0.2-0.5).
Conclusion
Early analyses suggest a reduced risk of hospitalisation among SGTF-infected individuals when compared to non-SGTF infected individuals in the same time period. Once hospitalised, risk of severe disease was similar for SGTF- and non-SGTF infected individuals, while SGTF-infected individuals had a reduced risk of severe disease when compared to earlier Delta-infected individuals. Some of this reducton is likely a result of high population immunity.
So far, so promising, but what did we control for?
We controlled for factors known to be associated with hospitalisation (age, sex, presence of co-morbidity, province and healthcare sector) and adjusted for known prior SARS-CoV-2 infection.
…
We controlled for factors known to be associated with severity (age, presence of comorbidity, sex, province and healthcare sector) and adjusted for the number of days between the date of specimen collection and date of hospital admission, known prior SARS-CoV-2 infection and SARS-CoV-2 vaccination status.
The baseline numbers are certainly impressive.
Among individuals with SGTF infection diagnosed between 1 October – 30 November 2021, 2.5% (261/10,547) were admitted to hospital, compared to 12.8% (121/948) of individuals with non-SGTF infection (P<0.001).
Remember, when the United Kingdom had a study everyone was citing that did similar adjustments, it was based off of 24 Omicron hospitalizations (!) and thus headlines were written. This is rather bigger.
As always, though, it’s not that simple.
Our findings correlate with DATCOV surveillance hospitalisation data showing that, among patients who had a known hospital outcome, 32% of COVID-19 admissions during the early fourth wave were severe compared to 65% during the early third wave.
By November 2021, a high proportion of the South African population had some level of SARS-CoV-2 immunity, as a result of previous natural infection and/or vaccination. It is estimated that after the third SARS-CoV-2 wave 60%-70% of individuals in South Africa had evidence of previous SARS-CoV-2 infection.
By 9 December 2021, 65% of individuals aged ≥60 years, 61% aged 50-59 years, 48% aged 35-49 and 29% aged 18-34 years had received ≥1 dose of SARS-CoV-2 vaccine, and 58% of individuals aged ≥60 years, 55% aged 50-59 years, 43% aged 35-49 and 24% aged 18-34 years were fully vaccinated against SARS-CoV-2 (one dose of Johnson & Johnson or two doses of Pfizer-BioNTech).
It is difficult to disentangle the relative contribution of high levels of previous population immunity versus intrinsic lower virulence to the observed lower disease severity. Our finding of no difference in severity in SGTF compared to non-SGTF infected individuals in the same time period, and the lower risk of severity in SGTF compared to earlier Delta infected individuals, suggests that this reduced severity may be in part a result of high levels of population immunity (due to natural infection and/or vaccination). Incomplete vaccination data, and the fact that the majority of re-infections were likely not detected, resulted in incomplete adjustment for the effect of prior immunity in our analyses.
Damn it. But also, the same time period? What time period? The best guess we could come up with (I had an assistant helping me on this, as a trial run) was that it meant an item in table 2:

Which is a small sample size, and suggests that we pay close attention to date but doesn’t in and of itself worry me too much if we can otherwise dismiss effects over time, which we’ll get to later.
There wasn’t that big a window of overlap between Delta and Omicron.
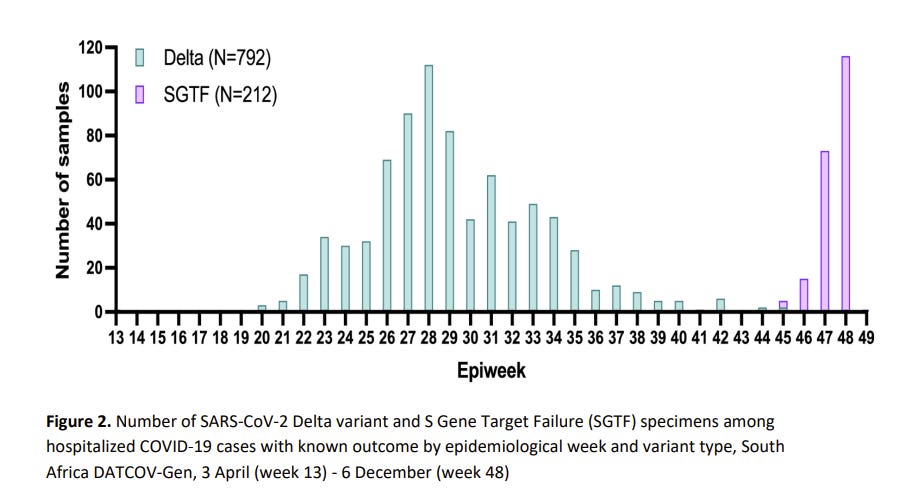
They don’t seem to be taking this problem seriously enough. Shouldn’t we be attempting to measure the decline in severity and hospitalization risk over time before Omicron shows up, here? That seems like a big deal, and we should have enough data to do it, and it should tell us what we want to know either way.
There’s also this problem, which might help rescue us from that first one.
This study has a number of limitations. Firstly, SGTF infections were only identifiable using the TaqPath PCR and only for specimens with high viral loads (Ct≤30) and therefore the number of SGTF infections is underestimated and biased towards geographic regions where this assay was more commonly used.
If the sample for non-SGTF includes non-differentiated data, that could muddy the waters.
This is from the discussion section:
When compared to non-SGTF infections, we found that SGTF infections had an 80% lower odds being admitted to hospital, but did not differ in the risk of severe disease among hospitalised individuals. When compared to Delta infections, SGTF infections were associated with a 70% lower odds of severe disease.
If severe disease risk among the hospitalized was the same, I’m not sure why the 80% becomes 70%? Are some severe cases not getting hospitalized? I’ve seen the theory that this is about differences in sample differentiation.
This seems like a good data point:
Our findings correlate with DATCOV surveillance hospitalisation data showing that, among patients who had a known hospital outcome, 32% of COVID-19 admissions during the early fourth wave were severe compared to 65% during the early third wave.
Meanwhile, let’s see how things are going around these parts. First, cases and deaths, with USA on for comparison. I’ll list the whole pandemic here for context.
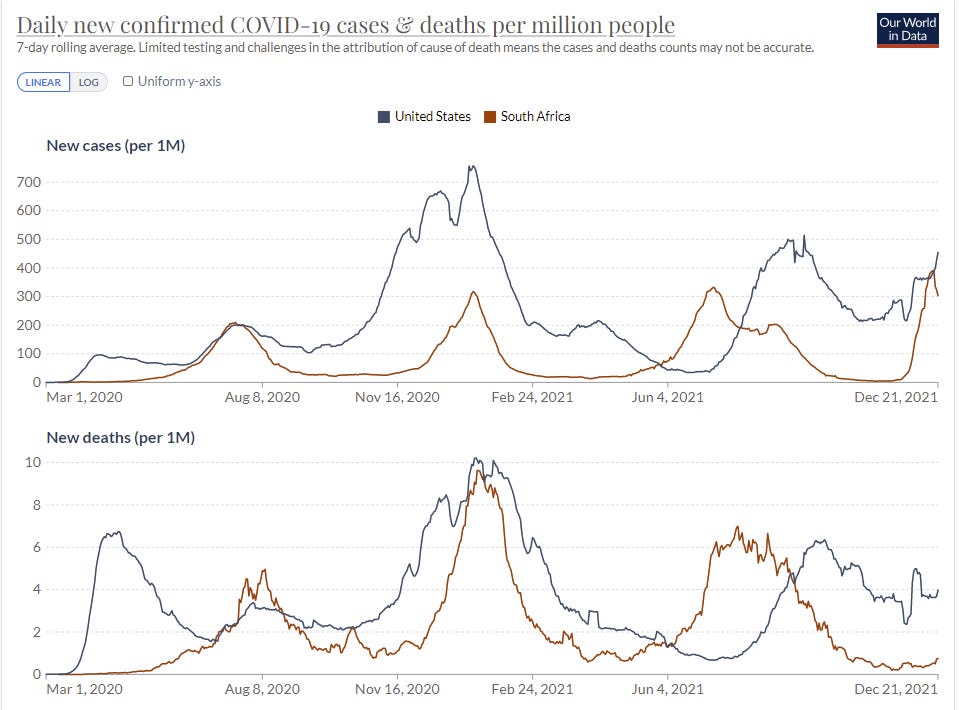
Sure looks like we’re past the peak, and the peak was remarkably low there, so low that it doesn’t make sense. Why would behaviors adjust this much this fast for so few cases, which were on average much milder? With almost no deaths, although it’s too early too expect that many yet? I don’t believe that happened.
Now hospital admissions.
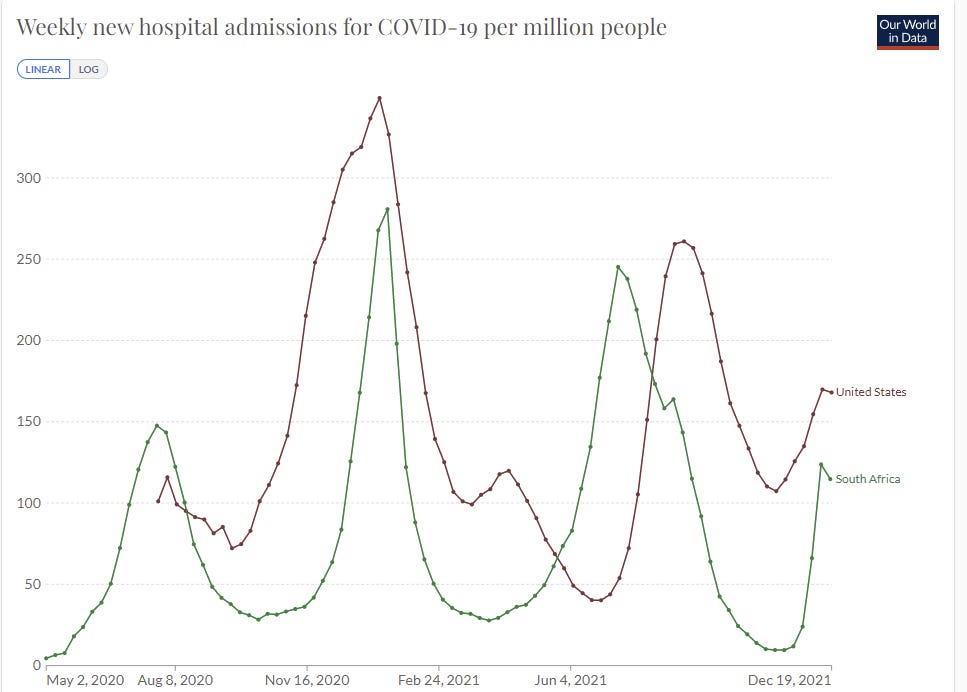
The hospitalization rate in the Delta wave is higher than in the late 2020 wave, but Delta is more virulent, so that makes sense but doesn’t tell us much. And the current wave we know doesn’t tell us much. So we’ll have to zoom in, and compare the start of the Delta wave to the end of the Delta wave and after it in times that still proceed Omicron, to see if there’s a big difference. If time is a big factor, we should expect a big difference.
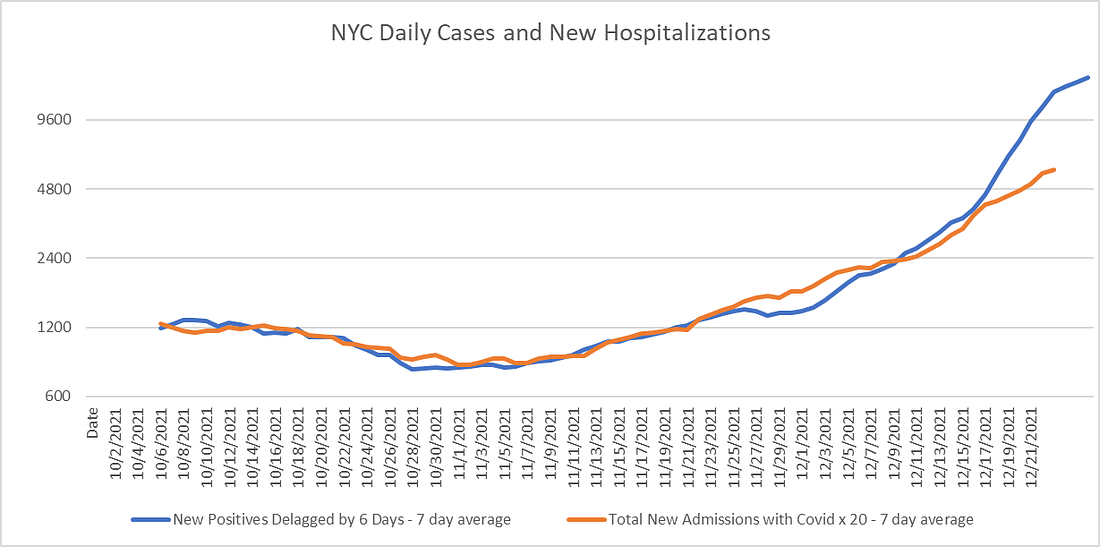
I had a research assistant I’m trying out (fingers crossed!) assemble a graph for me, using six days of lag:
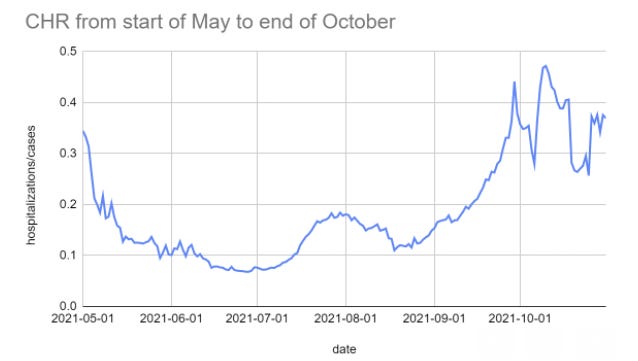
I consider this graph completely inconsistent with the theory that CHR was already decreasing a lot over time, so unless I’m missing something here (speed premium makes this very possible) I don’t think this is a serious problem.
That still leaves the problem that the effect is too large. We have too many other data points for an 80% effect to make sense as a general answer. Perhaps South African conditions are importantly different, and as usual perhaps controls were insufficient or we’re missing something else. Still, I count this as a pretty strong data point in favor of milder Omicron.
Here’s Kai’s take, which is largely a shrug emoji on the question of inherently milder.
United Kingdom
Commenters from the United Kingdom and especially London report dramatic changes in behavior. London is reported to be a ghost town ahead of Christmas. One of the few things happening are vaccinations, which are way up.
That could potentially explain why cases no longer seem to be continuously doubling at the previous speed. For a second it looked like they might have even stopped going up, but it seems clear that was at least premature.
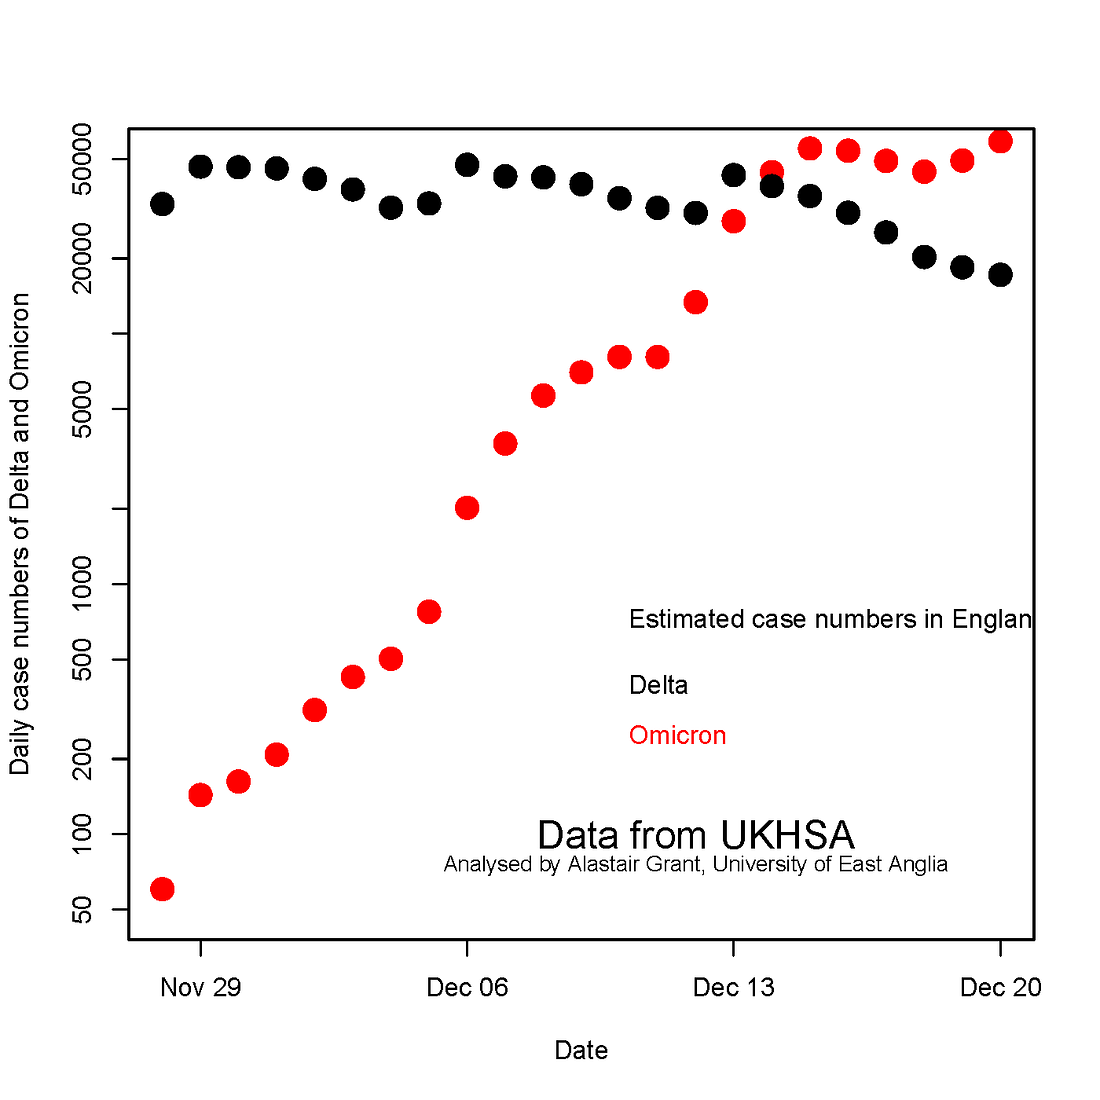
Here’s where cases are currently growing (link to data).
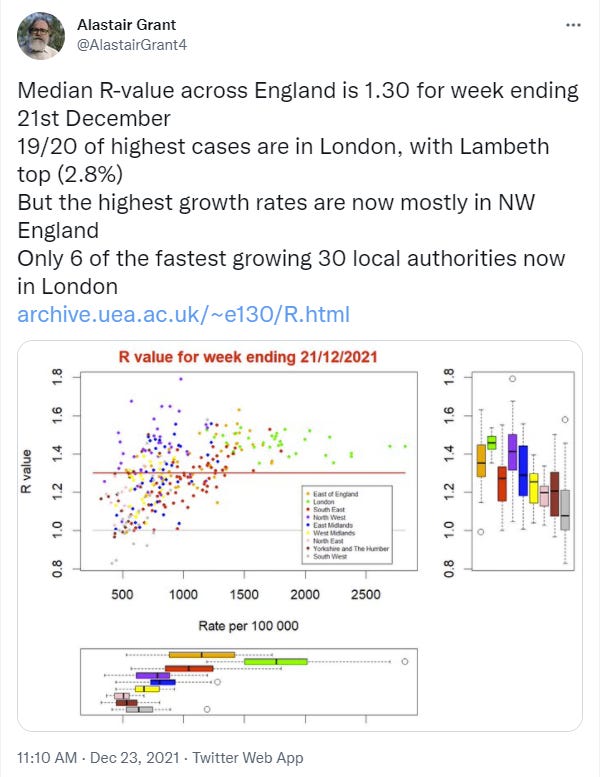
By this calculation cases are still growing everywhere, but no longer growing at the same pace (in log terms) as they were before, which will ‘flatten the curve’ a bit if nothing else. London no longer looks unique other than for its absolute case level, presumably because they did more adjusting and/or ran out of testing capacity.
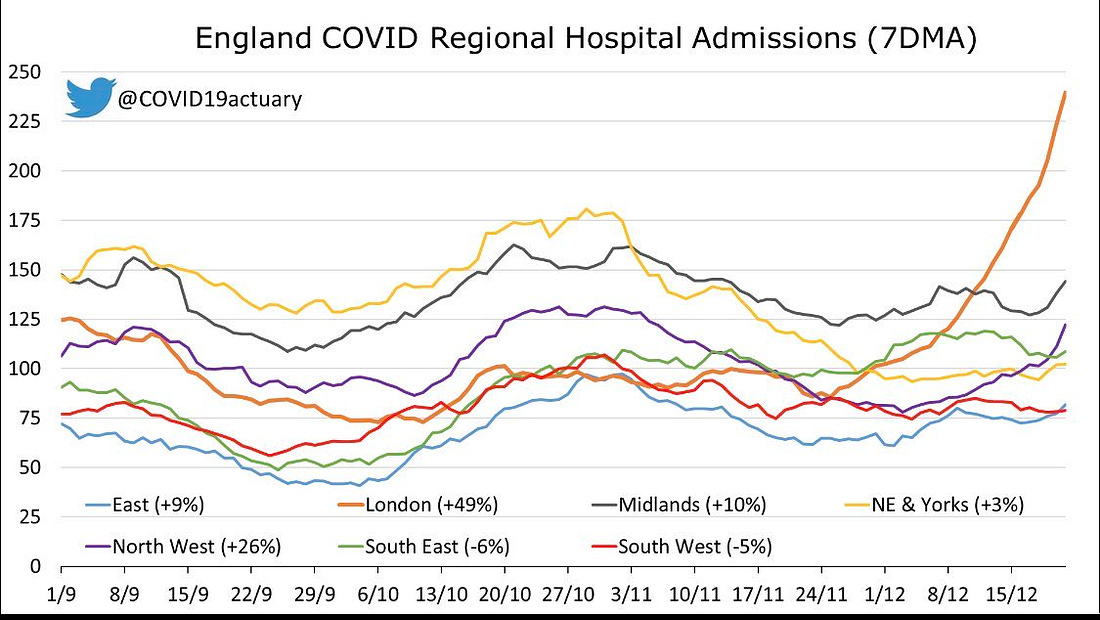
The official recommendation says reduced likelihood of infection (same source), but the details say it may involve prior infection so they’re not claiming anything interesting there. That checks with the typical conservatism of such statements, where it’s more important (in the eyes of those making them) to not be wrong than it is to be helpful. They’re not even saying it’s clear that Omicron is more transmissible than Delta aside from immune evasion, which doesn’t seem plausible at this point.
This graph is new and interesting:
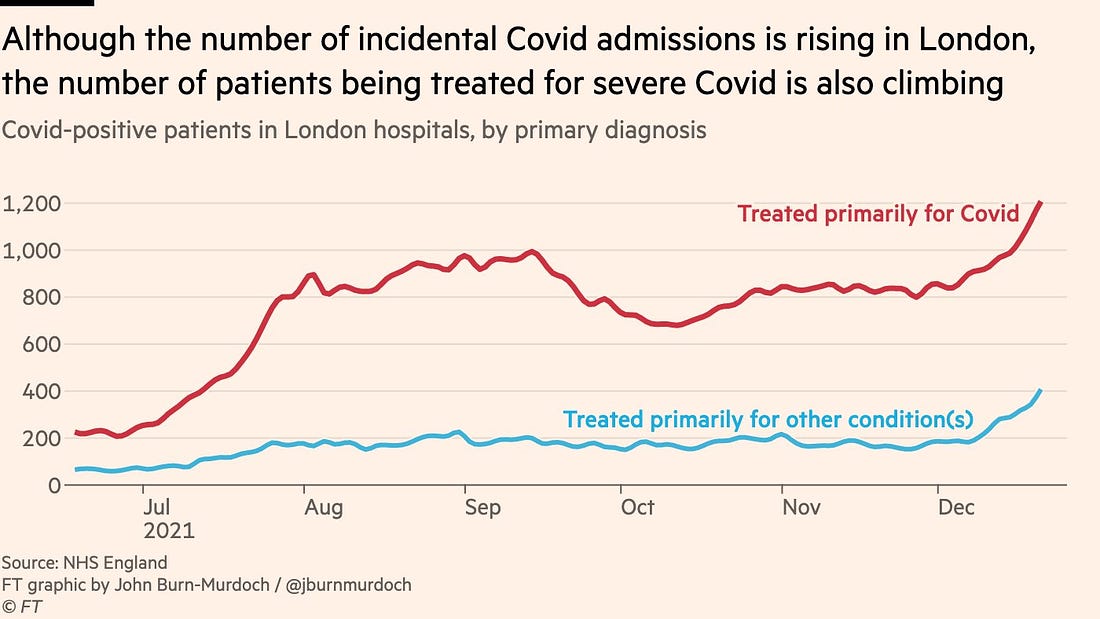
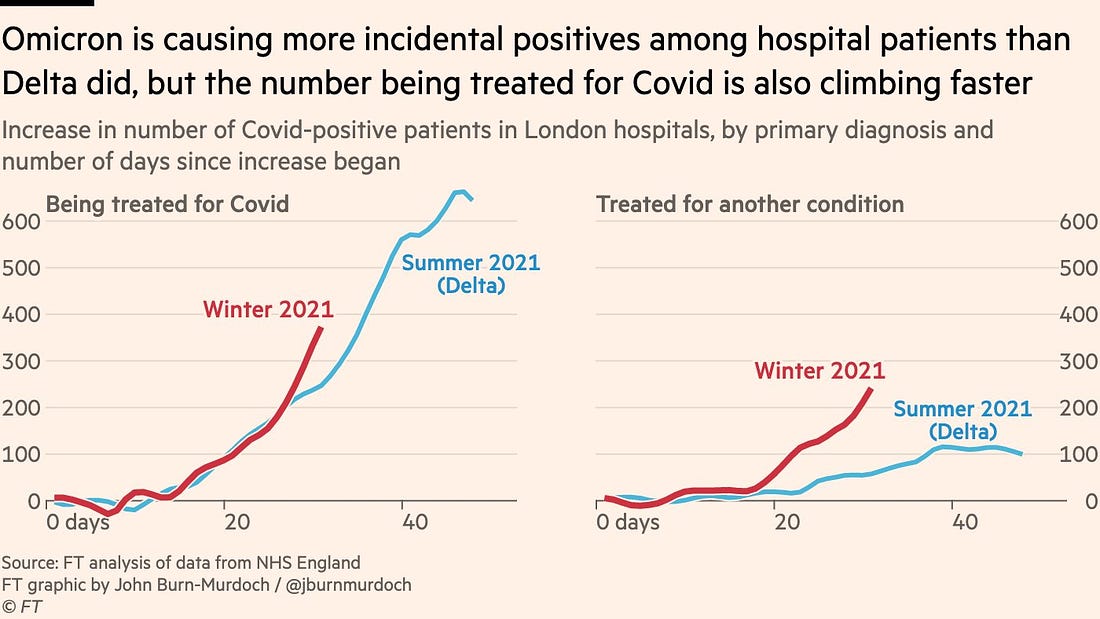

Need to keep all that in context, and we might be telling a different story by next week.
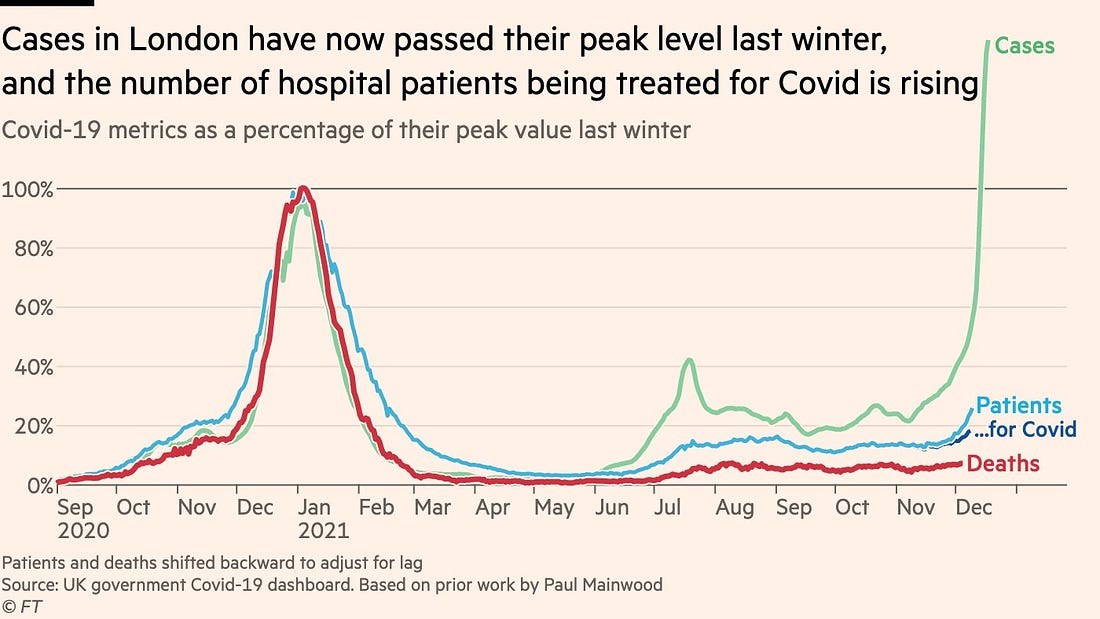
In any case, it’s mostly Omicron at this point, and soon it will be almost all.
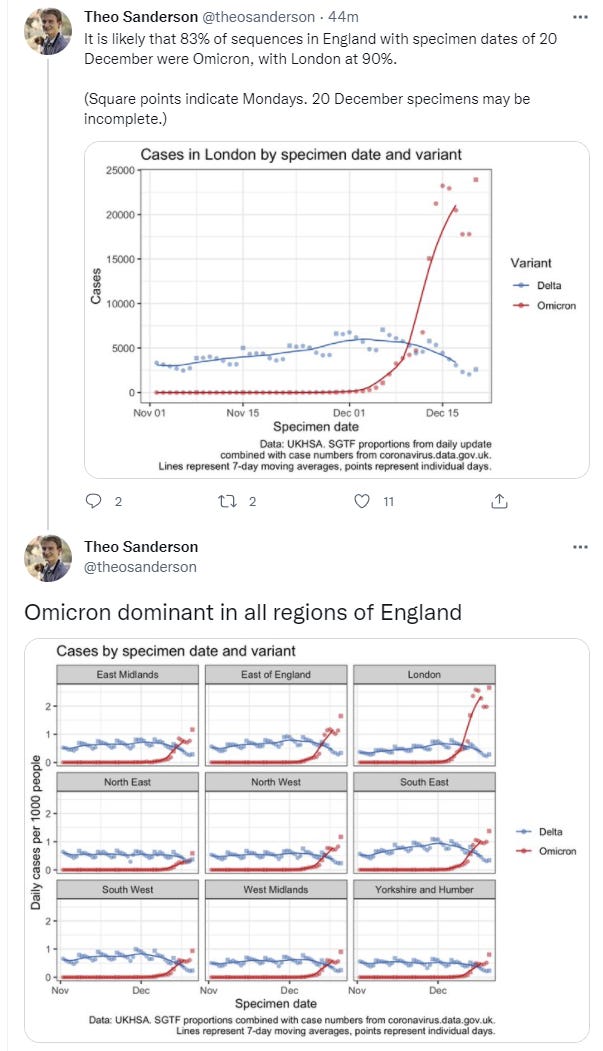
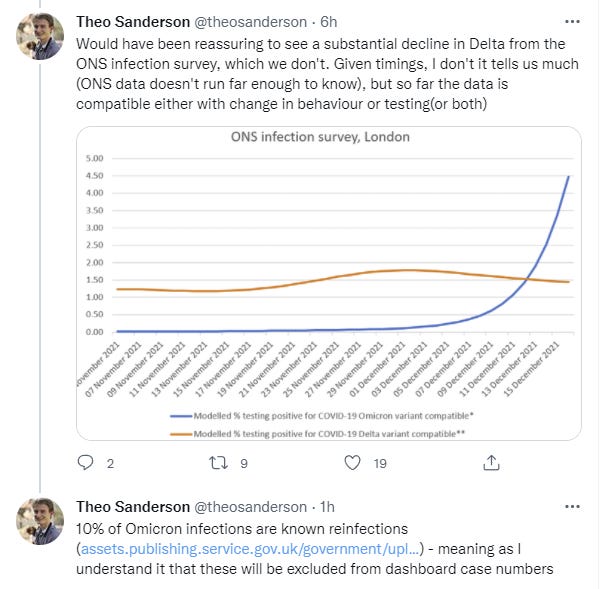
We’re not seeing much decline in Delta though, which is scary.

Denmark
Age data for hospitalizations in Denmark, the pairs of bars are weeks of the year ending with Week 50 of 52.
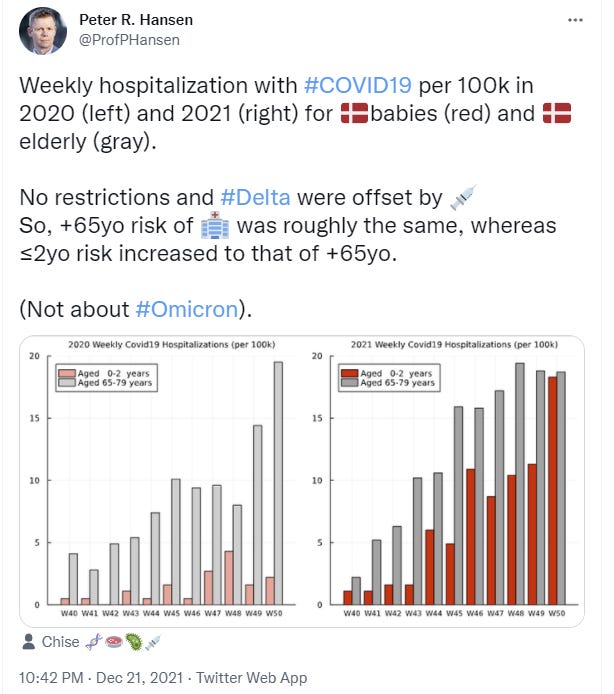

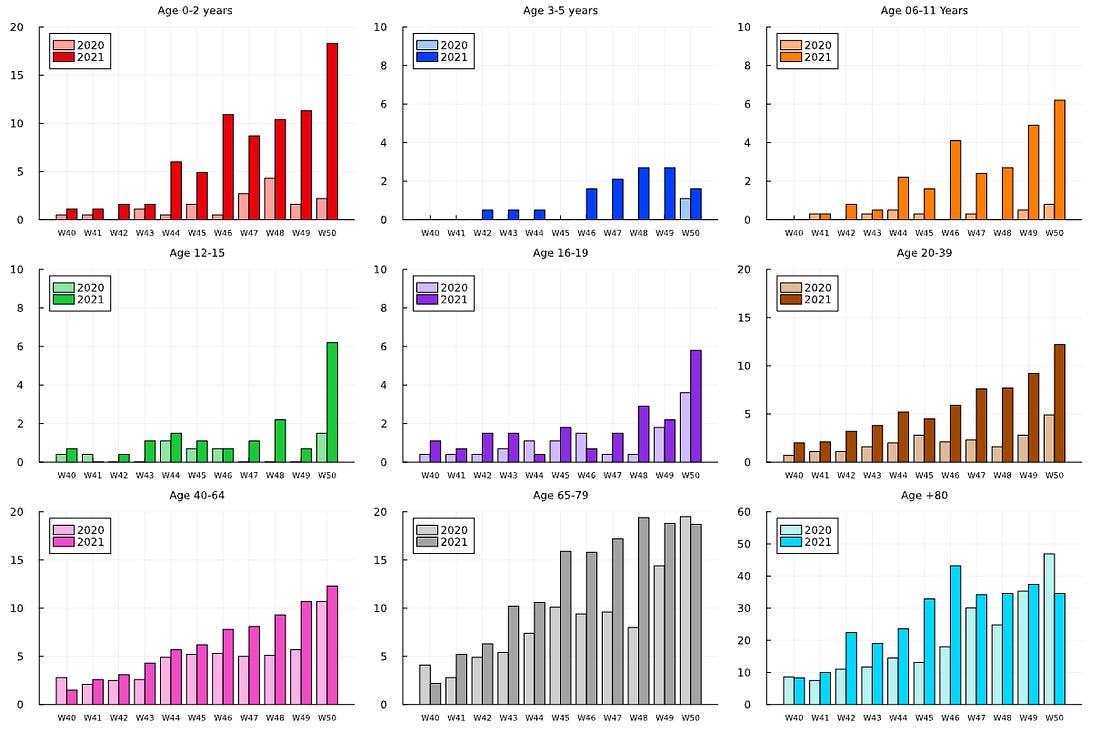
We’re seeing a large spike in cases in the 0-2 and 12-19 age groups, some growth in 6-11 and 20-30, a little in 50-64, and none in 65+.
Note that the graphs do not all use the same scale, so this doesn’t mean older people aren’t still at higher risk. That’s still about a 35 at the end, with no other group above 20. But the difference has shrunk quite a bit, which likely has a lot to do with who is getting infected.
My guess he’s right that this is about things being different in cities, but I don’t know Demark well enough to be sure.
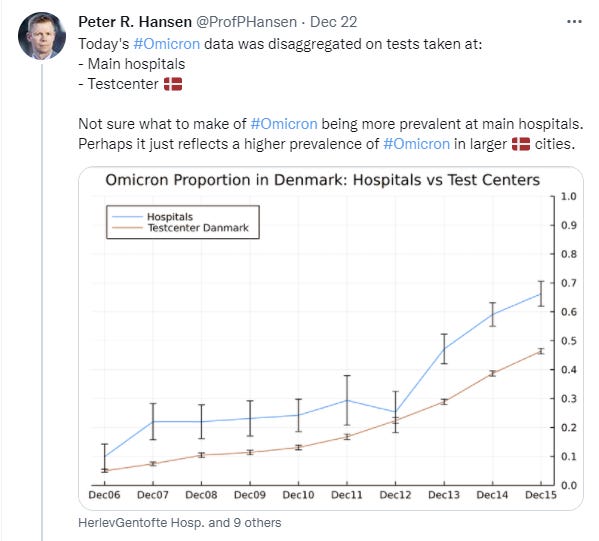
Note that this ends on December 15, so Omicron by now is almost all of the cases.
Case counts no longer seem to be doubling as rapidly, but they are still going up, and it’s likely we are starting to run into testing capacity constraints. Denmark has great testing but the number of cases is super high.
Around the World
China still plans to host the Olympics as far as we know, and that doesn’t seem like a great plan if they intend to go for suppression?

Canceling or delaying the Olympics to prevent a seeding event only if China makes it to February still going for suppression, which I find unlikely. I also don’t find it that likely that there’s going to be willingness to proceed in early February in any case, but perhaps we’ll be at full The Show Must Go On by then.
Anecdotally, I keep finding people saying ‘a bunch of people I know are sick, and that’s never happened before in the pandemic at once.’ Several of my commenters said it. My friend Spenser Greenberg said it on Twitter. Both my kids’ schools had a case. A coworker has a case. No one in my family tested positive, and whatever we had stayed mild, but I still have my suspicions.
The president and vice president each had a close contact.
I would describe myself as COVID-cautious at the moment, but I don’t think of it as competition to show virtue. I just notice that in the worst weeks of the past two years, the number of people that I personally knew with COVID never exceeded more than one per week, and the number was typically zero. Now all of a sudden, I know a dozen. They are not in the hospital, and they probably are not going to die, but they don’t seem particularly happy.
If you are not on the East Coast, you may not know what I’m talking about. Yet. But things are absolutely crazy here.
They also cancelled SNL, sending all but a few people home and throwing together a clip show. Resulting show wasn’t bad, they chose good clips and featured Tina Fey. The experiment with Weekend Update both showed that she’s still the GOAT, and how much the jokes there depend upon the background graphics that weren’t available this time.
Severity
Guardian piece from 21 December pointing out we don’t know severity yet.
Natalie Dean reads the Imperial College London paper (paper). As I understand her reading, the paper is suggesting a modest reduction in severity, and also giving estimates for the reduction for reinfections and vaccinations, which seem strangely low.
Now for my reading, here are the parts that seem important. First, what they controlled for is always important, note that prior infection isn’t included which is always a mess with Omicron.
We used stratified conditional Poisson regression to predict hospitalisation status, with demographic strata defined by age, sex, ethnicity, region, specimen date, index of multiple deprivation and in some analyses, vaccination status. Predictor variables were variant (Omicron or Delta), reinfection status and vaccination status.
Then the headline finding.
Overall, we find evidence of a reduction in the risk of hospitalisation for Omicron relative to Delta infections, averaging over all casesin the study period. The extent of reduction is sensitive to the inclusion criteria used for cases and hospitalisation, being in the range 20-25% when using any attendance at hospital as the endpoint, and 40-45% when using hospitalisation lasting 1 day or longer or hospitalisations with the ECDS discharge field recorded as “admitted” as the endpoint (Table 1). These reductions must be balanced against the larger risk of infection with Omicron, due to the reduction in protection provided by both vaccination and natural infection. A previous infection reduces the risk of any hospitalisation by approximately 50% (Table 2) and the risk of a hospital stay of 1+ days by 61% (95%CI:55-65%) (before adjustments for under ascertainment of reinfections).
A full admission of a day or longer seems like the more important data point than who sets foot in the room, so I’m going to file this as 40%. The reduction for previous infection is only 60% here, which is probably because so many such infections are entirely asymptomatic and missed. In any case, it suggests an upper bound for how much ‘but they already had it’ can explain in terms of reduced hospitalizations. If every South African already had Covid-19, but admissions conditional on infection are still down 80% as noted above, that’s still half the cases of a 60% reduction.
I don’t feel confident about the way they’re making adjustments and don’t have time to look closer, but this is another data point in favor of a modest reduction in severity after adjusting for everything, and for Omicron being similar to the original Covid-19 in severity, as opposed to either being similar to Delta, or it being substantially milder than the original Covid-19.
Interpretations vary, largely on the basis of what kind of mild counts as mild, versus what counts as about the same, and which numbers are worth looking at. E.g. if you look at ‘any hospital trip’ and think that’s the number that counts you get 20% instead of 40%:

Deepti has a long thread there.
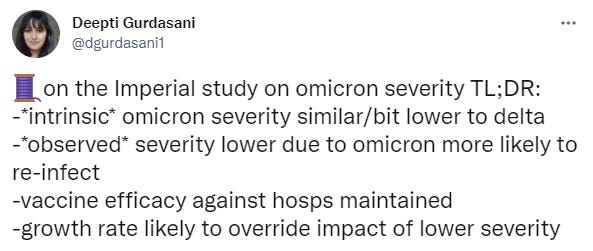
Her core message is that exponential growth will matter more than the severity reductions if allowed to continue. And of course, that’s very right. The right message to send depends on what the listener already knows, and what they need to learn.
There’s also data out of New South Wales in Australia, which lets us study Omicron in a population with a known vaccination rate and almost no previous cases.
Note in this thread he says CFR when he means CHR (case hospitalization rate).
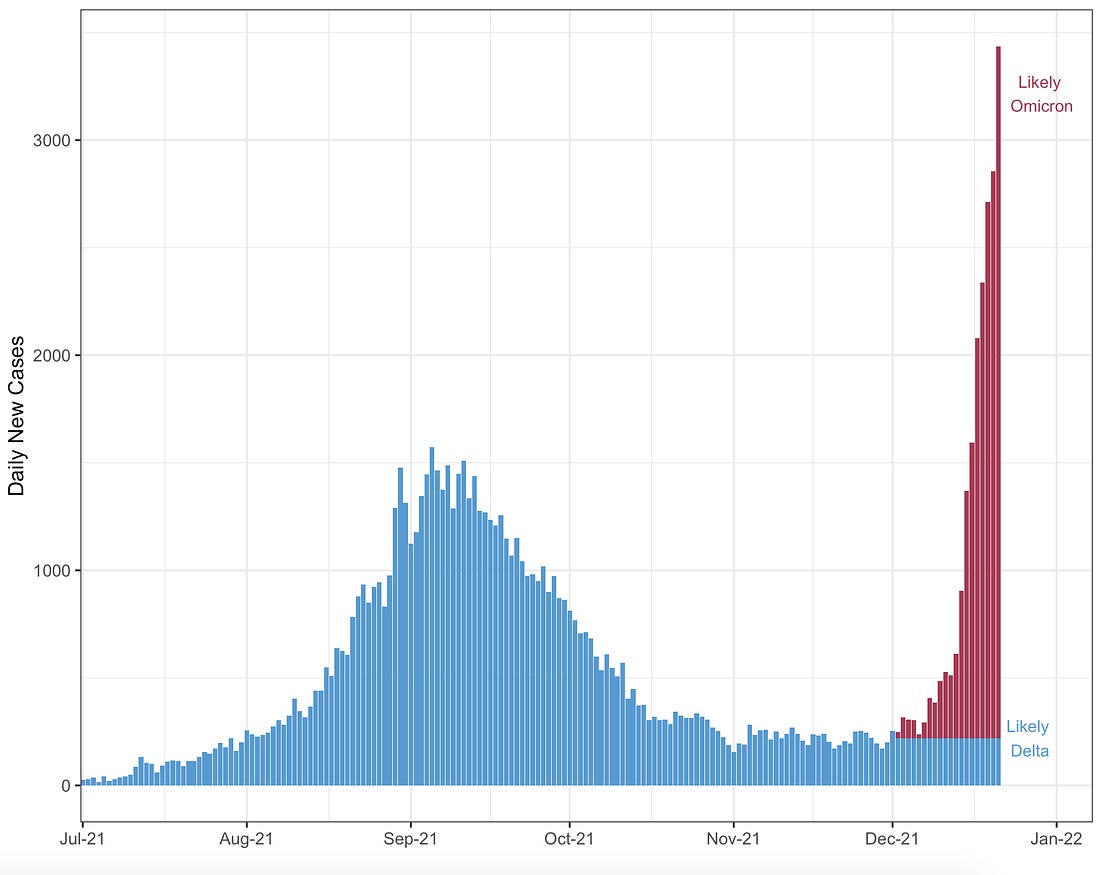
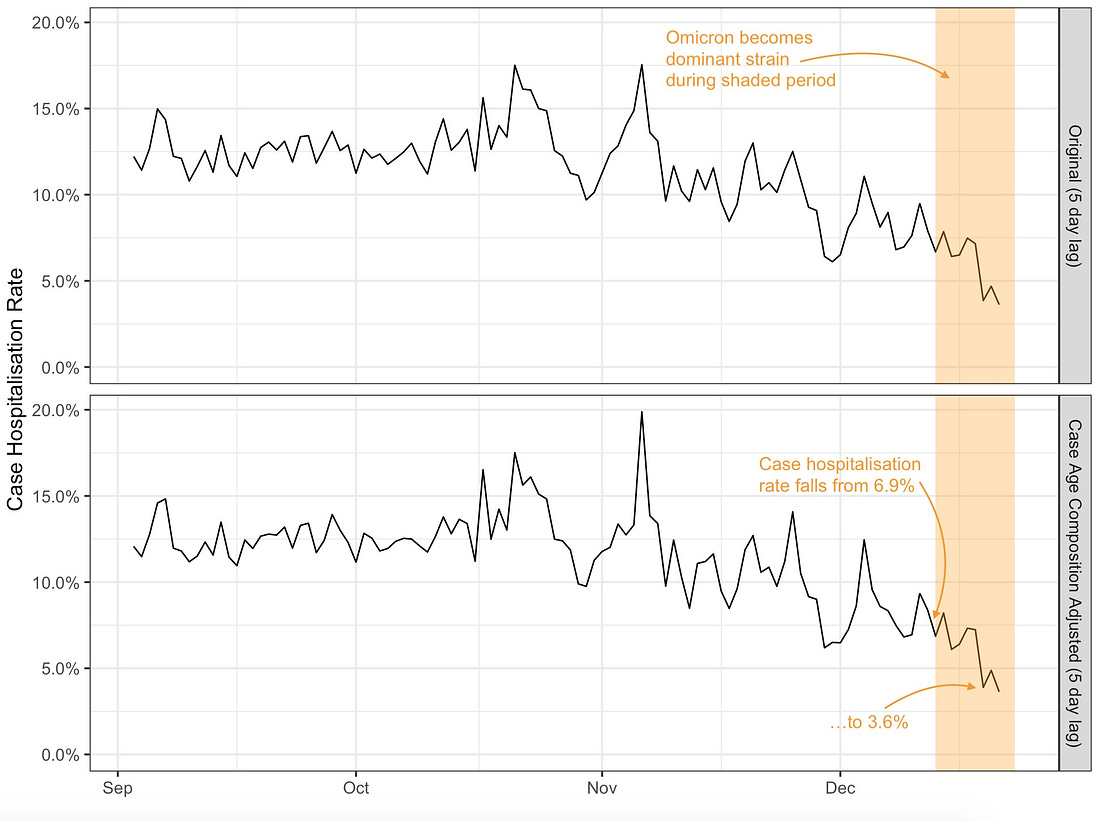

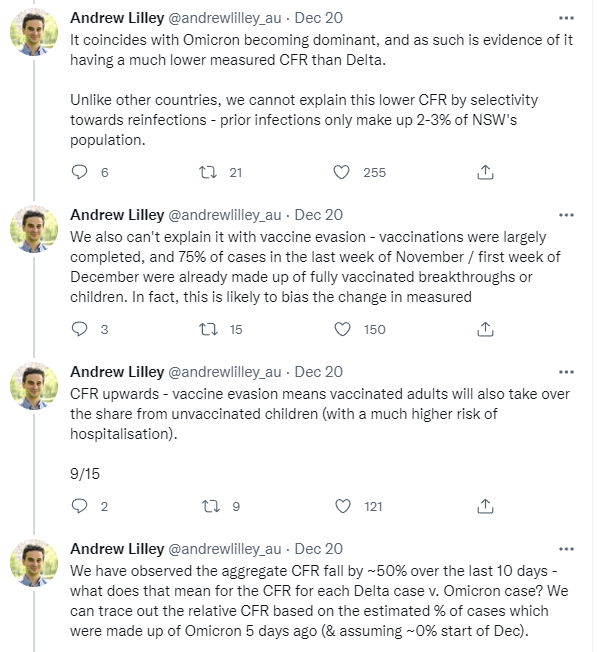
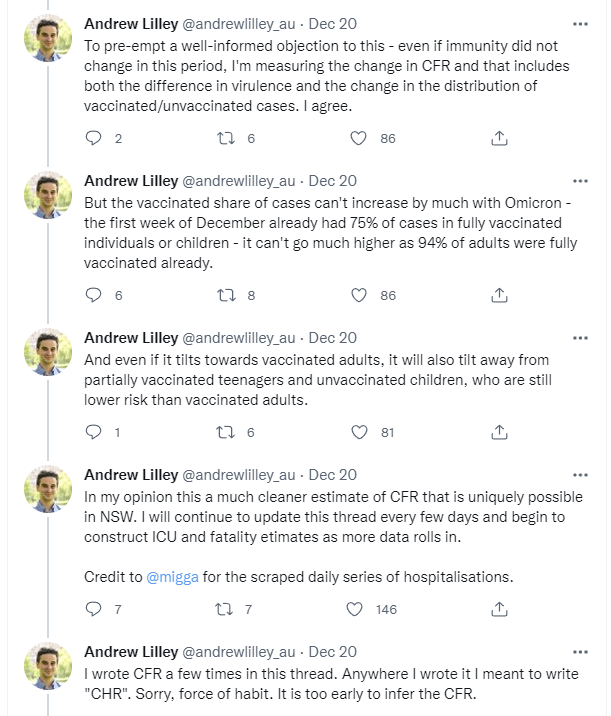
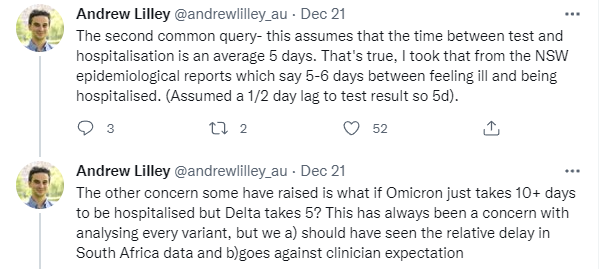
The argument thus goes like this. 75% of cases were already breakthrough infections, so that can’t go up much more than that, and can’t have much of an effect, as only 77% of the population is vaccinated. The change in composition there can’t possibly explain much of the drop from 6.9% to 3.6%. It’s also age adjusted, which takes the last big factor out of play.
I can’t verify from what I see that this properly covers the ‘not recorded as hospitalized yet’ factor, but assuming it does, this seems very robust to me, and represents a 45% drop in the hospitalization rate versus Delta, on the high end of the range of previous-to-the-update plausible answers. That’s a very close to the Imperial College result of 40%. Once again, we have a modest reduction that will help a lot, but won’t on its own save us from the grains of rice on the chessboard.
Then there’s the University of Edinburgh, with an analysis out of Scotland.
Here’s their methodology.
Using the Scotland-wide Early Pandemic Evaluation and Enhanced Surveillance of COVID19 (EAVE II) platform, which comprises of linked primary care, vaccination, reverse transcriptase polymerase chain reaction (RT-PCR), sequencing, hospitalisation and mortality data on 5.4 million (99% of the population), we undertook a cohort analysis with a nested test negative design incident case control study covering the period November 1 to December 19, 2021 to provide initial estimates of Omicron severity and vaccine effectiveness (VE) against symptomatic disease. We used S gene status as a surrogate for Delta and Omicron VOCs, with S gene positive status indicating Delta whereas S gene negative indicated Omicron. Cox proportional hazard models were used to estimate the risk of COVID-19 hospitalisation adjusted for age, sex, socioeconomic status, vaccination status and clinical risk factors. Generalised additive logistic regression modelling with spline terms for age and sex were used to estimate VE relative to ≥25 weeks post second vaccine dose.
Sample size is very large here. Their findings.
Findings
The first case of Omicron confirmed by viral sequencing was recorded in Scotland on November 23, 2021, By December 19, 2021, there were 23,840 S gene negative cases. These S gene negative cases were predominantly in the age group 20-39 (11,732; 49.2%). The proportion of S gene negative cases that were possible reinfections was more than 10 times that of S gene positive (7.6%
versus 0.7%). There were 15 hospital admissions in those S gene negative giving an adjusted observed/expected ratio of 0.32 (95% CI 0.19, 0.52). The third/booster vaccine dose was associated with a 57% (95% CI 55, 60) reduction in the risk of symptomatic S gene negative symptomatic infection relative to ≥25 weeks post second dose.
As a sanity check, they think the population with the s-gene deletion (Omicron infections) were expected to have about half as many admissions to the hospital, and instead they found only one sixth as many.
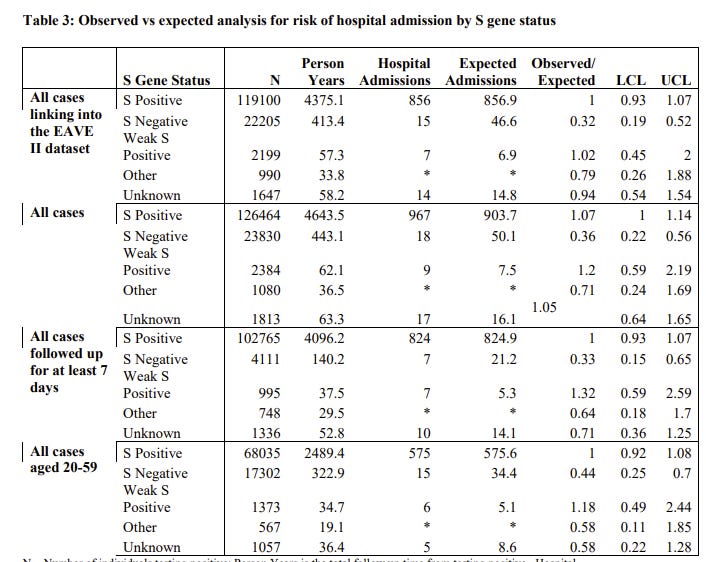
I definitely worry here that both they didn’t properly account for time lags (I don’t have enough time to be careful about this here right now), and that they failed to adjust for previous infection properly, but again that effect doesn’t seem like it can be big enough? So if we assume they’re missing some adjustment, we get that same result again.
Nate Silver attempts to reason from a price change (link to the Science post, which indeed is good at setting tone but also includes such insanity as ‘getting firm answers from the lab may take until Easter’).
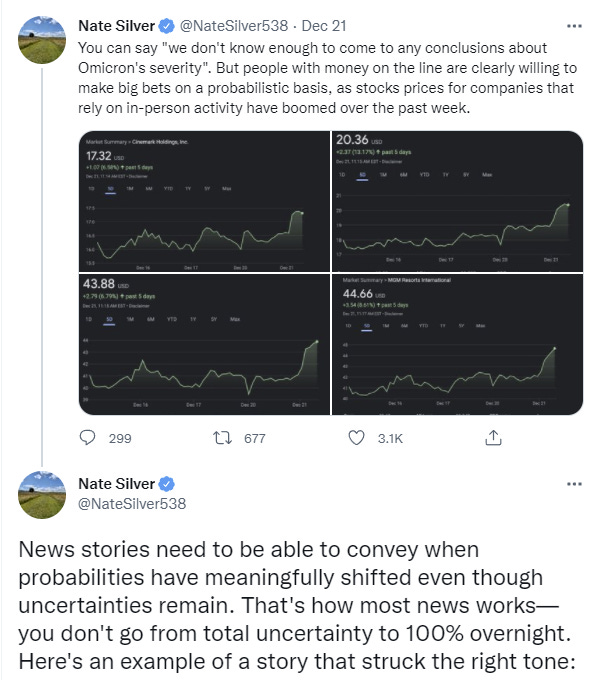
In 2019 I would have bought the ‘people with money are saying’ argument, and in 2014 I might have thought it was this easy to associate the price change with what the market was thinking. I no longer think these things, nor is it that obvious why severity of Omicron (in terms of the range of 50% vs. 100% of Delta) should have that much impact on such stocks if you’re thinking long term.
Severity Synthesis
This is Natalie Dean’s guide to how to think about severity calculations, good stuff.
South Africa: 80% reduction in severity in the study, clear huge falloff in severity observed in practice, alternative explanations seem unlikely and their magnitudes contained. Testing is presumably inadequate in South Africa but they test when you enter the hospital, and that’s going to make it weird.
Imperial College: 40% reduction in hospitalization after adjustments if you count full stays, potential failure to account for all reinfections, but also missing unidentified cases as always.
University of Edinburgh: 65% reduction in hospitalization, likely didn’t fully account for missed reinfections (of course, also doesn’t properly account for asymptomatic infection rate this time around, either).
New South Wales: 45% reduction in hospitalization after adjustments, few prior infections so less unknowns.
Also, there was a study with 24 Omicron hospitalizations from earlier, and a bunch of other stuff.
So what do we get?
I see a consistent story of a modest reduction in severity, as measured by hospitalization risk conditional upon getting a positive test.
On top of that, there’s going to be some additional severity advantage based on a better chance to have a fully asymptomatic case and not even notice you’re sick, or know you’re sick but not get to the point you’re reporting a positive test.
Against that, I continue to worry about making the right adjustments for past infections, and I worry about everything happening too fast and the Omicron cases not having had enough time to get all the data in.
On top of that, in terms of problems per case, we get a big discount for having so many reinfections and breakthroughs, which will vary from place to place, but should at least cut things in half again. On a personal level, if you’re boosted, you get a lot more than that.
And of course, for as long as the health care system and hospitals hold up (although it’s already touch and go in places, and testing is definitely failing a lot) we’re a lot better at treating Covid than we used to be, so we should expect another advantage there.
None of this means all these studies couldn’t be making similar methodological mistakes, and missing the same necessary adjustments. That’s a real issue, there are lots of adjustments that could easily be quite a bit off. The whole thing is super complicated. Uncertainty should reign.
And of course, you can cut risk by half twice and have that get overwhelmed very easily if cases keep doubling, with everyone getting infected at once. But that’s also a worst-case scenario, an upper bound, and the chessboard ends. Would that upper bound royally suck? Oh yeah. Very much so. That’s still several hundred thousand deaths in America alone.
But, you know, it could be a lot worse.
Threads
21 December thread on situation in New York, which could turn ugly quickly.
Thread on what to do about positive tests, in which author notes that people are blowing up his phone about this. I only see so much increase in the official statistics for case counts, but I keep seeing these anecdotes, the real increase is much bigger.
Other
Novavax’s vaccine looks like it holds up very well against Omicron. It’s a real shame we never approved it.
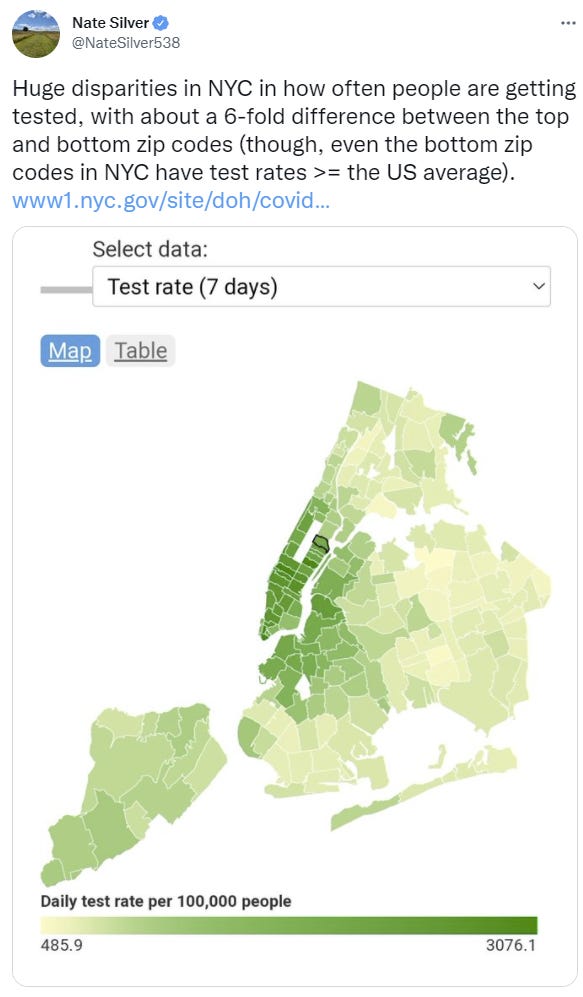
Huge differences in testing rates depending on where you are in NYC. There’s indeed a lot more testing here, but there’s also a stupidly large amount of positive results of those tests, far more than the official numbers would indicate based on various anecdotal observations, as noted earlier – and since I wrote that, the list got longer.
Not that many hospitalizations, yet. But it’s coming. If after a week it doesn’t, that would be the other best possible news (in post #11, presumably).
Cause this is understating it, there’s some graphs at the link that locals may want to check out.

A lab worker got infected in Taiwan, and it seems they were bitten by a lab mouse. Draw your own conclusions. Bonus round, does this additional information the situation seem better or worse?

A theory that Omicron survives longer in the air than Delta [LW(p) · GW(p)], and that’s a lot of why it is more infectious.
The return of the Bad Reviews for Yankee Candles Index.



I agree that these words from Kelsey Piper are indeed wise. Here’s a link to her article about what to do if you get sick, and preparing for it to happen.
A note from a reader, on airports, that seems exactly right: It’s the constricted spaces that create the most risk, and we’re making little effort to increase throughput so that the lines would go away, despite it not taking much (if the traffic jam doesn’t back up continuously, and no one can leave since it’s an airport, it wouldn’t take much to clear the jam entirely):
I just flew home from Canada. The longest lines in the most constricted spaces were, predictably, customs and security. In both cases, there were facilities (scanners, customs booths) going unused. Adequate staffing would have eliminated the delays and reduced exposure. In the best case, it would have meant that some staff wouldn’t have been busy all the time, and there would have been no delays at all. That might have required 10% more staff, in a low-cost portion of the overall operation.
I keep forgetting to point this out, but yes, any and all quarantines between countries, any and all travel restrictions, are pointless by now unless you’re actively containing Omicron. Trying to contain who can come into the UK doesn’t make any sense whatsoever.

Predictions Update
Chance that Omicron has a 100% or bigger transmission advantage in practice versus Delta: 85% → 70%.
The generation time evidence opens up the possibility that we could be under this threshold, and the lack of full doublings is suggestive too. I still think we end up somewhat over it, but it would now surprise me a lot less. I would still be very surprised by there not being a substantial advantage anyway (50%+) on top of immune evasion.
Note that while this looks like me being less confident, that’s because my estimation is now closer to the 100% line, even though my error bars have shrunk. It’s not that I am more confused, it’s that I happened (mostly by coincidence) to set a good line.
Chance that Omicron is importantly (25%+ in the same person) more virulent than Delta: 3% → 2% (will delist this unless it goes back to 3% or more).
Chance that Omicron is importantly (25%+ in the same person) less virulent than Delta: 50% → 75%.
Chance that Omicron is vastly (75%+ in the same person)less virulent than Delta: %? → 15%.
Importantly is vague so I’m putting a number here, which I should have done before. That was a reflection of me being actually confused what ‘important’ meant. Now, I’m going to decide it’s this, and add a ‘vastly’ for a much bigger reduction.
My hunch is strongly that we’re looking at something like a 30%-60% reduction here, but there’s so many variables here and all the errors are potentially correlated. I’m not actually ready to declare the puzzle solved or anything. Still, it all adds up. The 15% is basically ‘the South African data is right and everything is great, happy new year’ scenario, and no matter how many adjustments people make I can’t dismiss it while few if any people anywhere are dropping dead.
Will the CDC label Omicron a variant of high consequence before 2022? 9% → 5%.
Look, no, they’re not going to do this at this point, it’s Christmas, everyone is going home, and I hadn’t adjusted enough for that before, the 9% at Polymarket is basically free money. I mean, anything’s possible, they did Paxlovid without much warning, but this seems so unlikely to happen in the next week.
Chance we will be getting boosters modified for Omicron within 6 months of our previous booster shot: 30% → 25%.
Things look less like a crisis, so it’s less likely they’ll push these on us, but if they make them I can totally see us trying to get people to take them anyway. Not giving much thought to this one recently, in any case, and my head’s spinning from all the things.
Chance we are broadly looking at a future crisis situation with widely overwhelmed American hospitals, new large American lockdowns and things like that: 30% → 20%.
We’ve seen more and more effective private adjustments, and more continued commitment to not locking down, and a generally good attitude, plus severity looks to be down. We especially haven’t seen European overreactions, and if they’re not gonna do it, we’re not gonna do it either. Then again, crunch time is still in the future.
Generation time (serial interval) of Omicron is 3.5 days or less: %? → 75%
This explains so much of what we’ve seen and makes so much sense. How else can something doubling every two days get slowed down all that much by private reactions? How could it be peaking so fast? The data from the cases in Norway backs it up. I’d love to see more similar data, which would quickly update me, but this seems important.
11 comments
Comments sorted by top scores.
comment by DominikPeters · 2021-12-23T23:44:46.078Z · LW(p) · GW(p)
Commenters from the United Kingdom and especially London report dramatic changes in behavior. London is reported to be a ghost town ahead of Christmas
To judge local covid behavior, I sometimes look at YouTube videos of walks around various cities, which is a somewhat weird genre but informative. At least in very central London, it looked quite busy yesterday:
comment by sanxiyn · 2021-12-24T01:11:17.374Z · LW(p) · GW(p)
Re: serial interval. This doesn't seem published anywhere yet, even in preprint form, but Korean CDC daily briefing 2021-12-13 already announced shorter serial interval. Their estimate is 2.8~3.4 days. Their sample is larger than Norway, n=123.
https://www.kdca.go.kr/board/board.es?mid=a20501010000&bid=0015&list_no=717925&act=view
It's the fifth section titled Epidemiological Characteristics of Omicron Variant-related Cases.
comment by denkenberger · 2021-12-25T21:06:34.202Z · LW(p) · GW(p)
Sure looks like we’re past the peak [in South Africa], and the peak was remarkably low there, so low that it doesn’t make sense. Why would behaviors adjust this much this fast for so few cases, which were on average much milder?
You can see Google mobility data here at the bottom, and indeed, the response to this wave is much smaller than other waves.
comment by Lukas_Gloor · 2021-12-23T23:41:33.714Z · LW(p) · GW(p)
The person you link to who tweeted about the mouse bite and lab escape in Taiwan also made this tweet, and a bunch of other interesting observations. The situation with lab escape risks is quite scary.
Replies from: gabriel-holmes↑ comment by tkpwaeub (gabriel-holmes) · 2021-12-24T15:55:15.439Z · LW(p) · GW(p)
The fact that it may have or even probably did result from zoonosis from mice doesn't convince me that it had to have come from a lab. There are lots of humans, and lots of mice, and we pretty much live, eat, and poop together.
comment by jimv · 2021-12-24T00:15:05.530Z · LW(p) · GW(p)
We’re not seeing much decline in Delta though, which is scary.
I think this is mostly just a feature of using the ONS data, which is random sampling of people but reports a week lagged.
If you look at the chart by Alastair Grant that you feature at the top of the UK section (with red and black dots), it looks something like a halving (or more) of Delta in the week from 13 Dec to 20 Dec.
That would also be compatible with the story of substantial behaviour change.
comment by Ben Pace (Benito) · 2021-12-24T08:03:09.349Z · LW(p) · GW(p)
My UK experience is Northern Ireland and the ferry to Liverpool, both of which people were very lax about masks. Majority of wait-staff had the masks below the nose, which I would have been very pro about a month ago, but now I'm wearing a P3 thing the whole time that I'm indoors and looking at them a bit skeptically.
comment by Gurkenglas · 2021-12-24T14:22:56.161Z · LW(p) · GW(p)
any and all quarantines between countries, any and all travel restrictions, are pointless by now
Unless there's a new variant that might be discovered before it has spread across all borders!
Replies from: cistranecomment by DreamFlasher · 2022-07-15T15:06:55.367Z · LW(p) · GW(p)
Novavax is approved by now. Is there any updated data regarding protection against different omicron variants?
comment by Annapurna (jorge-velez) · 2021-12-24T01:25:36.291Z · LW(p) · GW(p)
Zvi, are you betting your beliefs on Polymarket?
Have you seen the flip of the record cases market in the last three days?