Analysis of World Records in Speedrunning [LINKPOST]
post by Jsevillamol · 2021-08-04T15:26:35.463Z · LW · GW · 16 commentsContents
  Key points
None
16 comments
[this is a linkpost to Analysis of World Records in Speedrunning]
ETA: a more recent analysis can be found here.
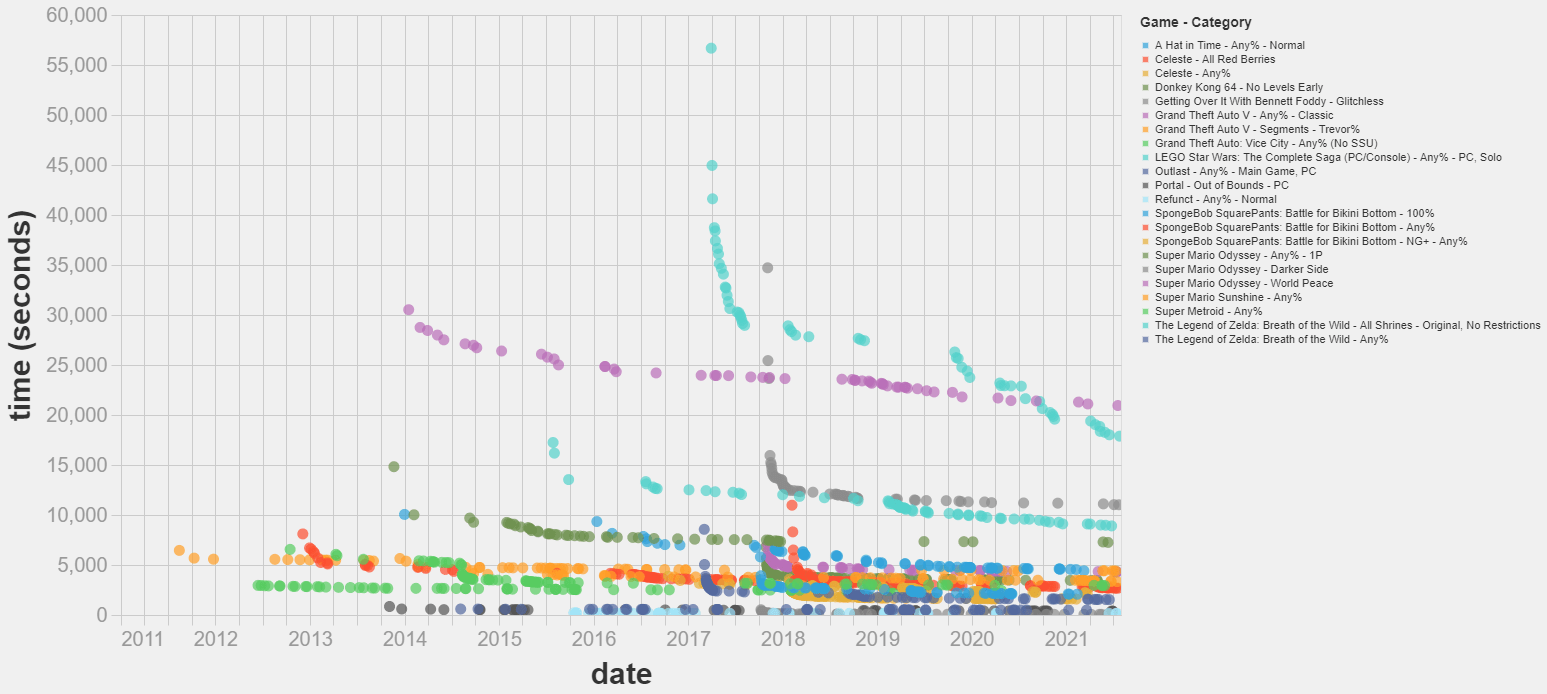
TL;DR: I have scraped a database of World Record improvements for fastest videogame completition for several videogames, noted down some observations about the trends of improvement and attempted to model them with some simple regressions. Reach out if you'd be interested in researching this topic!
Key points
- I argue that researching speedrunning can help us understand scientific discovery, AI alignment and extremal distributions. More.
- I’ve scraped a dataset on world record improvements in videogame speedrunning. It spans 15 games, 22 categories and 1462 runs. More.
- Most world record improvements I studied follow a diminishing returns pattern. Some exhibit successive cascades of improvements, with continuous phases of diminishing returns periodically interrupted by (presumably) sudden discoveries that speed up the rate of progress. More.
- Simple linear extrapolation techniques could not improve on just guessing that the world record will not change in the near future. More.
- Possible next steps include trying different extrapolation techniques, modelling the discontinuities in the data and curating a dataset of World Record improvements in Tool Assisted Speedruns. More.
The script to scrape the data and extrapolate it is available here. A snapshot of the data as of 30/07/2021 is available here.
Feedback on the project would be appreciated. I am specially keen on discussion about:
- Differences and commonalities to expect between speedrunning and technological improvement in different fields.
- Discussion on how to mathematically model the discontinuities in the data.
- Ideas on which techniques to prioritize to extrapolate the observed trends.
16 comments
Comments sorted by top scores.
comment by Isnasene · 2021-08-04T17:25:51.279Z · LW(p) · GW(p)
This is cool! I like speedrunning! There's definitely a connection between speed-running and AI optimization/misalignment (see When Bots Teach Themselves to Cheat, for example). Some specific suggestions:
- Speedrun times have a defined lower bound on the minimization problem (zero seconds). So over an infinite amount of time, the time vs speedrun time plot necessarily converges to a flat line. You can avoid this by converting to an unbounded maximization problem. For example, you might wanna try plotting Speed-Run-Time-on-Game-Release divided by Speed-Run-Time at time t vs time. Some benefits of this include
- Intuitive meaning: This ratio tells you how many optimal speed-runs at time t could be accomplished over the course of a single speed-run at game release
- Partially addresses diminishing returns: Say the game's first speed-run completes the game in 60 seconds and the second speed-run is completes the game at 15 seconds (a 45 second improvement). No matter how much you work at the game, its not possible to reduce the speed-run time by more than the 45 second improvement (at most you can do 15 seconds) so diminishing returns are implied
In contrast, if you look at the ratio, the first speed has a ratio of 1 (60 seconds/60 seconds), the second has a ratio of 4 (60 seconds/15 seconds), and a third one-second speed run has a ratio of 60 (60 seconds/1 second). Between the second and third speed-run, we've gone from a value of 4 to a value of 60 (a 15x increase!). Diminishing returns are no longer inevitable! - Easier to visualize: By normalizing by the initial speed-run time, all games start out with the same value regardless of how long they objectively take. This will allow you to more easily identify similarities between the trends.
- More comparable to tech progress: Since diminishing returns aren't inevitable by construction, this looks more like tech progress where diminishing returns also aren't inevitable by construction. Note that they still can be in practice however
- Instead of plotting absolute dates, you plot time relative to when the first speed-run was registered. That is, set the date of the first speed run to t=0. This should help you identify trends.
- A lot of the games you review indicate that, in many cases, our best speed-run time so far isn't even 3x as faster as the original speed-run. This implies that optimizing speed-run time (or the ratio I introduce above) is bounded and you can't get more than a factor of 3 or 4 in terms of improvement. But obviously tech capabilities have improved by several orders of magnitude. So structurally, I don't think speed-running can be particularly predictive of the tech advances
- Given the above, I suggest that if you want to model speed-runs, you should use functions that expect asymptotes (eg logistic equations). Combinations of logistic equations can probably capture the cascading L curves you notice in your write-up. May also be worth doing some basic analysis like counting the number of inflections in each speed-run (do this by plotting derivatives and counting the number of peaks).
- If you do this, I strongly suggest doing a transformation like the one I suggested above since otherwise, you're probably gonna get diminishing returns right off the bat and logistic equations don't expect this. If you don't transform for whatever reason, try exponential decay.
- Speed-running world records have times that, by definition, must monotonically decrease. So its expected that most of the plots will look like continuous functions. As you're plotting things now, diminishing returns are built-in so you should also expect the derivatives to
Have fun out there!
Replies from: Jsevillamol↑ comment by Jsevillamol · 2021-08-06T12:20:56.068Z · LW(p) · GW(p)
Those are good suggestions!
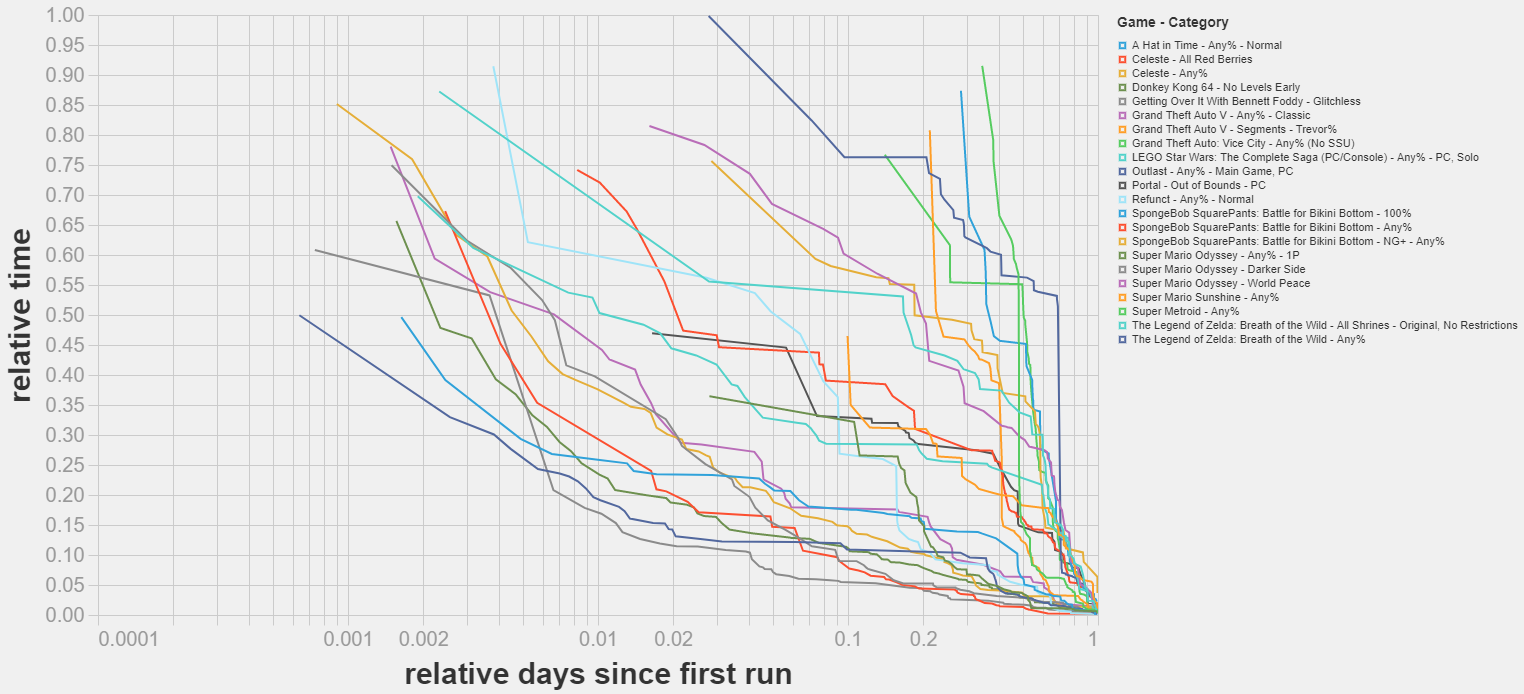
Here is what happens when we align the start dates and plot the improvements relative to the time of the first run.
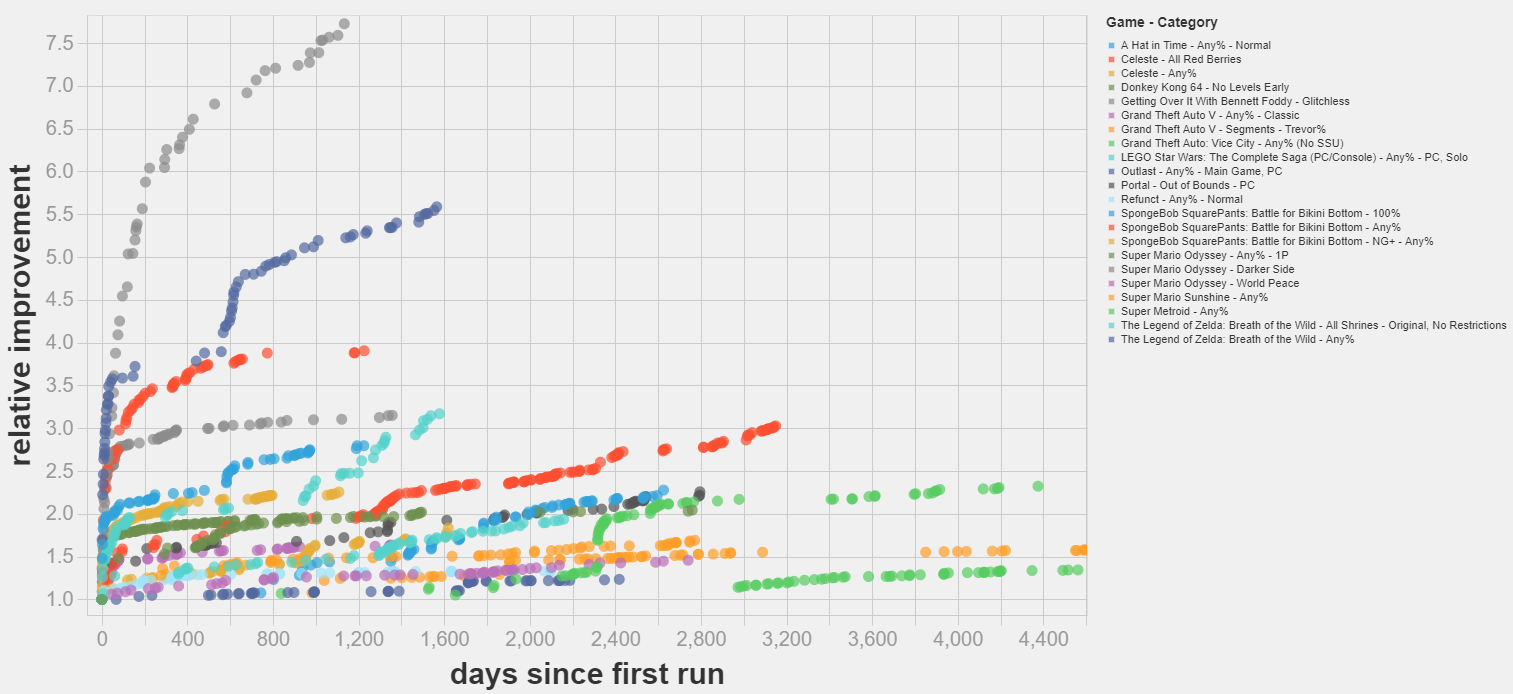
I am slightly nervous about using the first run as the reference, since early data in a category is quite unrealiable and basically reflects the time of the first person to thought to submit a run. But I think it should not create any problems.
Interestingly, plotting the relative improvement reveals some S-curve patterns, with phases of increasing returns followed by phases of diminishing returns.
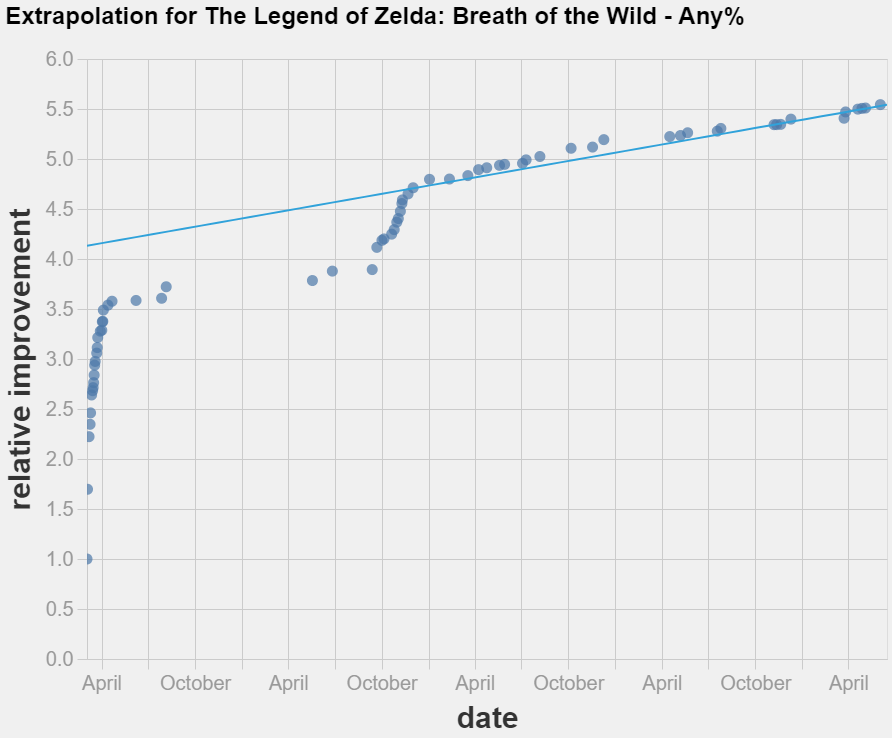
I did not manage either to beat the baseline by extrapolating the relative improvement times. Interestingly, using a grid to count non-improvements as observations made the extrapolation worse, so this time the best fit was achieved with log linear regression over the last 8 weeks of data in each category.
As before, the code to replicate my analysis is available here.
Haven't had time yet to include logistic models or do analysis of the derivative of the improvements - if you feel so inclined feel free to reuse my code to perform the analysis yourself and if you share them here we can comment on the results!
PS: there is a sentence missing an ending in your comment
Replies from: orthonormal↑ comment by orthonormal · 2021-08-08T18:47:19.059Z · LW(p) · GW(p)
Ah yes, the bottle glitch...
comment by Andy Jones (andyljones) · 2021-08-09T12:49:00.562Z · LW(p) · GW(p)
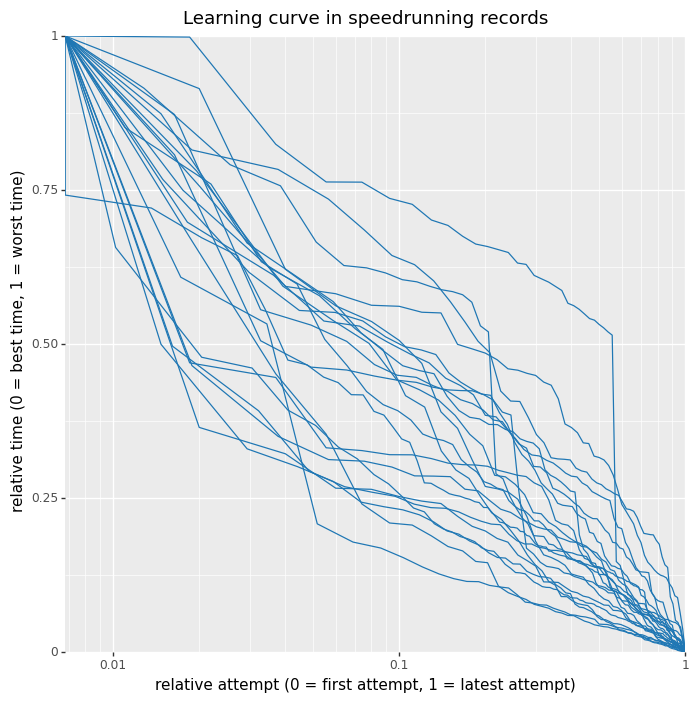
I stuck this on Twitter already, but normalised these shake out to a consistent-ish set of curves
↑ comment by Jsevillamol · 2021-08-10T10:59:28.328Z · LW(p) · GW(p)
This is so cool!
It seems like the learning curves are reasonable close to the diagonal, which means that:
- Given the logarithmic X-axis, it seems like improvements become increasingly harder over time. You need to invest exponentially more time to get a linear improvement.
- The rate of logarithmic improvement is overall relatively constant.
On the other hand, despite all curves being close to the diagonal, they seem to mostly undershoot it. This might imply that the rate of improvement is slighly decreasing over time.
One thing that tripped me from this graph for other readers: the relative attempt is wrt to the amount of WR improvements. That means that if there are 100 WRs, the point with relative attempt = 0.5 is the 50th WR improvement, not the one whose time is closer to the average between the date of the first and last attempt.
So this graph is giving information about "conditional on you putting enough effort to beat the record, by how much should you expect to beat it?" rather than on "conditional on spending X amount of effort on the margin, by how much should you expect to improve the record?".
Here is the plot that would correspond to the other question, where the x axis value is not proportional to the ordinal index of WR improvement but to the date when the WR was submitted.
It shows a far weaker correlation. This suggests that a) the best predictor of new WRs is the amount of runs overall being put into the game and 2) the amount of new WRs around a given time is a good estimate of the amount of runs overall being put into the game.
This has made me update a bit against plotting WR vs time, and in favor of plotting WR vs cumulative number of runs. Here are some suggestions [LW(p) · GW(p)] about how one could go about estimating the number of runs being put into the game, if somebody want to look into this!
PS: the code for the graph above, and code to replicate Andy's graph, is now here
Replies from: Jsevillamol↑ comment by Jsevillamol · 2021-08-10T14:09:01.978Z · LW(p) · GW(p)
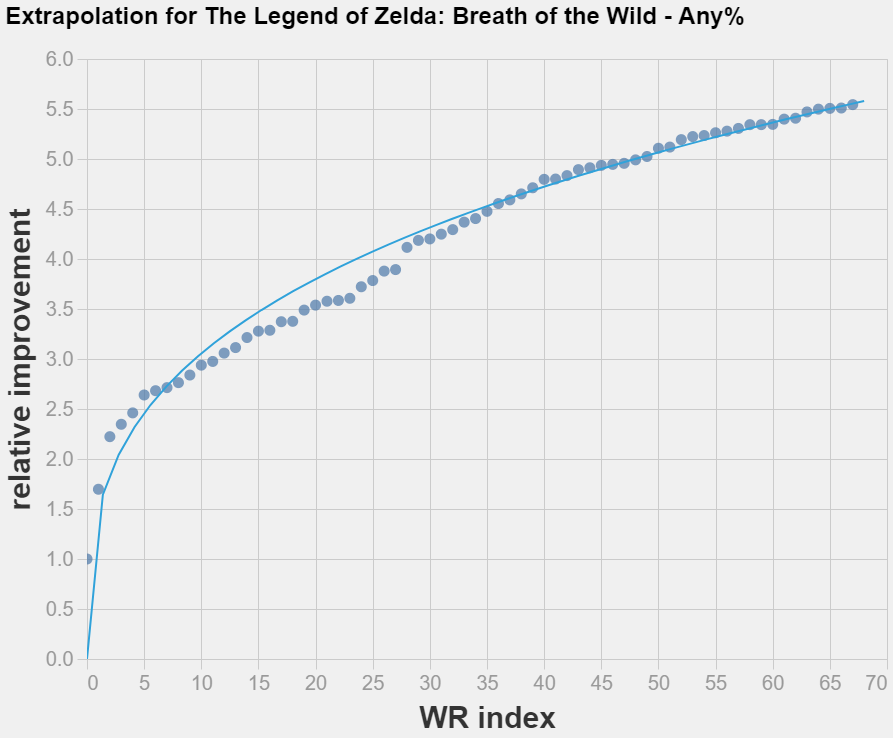
Update: I tried regressing on the ordinal position of the world records and found a much better fit, and better (above baseline!) forecasts of the last WR of each category.
This makes me update further towards the hypothesis that date is a bad predictive variable. Sadly this would mean that we really need to track whatever the index in WR is correlated with (presumably the cumulative number of runs overall by the speedrunning community).
comment by [deleted] · 2021-08-05T01:06:00.999Z · LW(p) · GW(p)
I strongly suggest looking at world records in TrackMania; it should be an absolute treasure trove of data for this purpose. 15+ years of history over dozens of tracks, with loads of incremental improvements and breakthrough exploits alike.
Here's an example of one such incredible history:
↑ comment by lorepieri (lorenzo-rex) · 2021-08-05T20:59:23.345Z · LW(p) · GW(p)
Apparently many records have been subjected to cheating:
comment by gwern · 2021-08-08T23:30:21.962Z · LW(p) · GW(p)
Differences and commonalities to expect between speedrunning and technological improvement in different fields.
Is there any way to estimate how many cumulative games that speedrunners have run at a given point? It is intuitive that progress should be related to amount of effort put into it, and that the more people play a game, the further they can push the limits, which may explain a lot of the apparent heterogeneity, even if all games have a similar experience curve exponent.
It's also interesting because the form might suggest that each attempt has an equal chance of setting a record (equal-odds rule; "On the distribution of time-to-proof of mathematical conjectures", Hisano & Sornette 2012 for math proof attempts; counting-argument in "Scaling Scaling Laws with Board Games", Jones 2021), which shows how progress comes from brute force thinking.
Replies from: gwern, Jsevillamol↑ comment by gwern · 2023-08-27T23:52:35.966Z · LW(p) · GW(p)
Also relevant: https://www.authorea.com/users/429500/articles/533177-modelling-a-time-series-of-records-in-pymc3 https://gwern.net/doc/statistics/order/index#smith-1988-section
Replies from: Jsevillamol↑ comment by Jsevillamol · 2023-08-28T09:00:09.965Z · LW(p) · GW(p)
We actually wrote a more up to date paper here
↑ comment by Jsevillamol · 2021-08-10T10:14:43.028Z · LW(p) · GW(p)
Is there any way to estimate how many cumulative games that speedrunners have run at a given point?
One should be able to use the Speedrun.com API to search for the number of runs submitted by a certain date, as a proxy for the cumulative games (though it will not reflect all attempts since AFAIK many runners only submit their personal bests to speedrun.com).
Additionally, speedrun.com provides some stats on the amount of runs and players for each game, for example the current stats for Super Metroid can be found here: https://www.speedrun.com/supermetroid/gamestats

There are some problems with this approach too.
- These are aggregated by game, not by category, so one would need to somehow split the runs among popular categories of the same game.
- There is only current data avaiable through the webpage. There might be a way to access historical data through the API. If not, one would need to use archived versions of the pages and interpolate the scrapped stats.
I'd be excited about learning about the results of either approach if anybody ends up scrapping this data!
comment by paato · 2023-11-22T19:31:47.627Z · LW(p) · GW(p)
I think it could be worth plotting the improvements in TAS runs. Would the pattern of diminishing returns be the exact same as the human speedruns? The world records you're tracking are limited by execution, and as new techniques are discovered the difficulty of completing a run increases, so good runs take more attempts, more effort, and time. Many techniques that are discovered and used in TASes are even too precise for human fingers. Human WRs are founded on technological discovery but are chained to execution. The only way to not conflate the two would be to look at TASes, which is where the technological bleeding edge is.
↑ comment by Jsevillamol · 2023-11-24T20:39:12.297Z · LW(p) · GW(p)
I agree! I'd be quite interested in looking at TAS data, for the reason you mentioned.