Posts
Comments
Yes, and EA only takes a 70% cut, with a 10% discount per user tier, its a bit ambiguously written so I cant tell if it goes from 70% to 60% or to 63%
Why the down votes?, this guy showed epistemic humility and said when he got the Joke, I can understand not upvoting as it is not the most information dense engaging post, but why down vote?, down voting confuses me and I fear it may discourage other people from writing on LW.
Edit: this post had -12, so probably 1-2 super down voted or something, and then stopped.
- Bronze User, 10€/month, gain Super upvote ability
- Silver User, 20€/month, posts cannot be down voted
- Gold User, 30€/month, post can be promoted to front page
- Platinum User, 50€/month, all posts are automatically promoted to the front page and curriated.
- Diamond User, 100€/month, user now only see adds on long posts
Loot Box: 10% Chance for +100 upvotes, 5% Chance for curriated status of random post
Each user tier gives 1 loot box per month.
Unable to comply, building in progress.
I am glad that you guys fixed bugs and got stronger estimates.
I suspect you fitted a model using best practices, I don't think the methodology is my main critique, though I suspect there is insufficient shrinkage in your estimates (and most other published estimates for polygenic traits and diseases)
It's the extrapolations from the models I am skeptical of. There is a big difference between being able to predict within sample where by definition 95% of the data is between 70-130, and then assuming the model also correctly predict when you edit outside this range, for example your 85 upper bound IQ with 500 edits, if we did this to a baseline human with IQ 100, then his child would get an IQ of 185, which is so high that only 60 of the 8 billion people on planet earth is that smart if IQ was actually drawn from a unit normal with mean 100 and sigma 15, and if we got to 195 IQ by starting with a IQ 110 human, then he would have a 90% chance of being the smartest person alive, which I think is unlikely, and I find it unlikely because there could be interaction effects or a miss specified likelihood which makes a huge difference for the 2% of the data that is not between 70-130, but almost no difference for the other 98%, so you can not test what correctly likelihood is by conventional likelihood ratio testing, because you care about a region of the data that is unobserved.
The second point is the distinction between causal for the association observed in the data, and causal when intervening on the genome, I suspect more than half of the gene is only causal for the association. I also imagine there are a lot of genes that are indirectly causal for IQ such as making you an attentive parent thus lowering the probability your kid does not sleep in the room with a lot of mold, which would not make the super baby smarter, but it would make the subsequent generation smarter.
Thanks, I am looking forward to that. There is one thing I would like to have changed about my post, because it was written a bit "in haste," but since a lot of people have read it as it stands now, it also seems "unfair" to change the article, so I will make an amendment here, so you can take that into account in your rebuttal.
For General Audience: I stand by everything I say in the article, but at the time I did not appreciate the difference between shrinking within cutting frames (LD regions) and between them. I now understand that the spike and slab is only applied within each LD region, such that each region has a different level of shrinkage, I think there exists software that tries to shrink between them but FINEMAP does not do that as fare as I understand. I have not tried to understand the difference between all the different algorithms, but it seems like the ones that does shrink between cutting frames does it "very lightly"
Had I known that at the time of writing I would have changed Optional: Regression towards the null part 2. I think spike and slab is almost as good as using a fat-tailed distribution within each cutting frame (LD region), because I suspect the effect inflation primarily arises from correlations between mutations due to inheritance patterns and to a much smaller degree from fluctuations due to "measurement error/luck" with regards to the IQ outcome variable (except when two correlated variables have very close estimates). So if I were to rewrite that section, I would instead focus on the total lack of shrinking between cutting frames, rather than the slightly insufficient shrinkage within cutting frames.
For an intuitive reason for why I care:
- frequentest: the spike and slab estimator is unbiased for all of my effects across my 1000+ LD regions.
- Bayesian: bet you 5$ that the most positive effect is to big and the most negative effect is to small, the Bayesian might even be willing to bet that it is not even in the 95% posterior interval, because it's the most extreme from 1000+ regions[1].
Not For General Audience, read at your own peril
Pointing at a Technical approach: It is even harder to write "how to shrink now" since we are now doing one more level of hierarchical models. The easiest way would be to have an adaptive spike and slab prior that you imagine all the 1000-2000 LD slap and spike priors are drawn from, and use that as an extra level of shrinkage. That would probably work somewhat. But I still feel that would be insufficient for the reasons outlined in part 2, namely that it will shrink the biggest effects slightly too much, and everything else too little, and thus underestimate the effects of the few edits and overestimate the effects of many edits, but such a prior will still shrink everything compared to what you have now, so even if it does insufficient/uneven shrinkage, it's still a better estimate than no shrinkage between LD regions.
Implementation details of 3-level spike and slab models: It is however even harder to shrink those properly. A hint of a solution would be to ignore the fact that each of the spike and slab "top level adaptive priors" influence both the slab and spike of the 1000+ LD shrinkage priors, and thus only use the spike to regularize the spike and the slab to regularize the slab. It might be possible to estimate this "post hoc", if your software outputs a sufficient amount of summary statistics, but I am actually unsure.
Implementation details of 3-level Gelman model: If you for some magical reason wanted to implement the method proposed by Andrew Gelman, as a two-level hierarchical model, then I can say from experience that when you have no effects, the method sometimes fails[2], so you should set number of mixtures to 1 for all LD regions that "suck" (suck=any mixture with one or more sigma < 1). I actually suspect/know the math for doing this may be "easy", but I also suspect that most genetics software does fancy rule-of-thumb stuff based on the type of SNP, such as assuming that a stop codon is probably worse than a mutation in a non-coding region, and all that knowledge probably helps more with inferences than "not modeling tails correct" hurts.
- [1] I am not sure this bet is sound, because if the tails are fat, then we should shrink very little, so the 1:1000 vs 1:20 argument would utterly fail for a monogenic diseases, and the spike and slab stuff within cutting frames does some shrinkage.
- [2]If statisticians knew how to convolve a t-distribution it would not fail, because a t-distribution with nu=large number converges to a normal distribution, but because he approximates a t-like distribution as a mixture of normals, it sometimes fails when the effects are truly drawn from a normal, which will probably be the case for a few LD regions.
One of us is wrong or confused, and since you are the genetisist it is probably me, in which case I should not have guessed how it works from statistical intuition but read more, I did not because I wanted to write my post before people forgot yours.
I assumed the spike and slap were across all SNPs, it sounds like it is per LD region, which is why you have multiple spikes?, I also assumed the slab part would shrink the original effect size, which was what I was mainly interested in. You are welcome to pm me to get my discord name or phone number if a quick call could give me the information to not misrepresent what you are doing
My main critique is that I think there is insufficient shrinkage, so it's the shrinkage properties I am mostly interested in getting right :)
if I had to guess, then I would guess that 2/3 of the effects are none causal, and the other 1/3 are more or less fully causal, but that all of the effects sizes between 0.5-1 are exaggerated by a factor of 20-50% and the effects estimated below +0.5 IQ are exaggerated by much more.
But I think all of humanity is very confused about what IQ even is, especially outside the ranges of 70-130, so It's hard to say if it is the outcome variable (IQ) or the additive assumption breaks down first, I imagine we could get super human IQ, and that after 1 generation of editing, we could close a lot of the causal gap. I also imagine there are big large edits with large effects, such as making brain cells smaller, like in birds, but that would require a lot of edits to get to work.
This might help you https://github.com/MaksimIM/JaynesProbabilityTheory
But to be honest I did very few of the exercises, from chapter 4 and onward most of the stuff Jayne says are "over complicated" in the sense that he derives some fancy function, but that is actually just the poison likelihood or whatever, so as long as you can follow the math sufficiently to get a feel for what the text says, then you can enjoy that all of statistics is derivable from his axioms, but you don't have to be able to derive it yourself, and if you ever want to do actual Bayesian statistics, then HMC is how you get a 'real' posterior, and all the math you need is simply an intuition for the geometry of the MCMC sampler so you can prevent it from diverging, and that has nothing to do with Jaynes and everything to do with the the leapfrogging part of the Hamiltonian and how that screws up the proposal part of the metropolis algorithm.
I am not aware of Savage much apart from both Bayesian and Frequentists not liking him. And I did not follow Jaynes math fully and there are some papers going back and forth on some of his assumptions, so the mathematical underpinnings may not be as strong as we would like.
I don't know, Intuitively you should be able to ground the agent stuff in information theory, because the rules they put forwards are the same, Jaynes also has a chapter on decision theory where he makes the wonderful point that the utility function is way more arbitrary than a prior, so you might as well be Bayesian if you are into inventing ad hoc functions anyway.
Ahh, I know that is a first year course for most math students, but only math students take that class :), I have never read an analysis book :), I took the applied path and read 3 other bayesian books before this one, so I taught the math in this books were simultaneously very tedious and basic :)
If anyone relies on tags to find posts, and you feel this post is missing a tag, then "Tag suggestions" will be much appreciated
That surprising to me, I think you can read the book two ways, 1) you skim the math, enjoy the philosophy and take his word that the math says what he says it says 2) you try to understand the math, if you take 2) then you need to at least know the chain rule of integration and what a delta dirac function is, which seems like high level math concepts to me, full disclaimer I am a biochemist by training, so I have also read it without the prerequisite formal training. I think you are right that if you ignore chapter 2 and a few sections about partition functions and such then the math level for the other 80% is undergraduate level math
crap, you are right, this was one of the last things we changed before publishing because out previous example were to combative :(.
I will fix it later today.
I think this is a pedagogical Version of Andrew Gelmans shrinkage Triology
The most important paper also has a blog post, The very short version is if you z score the published effects, then then you can derive a prior for the 20.000+ effects from the Cochrane database. A Cauchy distribution fits very well. The Cauchy distribution has very fat tails, so you should regress small effects heavily towards the null and regress very large effects very little.
Here is a fun figure of the effects, Medline is published stuff, so no effects between -2 and 2 as they would be 'insignificant', In the Cochrane collaboration they also hunted down unpublished results.
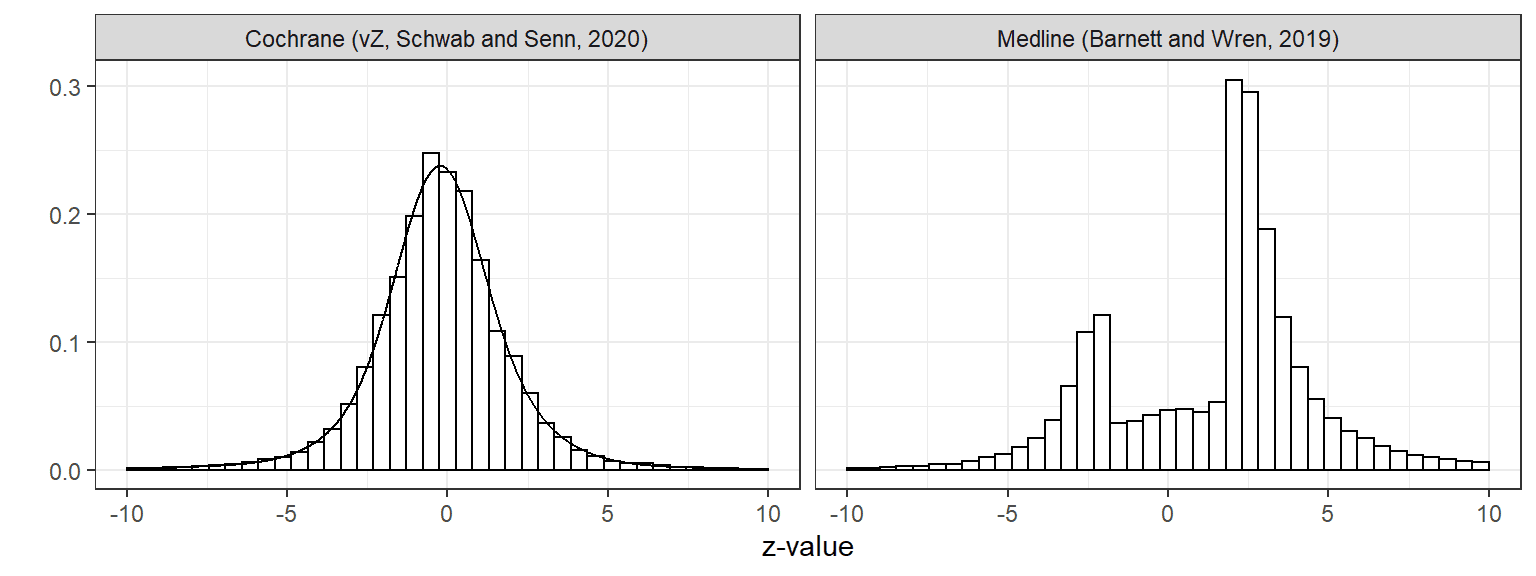
Here you see the Cochrane prior In red, you can imagine drawing a lot of random point from the red and then "adding 1 sigma of random noise", which "smears out" the effect creating the blue inflated effects we observe.
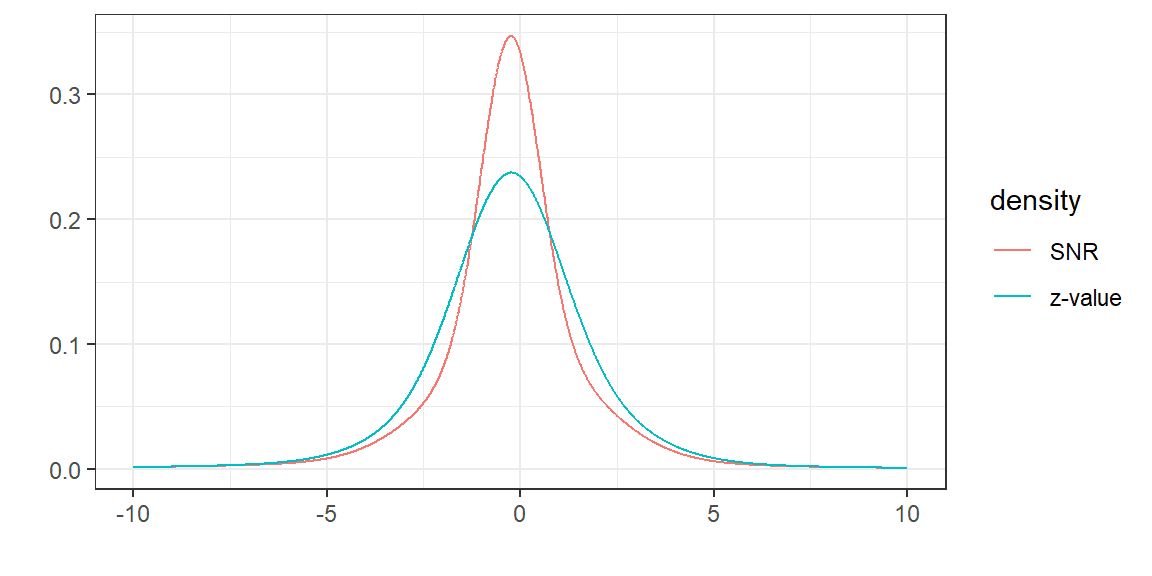
Notice this only works if you have standardized effects, if you observe that breast feeding makes you 4 time richer with sigma=2, then you have z=2 which is a tiny effect as you need 1.96 to reach significance at the 5% level in frequentest statistics, and you should thus regress it heavily towards the null, where if you observe that breast feeding makes you 1% richer with sigma=0.01% then this is a huge effect and it should be regressed towards the null very little
SR if you can only read one, if you do not expect to do fancy things then ROS may be better as it is very good and explains the basics better. The logic of Science should be your 5th book and is good goal to set, The logic of Science is probably the rationalist bible, much like the real bible everybody swears by it but nobody has read or understood it :)
Thanks for the reply, 3 seams very automatable, record all text before the image, if that's 4 minuts then then put the image in after 4 min. But i totally get that stuff is more complicated than it initially seems, keep up the good work!
I agree tails are important, but for callibration few of your predictions should land in the tail, so imo you should focus on getting the trunk of the distribution right first, and the later learn to do overdispersed predictions, there is no closed form solution to callibration for a t distribution, but there is for a normal, so for pedagogical reasons I am biting the bullet and asuming the normal is correct :), part 10 in this series 3 years in the future may be some black magic of the posterior of your t predictions using HMC to approximate the 2d posterior of sigma and nu ;), and then you can complain "but what about skewed distributios" :P
The text to speech is phenomenal!, Only math and tables suck
Suggestions for future iterations:
- allow filtering of the RSS by hacking the url, for example ?sources=LW,EA&quality=curated would give the curated posts from only EA and LW ignoring alignment forum
- somehow allow us to convert our "read later" to an RSS :)
- when there are figures in the post, then put them in the podcast "image" like SolenoidEntity does for the Astral Codex 10 podcast
- put the text in the show notes so we can pause and look at tables
It would be nice if you wrote a short paragraph for each link, "requires download", "questions are from 2011", or you sorted the list somehow :)
Yes, You can change future by being smarter and future by being better calibrated, my rule assumes you don't get smarter and therefore have to adjust only future .
If you actually get better at prediction you could argue you would need to update less than the RMSE estimate suggests :)
I agree with both points
If you are new to continuous predictions then you should focus on the 50% Interval as it gives you most information about your calibration, If you are skilled and use for example a t-distribution then you have for the trunk and for the tail, even then few predictions should land in the tails, so most data should provide more information about how to adjust , than how to adjust
Hot take: I think the focus 95% is an artifact of us focusing on p<0.05 in frequentest statistics.
Our ability to talk past each other is impressive :)
would have been an easier way to illustrate your point). I think this is actually the assumption you're making. [Which is a horrible assumption, because if it were true, you would already be perfectly calibrated].
Yes this is almost the assumption I am making, the general point of this post is to assume that all your predictions follow a Normal distribution, with as "guessed" and with a that is different from what you guessed, and then use to get a point estimate for the counterfactual you should have used. And as you point out if (counterfactual) then the point estimate suggests you are well calibrated.
In the post counter factual is
Thanks!, I am planing on writing a few more in this vein, currently I have some rough drafts of:
- 30% Done, How to callibrate normal predictions
- defence of my calibration scheme, and an explanation of how metaculus does.
- 10% Done, How to make overdispersed predictions
- like this one for the logistic and t distribution.
- 70% Done, How to calibrate binary predictions
- like this one + but gives a posterior over the callibration by doing an logistic regression with your predictions as "x" and outcome as "y"
I can't promise they will be as good as this one, but if they are not terrible then I would like them to be turned into a sequence :), how do I do this?
Yes you are right, but under the assumption the errors are normal distributed, then I am right:
If:
Then Which is much less than 1.
proof:
import scipy as sp

x1 = sp.stats.norm(0, 0.5).rvs(22 * 10000)
x2 = sp.stats.norm(0, 1.1).rvs(78 * 10000)
x12 = pd.Series(np.array(x1.tolist() + x2.tolist()))
print((x12 ** 2).median())
I am making the simple observation that the median error is less than one because the mean squares error is one.
That's also how I conseptiolize it, you have to change your intervals because you are to stupid to make better predictions, if the prediction was always spot on then sigma should be 0 and then my scheme does not make sense
If you suck like me and get a prediction very close then I would probably say: that sometimes happen :) note I assume the average squared error should be 1, which means most errors are less than 1, because 02+22=2>1
I agree, most things is not normal distributed and my callibrations rule answers how to rescale to a normal. Metaculus uses the cdf of the predicted distribution which is better If you have lots of predictions, my scheme gives an actionable number faster, by making assumptions that are wrong, but if you like me have intervals that seems off by almost a a factor of 2, then your problem is not the tails but the entire region :), so the trade of seems worth it.
Agreed, More importantly the two distribution have different kurtosis, so their tails are very different a few sigmas away
I do think the Laplace distribution is a better beginner distribution because of its fat tails, but advocating for people to use a distribution they have never heard of seems like a to tough sell :)
My original opening statement got trashed for being to self congratulatory, so the current one is a hot fix :), So I agree with you!
Me to, I learned about this from another disease and taught, that's probably how it works for colorblindness as well.
I would love you as a reviewer of my second post as there I will try to justify why I think this approach is better, you can even super dislike it before I publish if you still feel like that when I present my strongest arguments, or maybe convince me that I am wrong so I dont publish part 2 and make a partial retraction for this post :). There is a decent chance you are right as you are the stronger predictor of the two of us :)
Can I use this image for my "part 2" posts, to explain how "pros" calibrate their continuous predictions?, And how it stacks up against my approach?, I will add you as a reviewer before publishing so you can make corrections in case I accidentally straw man or misunderstand you :)
I will probably also make a part 3 titled "Try t predictions" :), that should address some of your other critiques about the normal being bad :)
Note 1 for JenniferRM: I have updated the text so it should alleviate your confusion, if you have time, try to re-read the post before reading the rest of my comment, hopefully the few changes should be enough to answer why we want RMSE=1 and not 0.
Note 2 for JenniferRM and others who share her confusion: if the updated post is not sufficient but the below text is, how do I make my point clear without making the post much longer?
With binary predictions you can cheat and predict 50/50 as you point out... You can't cheat with continuous predictions as there is no "natural" midpoint.
The insight you are missing is this:
- I "try" to Convert my predictions to the Normal N(0, 1) using the predicted mean and error.
- The variance of the unit Normal is 1: Var(N(0, 1)) = 1^2 = 1
- If my calculated variance deviate from the unit normal, then that is evidence that I am wrong, I am making the implicit assumption that I cannot make "better point predictions" (change ) and thus is forced to only update my future uncertainty interval by .
To make it concrete, If I had predicted (sigma here is 10 wider than in the post):
- Biden ~ N(54, 30)
- COVID ~ N(15.000, 50.000)
then the math would give . Both the post predictions and the "10 times wider predictions in this comment" implies the same "recalibrated" :
(On a side note I hate brier scores and prefer Bernoulli likelihood, because brier says that predicting 0% or 2% on something that happens 1% of the time is 'equally wrong' (same square error)... where the Bernoulli says you are an idiot for saying 0% when it can actually happen)
The big ask is making normal predictions, calibrating them can be done automatically here is a quick example using google sheets: here is an example
I totally agree with both your points, This comment From a Metaculus user have some good objections to "us" :)
I am sorry if I have straw manned you, and I think your above post is generally correct. I think we are cumming from two different worlds.
You are coming from Metaculus where people make a lot of predictions. Where having 50+ predictions is the norm and the thus looking at a U(0, 1) gives a lot of intuitive evidence of calibration.
I come from a world where people want to improve in all kids of ways, and one of them is prediction, few people write more than 20 predictions down a year, and when they do they more or less ALWAYS make dichotomous predictions. I expect many of my readers to be terrible at predicting just like myself.
You are reading a post with the message "raise the sanity waterline from 2% to 5% of your level" and asking "why is this better than making 600 predictions and looking at their inverse CDF", and the answer is: it's not, but it's still relevant because most people do not make 600 predictions and do not know what an inverse CDF is. I am even explaining what an normal distribution is because I do not expect my audience to know...
-
You are absolutely correct they probably do not share an error distribution. But I am trying to get people from knowing 1 distribution to knowing 2.
-
Scot Alexander makes a "when I predict this" then "it really means that", every year for his binary predictions, This gives him an intuitive feel for "I should adjust my odds up/down by x". I am trying to do the same for Normal Distribution predictions, so people can check their predictions.
-
I agree your methodology is superior :), All I propose that people sometimes make continuous predictions, and if they want to start doing that and track how much they suck, then I give them instructions to quickly getting a number for how well it is going.
TLDR for our disagreement:
SimonM: Transforming to Uniform distribution works for any continuous variable and is what Metaculus uses for calibration
Me: the variance trick to calculate from this post is better if your variables are form a Normal distribution, or something close to a normal.
SimonM: Even for a Normal the Uniform is better.
I don't know what s.f is, but the interval around 1.73 is obviously huge, with 5-1-0 data points it's quite narrow if your predictions are drawn from N(1, 1.73), that is what my next post will be about. There might also be a smart way to do this using the Uniform, but I would be surprised if it's dispersion is smaller than a chi^2 distribution :) (changing the mean is cheating, we are talking about calibration, so you can only change your dispersion)
Hard disagree, From two data points I calculate that my future intervals should be 1.73 times wider, converting these two data points to U(0,1) I get
[0.99, 0.25]
How should I update my future predictions now?
you are missing the step where I am transforming arbitrary distribution to U(0, 1)
medium confident in this explanation: Because the square of random variables from the same distributions follows a gamma distribution, and it's easier to see violations from a gamma than from a uniform, If the majority of your predictions are from a weird distributions then you are correct, but if they are mostly from normal or unimodal ones, then I am right. I agree that my solution is a hack that would make no statistician proud :)
Edit: Intuition pump, a T(0, 1, 100) obviously looks very normal, so transforming to U(0,1) and then to N(0, 1) will create basically the same distribution, the square of a bunch of normal is Chi^2, so the Chi^2 is the best distribution for detecting violations, obviously there is a point where this approximation sucks and U(0, 1) still works
changed to "Making predictions is a good practice, writing them down is even better."
does anyone have a better way of introducing this post?
(Edit: the above post has 10 up votes, so many people feel like that, so I will change the intro)
You have two critiques:
-
Scott Alexander evokes tribalism
-
We predict more than people outside our group holding everything else constant
-
I was not aware of it, and I will change if more than 40% agree
Remove reference to Scott Alexander from the intro: [poll]{Agree}{Disagree}
- I think this is true, but have no hard facts, more importantly you think I am wrong, or if this also evokes tribalism it should likewise be removed...
Also Remove "We rationalists are very good at making predictions" from the intro: [poll]{Agree}{Disagree}
If i remove both then I need a new intro :D
This is a good point, but you need less data to check whether your squared errors are close to 1 than whether your inverse CDF look uniform, so if the majority of predictions are normal I think my approach is better.
The main advantage of SimonM/Metaculus is that it works for any continuous distribution.
Agreed 100% on 1) and with 2) I think my point is "start using the normal predictions as a gate way drug to over dispersed and model based predictions"
I stole the idea from Gelman and simplified it for the general community, I am mostly trying to raise the sanity waterline by spreading the gospel of predicting on the scale of the observed data. All your critiques of normal forecasts are spot on.
Ideally everybody would use mixtures of over-dispersed distributions or models when making predictions to capture all sources of uncertainty
It is my hope that by educating people in continuous prediction the Metaculus trade off you mention will slowly start to favor the continuous predictions because people find it as easy as binary prediction... but this is probably a pipe dream, so I take your point
You could make predictions from a t distribution to get fatter tails, but then the "easy math" for calibration becomes more scary... You can then take the "quartile" from the t distribution and ask what sigma in the normal that corresponds to. That is what I outlined/hinted at in the "Advanced Techniques 3"
Good Points, Everything is a conditional probability, so you can simply make conditional normal predictions:
Let A = Biden alive
Let B = Biden vote share
Then the normal probability is conditional on him being alive and does not count otherwise :)
Another solution is to make predictions from a T-distribution to get fatter tails. and then use "Advanced trick 3" to transform it back to a normal when calculating your calibration.
I think this was by parents, so they are forgiven :), your story is pretty crazy, but there is so much to know as a doctor that most becomes rules of thumbs (maps vs buttons) untill called out like you did
fair point. I think my target audience is people like me who heard this saying about colorblindness (or other classical Mendelian diseases that runs in families)
I have added a disclaimer towards the end :)
I am not sure I follow, I am confused about whether the 60/80 family refers to both parents, and what is meant by "off-beat" and "snap-back", I am also confused about what the numbers mean is it 60/80 of the genes or 60/80 of the coding region (so only 40 genes)
I totally agree, technically it's a correct observation, but it's also what I was taught by adults when I asked as a kid, and therefore I wanted to correct it as the real explanation is very short and concise.