Non-loss of control AGI-related catastrophes are out of control too
post by Yi-Yang (yiyang), Mo Putera (Mo Nastri), zeshen · 2023-06-12T12:01:26.682Z · LW · GW · 3 commentsContents
  Executive Summary
  Introduction
  Epistemic status
  Modeling
    Preamble
    Estimating p(AGI-related catastrophe | AGI by 2070) = 26%
    Estimating p(existential catastrophe | LoC) = 22% and p(existential catastrophe | non-LoC) = 23%
        x p(LoC | AGI-related catastrophes)
                                                                   x p(unrecoverable catastrophe | LoC)
        8%
        2%
        10%
        5%
        5%
        10%
      Modeling step 1: scenario tree of AGI-driven catastrophes
      Modeling step 2: assigning transition probabilities
      Modeling step 3: estimating probabilities for LoC vs other factors
      Modeling step 4: estimating recoverability probabilities
        22%
        23%
        45%
    Putting it all together: p(existential catastrophe | LoC) = 5.7% and p(existential catastrophe | non-LoC) = 6.0%
        Failure mode / recoverability of catastrophe
        p(LoC → AGI catastrophe)
        p(non LoC → AGI catastrophe)
        Total p(AGI catastrophe)
  Conclusion and Recommendations
  Appendix
    Terminologies
    Our model of Open Philanthropy’s views
    What counts as ‘loss of control’
    p(AGI-driven catastrophe | AGI by 2070)
    Competition intensity
      Gap between SOTA and second place
        Median gap in years
        0.74
        Median gap in years if NPLM is removed
        0.60
    Polarity
    p(existential catastrophe | non-LoC)
      Engineered pandemic
        How likely will the use of in-control AGI increase the likelihood of an engineered pandemic?
        How unrecoverable would an engineered pandemic enabled by an in-control AGI be?
        Wouldn’t the use of in-control AGI to defend against engineered pandemic reduce p(unrecoverable)?
      Nuclear winter
        How likely will the use of in-control AGI increase the likelihood of a nuclear winter?
None
3 comments
For the Open Philanthropy AI Worldview Contest
Executive Summary
- Conditional on AGI being developed by 2070, we estimate the probability that humanity will suffer an existential catastrophe due to loss of control (LoC) over an AGI system at ~6%, using a quantitative scenario model that attempts to systematically assess the relative probabilities of all AGI-driven catastrophes in a collectively exhaustive manner (details here [LW(p) · GW(p)]; spreadsheet here).
- We also estimate the overall probability that humanity will suffer an existential catastrophe due to an AGI-related catastrophe at ~12%. The remaining 12% - 6% = 6% of the probability mass derives from non-LoC AGI catastrophes (e.g. AI-exacerbated x-risks).
- Given our estimate that p(existential catastrophe | non-LoC) ≈ p(existential catastrophe | LoC), we argue that Open Philanthropy (OP) should consider broadening their priorities to include non-LoC scenarios as well (more [LW · GW]), instead of focusing mainly on what we think is OP’s core threat model of misaligned power-seeking AI. (more [LW · GW])
- In particular, we suggest that OP look into approaches to safeguard against non-LoC AI-exacerbated development and deployment of full-scale nuclear war and engineered pandemics. (more [LW · GW])
- We think the ‘AI-exacerbated’ tie-in requires a cross-domain approach that makes OP best positioned to work on this issue, given OP’s existing grantmaking on both AI and biosecurity GCRs.
- In tabular format, our estimates are as follows:
Failure mode / recoverability of catastrophe | p(LoC → AGI catastrophe) | p(non-LoC → AGI catastrophe) | Total p(AGI catastrophe) |
| Unrecoverable (i.e. existential) | 5.7% | 6.0% | 11.7% |
| Recoverable | 3.3% | 10.9% | 14.3% |
| Total p(AGI-related catastrophe) | 9.1% | 16.9% | 26.0% |
Table 1
Introduction
We broadly agree with the following picture from Metaculus’ Ragnarok Question Series, even if we disagree with exact estimates:
- While in most possible futures (proxying by snapshot at year 2100) humanity will not experience global catastrophes (i.e. leading to the death of >10% of the world population), enough possible futures do experience such global catastrophes as to warrant societal-scale concern and immediate collective action.
- In possible futures with global catastrophes, the most likely failure mode will be related to AI, capturing nearly half of the probability mass; nuclear war and global catastrophic (GC) biorisk account for most of the rest.
- AI-related global catastrophes are far more unrecoverable than other global catastrophic risks (GCRs), making them arguably the most important category of GCR from an existential catastrophe perspective.
- Despite their importance, AI-related GCRs have been neglected relative to other GCRs (and to other AI-related non-GC risks).
- It is unclear how to mitigate AI-related GCRs, but recent progress on multiple fronts give reason for hope amidst the gloom.
In the following sections we go into more detail on these claims.
Epistemic status
- Our model is based on many assumptions and best guess estimates. Given this exercise is about predicting events beyond the immediate future, each parameter would carry considerable uncertainties.
- We’ve used point estimates instead of probability distributions in our input parameters. This means our model is not amenable to uncertainty analysis, which might materially change our calculations.
- Due to various constraints, we were unable to allocate as much time as we would have liked to rigorously stress-test our core claims. Therefore, while we think there might be some validity in these claims, we advise further independent testing and validation.
- For any terms that might be misconstrued, please see here [LW(p) · GW(p)].
Modeling
Preamble
At a high level, we think it is necessary to contextualize the estimation of p(existential catastrophe | LoC) (henceforth p(existential catastrophe | LoC)) against the backdrop of all possible futures where AGI has been developed by 2070, instead of trying to directly estimate p(existential catastrophe | LoC) for the single category of LoC scenarios.
This makes sense since the total probability of all possible futures happening should sum to 100%, and the relative likelihoods of different AGI-related catastrophes should constrain the ranges of probabilities that loss-of-control scenarios can have in a consistent manner.
This implies 2 things. First, it makes sense to factorize the following term and estimate each term separately:
p(existential catastrophe | LoC) = p(AGI-related catastrophes | AGI by 2070)
x p(LoC | AGI-related catastrophes)
x p(unrecoverable catastrophe | LoC)
The corresponding Sankey diagram looks like this:
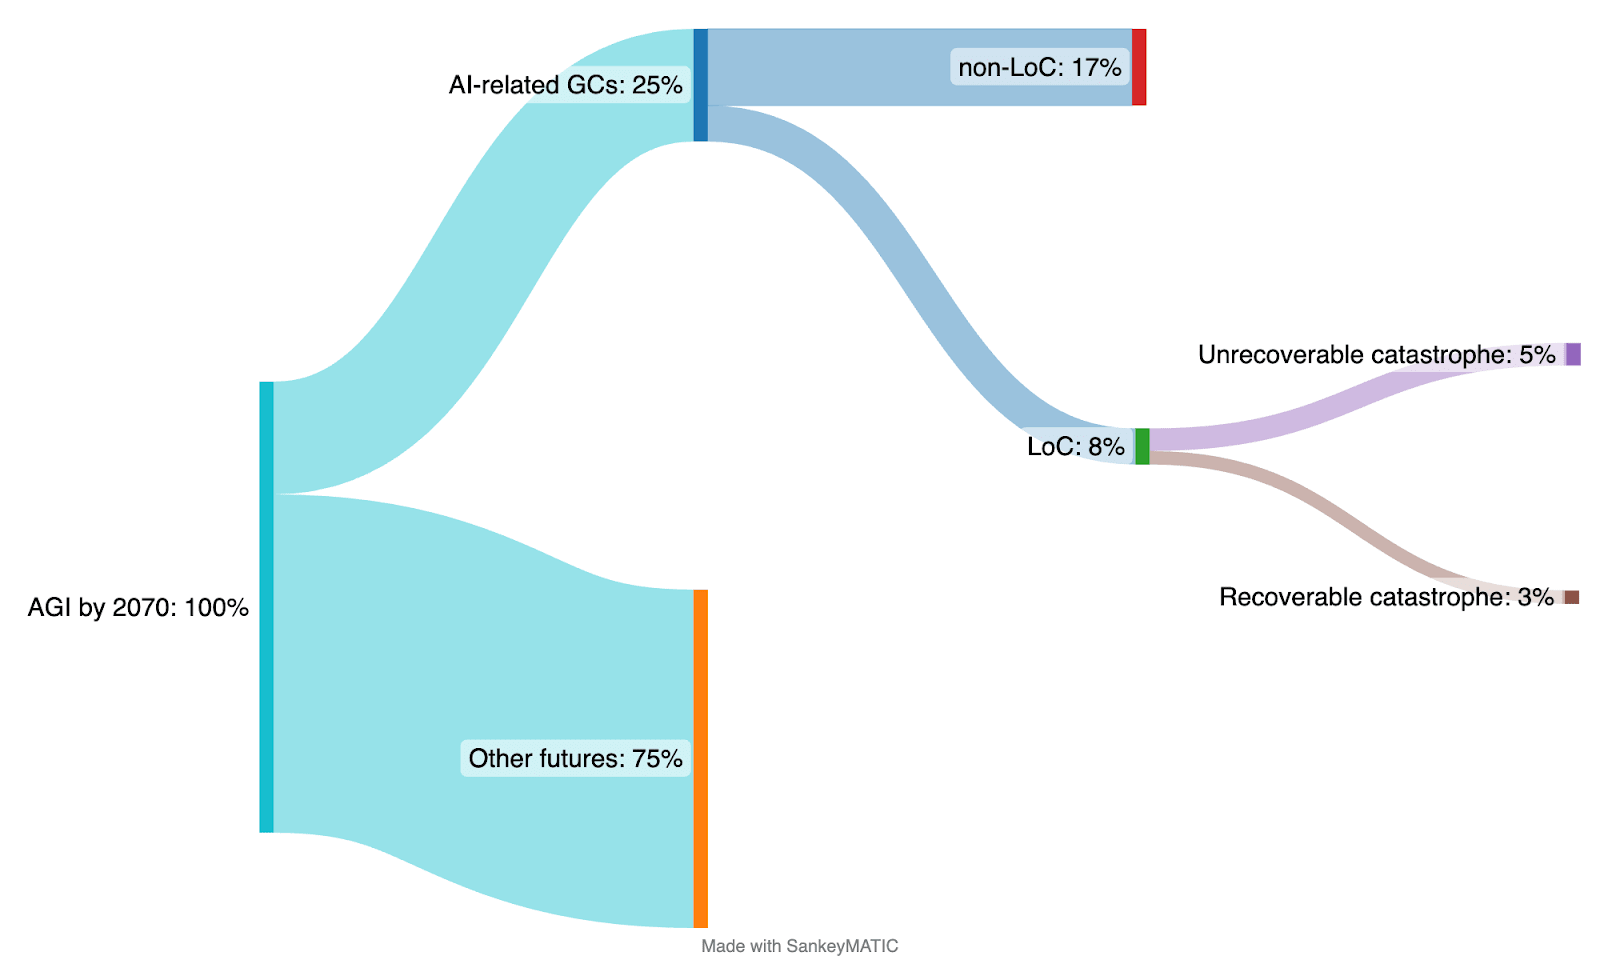
Note that we use the terms existential catastrophe and unrecoverable catastrophe interchangeably (more).
Secondly, instead of modeling p(existential catastrophe | LoC) along the lines of Carlsmith (2022)’s approach, which constructs a conjunctive risk model to evaluate the probability of a single risk category, we adopted the following approach:
- Attempt a mutually exclusive and collectively exhaustive (MECE) classification of all AGI-related catastrophes.
- Estimate the probability of each category of catastrophe happening, whether due to LoC or non-LoC.
- Estimate the probability of recoverability from catastrophe.
- Aggregate the granular probability estimates to get the high-level p(existential catastrophe | LoC).
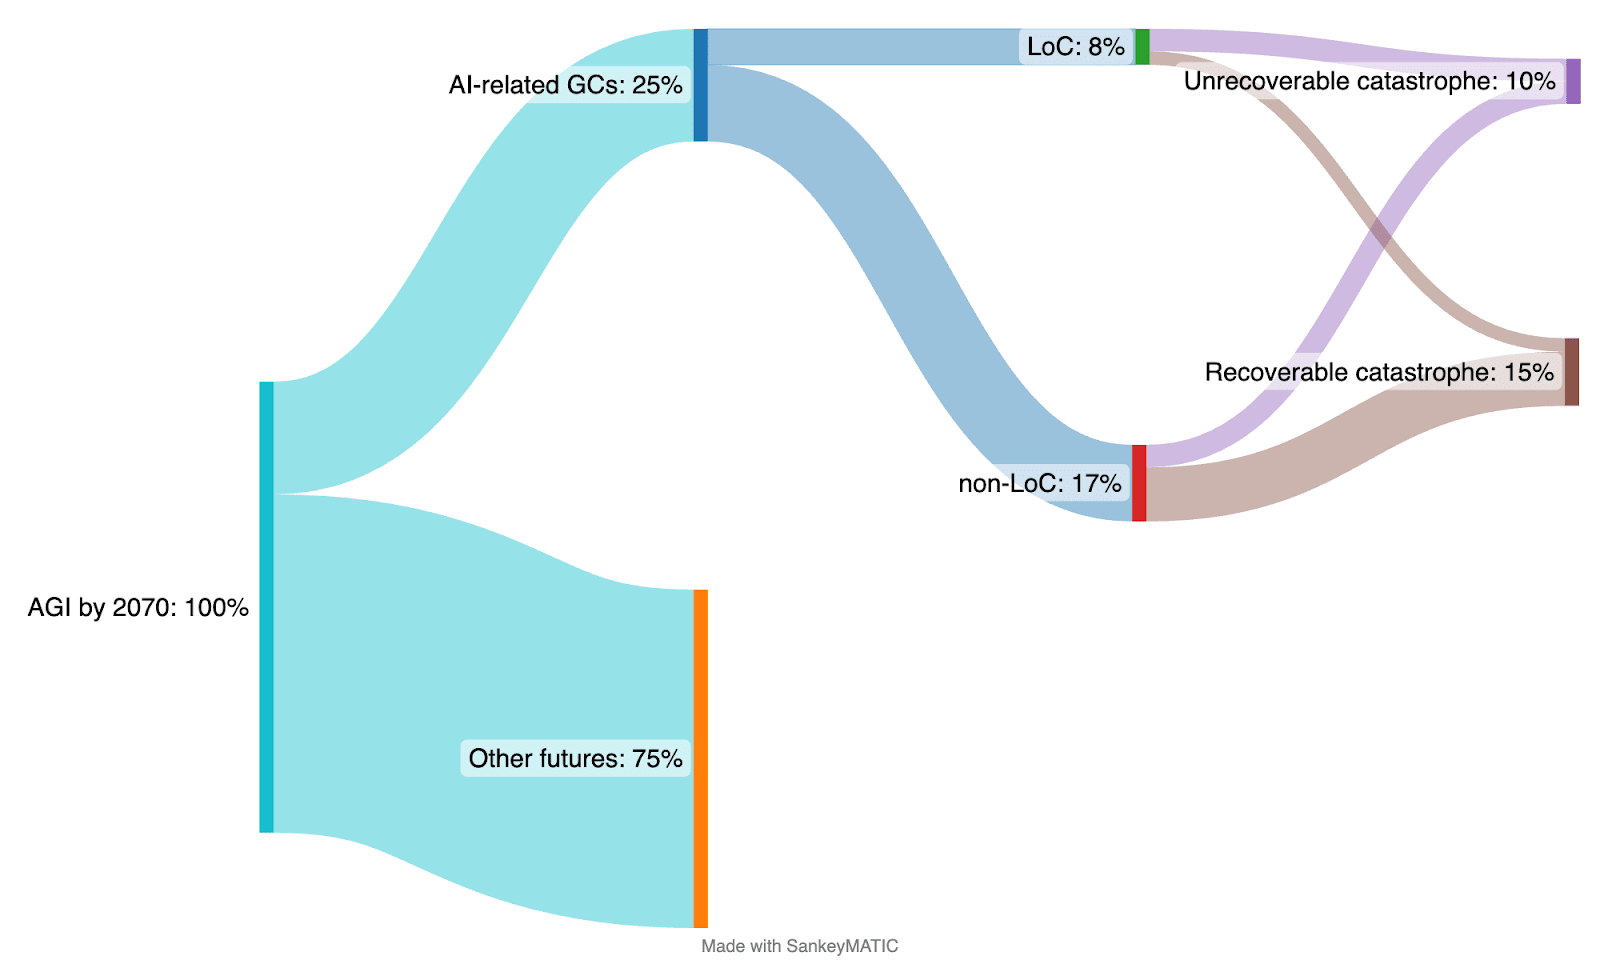
This approach yields two benefits:
- The resulting model is (partly) disjunctive, which we claim should yield more confidence in the final estimates by broadening coverage of AGI-related catastrophes and evaluating their relative likelihoods systematically.
- As a bonus, it also lets us estimate p(existential catastrophe | non-LoC) in the same context, which leads to the insight that p(existential catastrophe | non-LoC) is comparable to p(existential catastrophe | LoC).
The corresponding Sankey diagram now looks like this:
Estimating p(AGI-related catastrophe | AGI by 2070) = 26%
We estimate the first factor (bolded) below by appealing to a combination of Metaculus predictions and Cotra’s timelines model:
p(existential catastrophe | LoC) = p(AGI-related catastrophes | AGI by 2070)
x p(LoC | AGI-related catastrophes)
x p(unrecoverable catastrophe | LoC)
At the time of writing (May 2023), there were two Metaculus questions that were relevant to estimating p(AGI-driven catastrophe):
- By 2100, will the human population decrease by at least 10% during any period of 5 years? (Answer: 38%)
- If a global catastrophe occurs, will it be due to an artificial intelligence failure-mode? (Answer: 46%)
- If an artificial intelligence catastrophe occurs, will it reduce the human population by 95% or more? (Answer: 68%)
The first 2 Metaculus questions are relevant for this section (the 3rd question will be relevant later [LW · GW]). However, none of these questions condition on AGI having been developed by 2070 as per Open Phil’s question, so we proxy this by appealing to Cotra’s model to get p(AGI by 2070) > 65%.
Using these estimates,
- The probability of an AI related catastrophe by 2100 is 38% x 46% = 17%
- The probability of an AI related catastrophe by 2100 conditional on AGI being developed by 2070 is 17% / 65% = 26%
However, in the case of Metaculus’ figures, it is unclear how the participants of these questions arrived at these estimates. We expect these estimates to carry a huge degree of uncertainty. This is evident when different reviewers of Carlsmith (2022) arrived at wildly different estimates (~6 orders of magnitude difference) even given the same framework. There seems to be several classes of disagreements that contribute to these differences (more [LW · GW]).
Estimating p(existential catastrophe | LoC) = 22% and p(existential catastrophe | non-LoC) = 23%
Next, we estimate the second and third factors (bolded) below.
p(existential catastrophe | LoC) = p(AGI-related catastrophes | AGI by 2070)
x p(LoC | AGI-related catastrophes)
x p(unrecoverable catastrophe | LoC)
As mentioned in the preamble [LW(p) · GW(p)], looking at p(LoC | AGI-related catastrophes) x p(unrecoverable catastrophe | LoC) naturally suggests its complement p(non-LoC | AGI-related catastrophes) x p(unrecoverable catastrophe | non-LoC); both terms sum to p(unrecoverable catastrophe | AGI-related catastrophe). In a bit more detail:
It is plausible that most of the probability mass of AGI-driven catastrophes falls into the ‘recoverable’ bucket – using contrived figures to illustrate:
| Category | Probabilities |
| Unrecoverable | 10% |
| Recoverable | 16% |
| Total p(AGI catastrophe) | 26% |
Table 2
It’s also plausible that the probability mass of unrecoverable AGI-driven catastrophes primarily arises from LoC. Again using contrived figures below, LoC accounts for 8% / 10% = 80% of the probability mass of unrecoverable scenarios. This would justify a focus on examining LoC scenarios in the context of mitigating AGI-driven x-risk:
| Category | p(LoC → AGI catastrophe) | p(non LoC → AGI catastrophe) | Total p(AGI catastrophe) |
| Unrecoverable | 8% | 2% | 10% |
| Recoverable | 2% | 14% | 16% |
| Total p(AGI catastrophe) | 10% | 16% | 26% |
Table 3.1
But this could go in the other direction as well – i.e. perhaps a comparable share of p(unrecoverable catastrophes) is driven by non-LoC catastrophes as well, similarly using contrived figures below. This would suggest a need to better understand other AGI x-risk sources, instead of just focusing on LoC; it would also mean p(existential catastrophe | LoC) is lower:
| Category | p(LoC → AGI catastrophe) | p(non LoC → AGI catastrophe) | Total p(AGI catastrophe) |
| Unrecoverable | 5% | 5% | 10% |
| Recoverable | 5% | 11% | 16% |
| Total p(AGI catastrophe) | 10% | 16% | 26% |
Table 3.2
Our claim is that Table 3.2 is more directionally accurate than Table 3.1, which would suggest a broadening of priorities to include specific non-LoC scenarios that are comparably existentially risky to (if not more than) LoC.
The modeling process for estimating the probabilities that go into Table 3.2 above proceeds in a few steps:
| Step | Description |
| 1 | Create a MECE scenario tree of AGI-driven catastrophes, generated using (a different subset of) the key variables used in Distinguishing AI takeover scenarios [AF · GW] (go to step 1 [LW · GW]) |
| 2 | Assign “transition probabilities” to leaf nodes, each of which is a conjunctive risk model representing a class of similar catastrophes, and use them to calculate the probability fraction of AGI-driven catastrophes it captures, all summing up to 100% (go to step 2 [LW · GW]) |
| 3 | For each leaf node (i.e. class of similar catastrophes), estimate p(LoC | catastrophe), informed by the descriptions in the Survey of potential long-term impacts of AI [EA · GW] (go to step 3 [LW · GW]) |
| 4 | For each leaf node, estimate p(recoverable | LoC) and p(recoverable | non-LoC). Finally, sum over the probabilities to get the estimates in Table 2.2 (go to step 4 [LW · GW]) |
Modeling step 1: scenario tree of AGI-driven catastrophes
In Distinguishing AI takeover scenarios [AF · GW], Sam Clarke and Sammy Martin distinguish and categorize AI takeover scenarios using the following variables, of which the first 3 are key:
- AI capabilities takeoff speed
- Uni/multipolarity of takeover
- Inner/outer misalignment
- Whether competitive pressures (incentives to develop or deploy existentially risky systems to remain competitive) cause or exacerbate catastrophe
- Agentic-ness
- Generality
- …
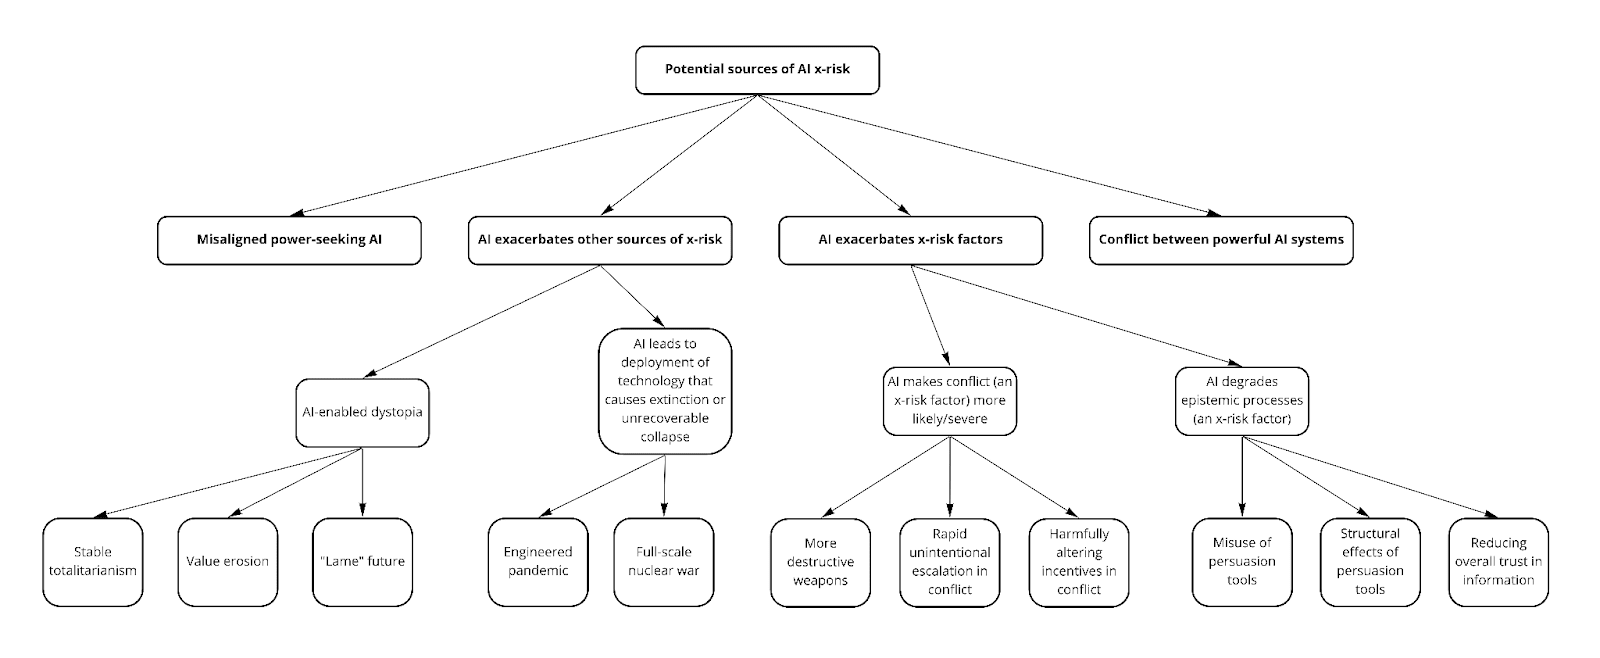
Our scenario tree uses their writeup as a starting point, but differs in the choice of variables used because we aren’t limiting our focus to AI takeover scenarios, but the more general superset of AI-driven catastrophes. The goal is to broaden coverage to include all risk sources described in Classifying sources of AI x-risk [EA · GW], instead of being constrained by the ‘AI takeover’ criterion to the leftmost branch as illustrated below:
After exploring a few different combinations of variables, we settled on the following 4 as key to achieving this:
- AI capabilities takeoff speed
- Uni/multipolarity (but not assuming takeover)
- Alignment vs misalignment (instead of assuming misalignment)
- Whether competitive pressures cause or exacerbate catastrophe
The variables can be ordered like so: competitive pressures → takeoff speed → polarity → alignment. (It turns out that the final estimates are robust to choice of variable ordering, so this is not really key to the argument.) This leads to the following scenario tree:

The ‘aligned AI’ leaf nodes in this scenario tree collectively capture the non-takeover risk sources illustrated in the preceding classification chart.
Modeling step 2: assigning transition probabilities
The transition probabilities in the scenario tree are assigned as follows. Note that all of these branches are conditioned upon an AGI-related catastrophe.
Stage 1:
| Factor | Given factor | Probabilities & reasoning |
| Competition intensity | n/a | 60% intense competition, 40% mild competition Reasoning:
|
Table 4.1
Stage 2:
| Factor | Given factor | Probabilities & reasoning |
| Takeoff speed | Intense competition | 50% fast takeoff, 50% slow Reasoning:
|
| Takeoff speed | Mild competition | 30% fast takeoff, 70% slow Reasoning:
|
Table 4.2
Stage 3:
| Factor | Given factor | Given factor | Probabilities & reasoning |
| Polarity | Fast takeoff | Intense competition | 60% unipolar, 40% multipolar Reasoning:
Find out more about our thoughts here [LW(p) · GW(p)]. |
| Polarity | Slow takeoff | Intense competition | 30% unipolar, 70% multipolar Reasoning: Due to a slower takeoff speed and a more intense competition dynamic, we should expect more possible worlds with multiple superintelligences. |
| Polarity | Fast takeoff | Mild competition | 75% unipolar, 25% multipolar Reasoning: Due to a higher takeoff speed and a less intense competition dynamic, we think there’s a much larger chance of a unipolar world. |
| Polarity | Slow takeoff | Mild competition | 50% unipolar, 50% multipolar Reasoning: Given slow takeoff and mild competition, we are uncertain which will have a bigger effect size. Hence, we gave both an equal chance. |
Table 4.3
Stage 4:
| Factor | Given factor | Given factor | Given factor | Probabilities & reasoning |
| Alignment | Unipolar | Fast takeoff | Intense competition | 70% misaligned AGI, 30% aligned AGI Reasoning:
|
| Alignment | Multipolar | Fast takeoff | Intense competition | 80% misaligned AGI, 20% aligned AGI Reasoning:
|
| Alignment | Unipolar | Slow takeoff | Intense competition | 60% misaligned AGI, 40% aligned AGI Reasoning: Given a unipolar world with slow takeoff and intense competition, we think it’s somewhat likely that we’ll get misaligned AI. |
| Alignment | Multipolar | Slow takeoff | Intense competition | 65% misaligned AGI, 35% aligned AGI Reasoning: Given a multipolar world with slow takeoff and intense competition, we think it’s somewhat likely that we’ll get misaligned AIs, again with higher probability of misalignment in the multipolar case. |
| Alignment | Unipolar | Fast takeoff | Mild competition | 65% misaligned AGI, 35% aligned AGI Reasoning: Given a unipolar world with fast takeoff and mild competition, we think it’s somewhat likely that we’ll get misaligned AI. |
| Alignment | Multipolar | Fast takeoff | Mild competition | 70% misaligned AGI, 30% aligned AGI Reasoning: Given a multipolar world with fast takeoff and mild competition, we think it’s quite likely that we’ll get misaligned AIs. |
| Alignment | Unipolar | Slow takeoff | Mild competition | 50% misaligned AGI, 50% aligned AGI Reasoning: Given a unipolar world with slow takeoff and mild competition, we are unsure which is more likely. |
| Alignment | Multipolar | Slow takeoff | Mild competition | 55% misaligned AGI, 45% aligned AGI Reasoning: Given a multipolar world with slow takeoff and mild competition, we think it’s a little likely that we’ll get misaligned AIs. |
Table 4.4
We then use the estimates (from stages 1 to 4 above) to fill out the scenario tree below. The resulting probabilities for the leaf nodes, calculated by taking the product of transition probabilities along scenario tree branches ending in each leaf node, are as follows:
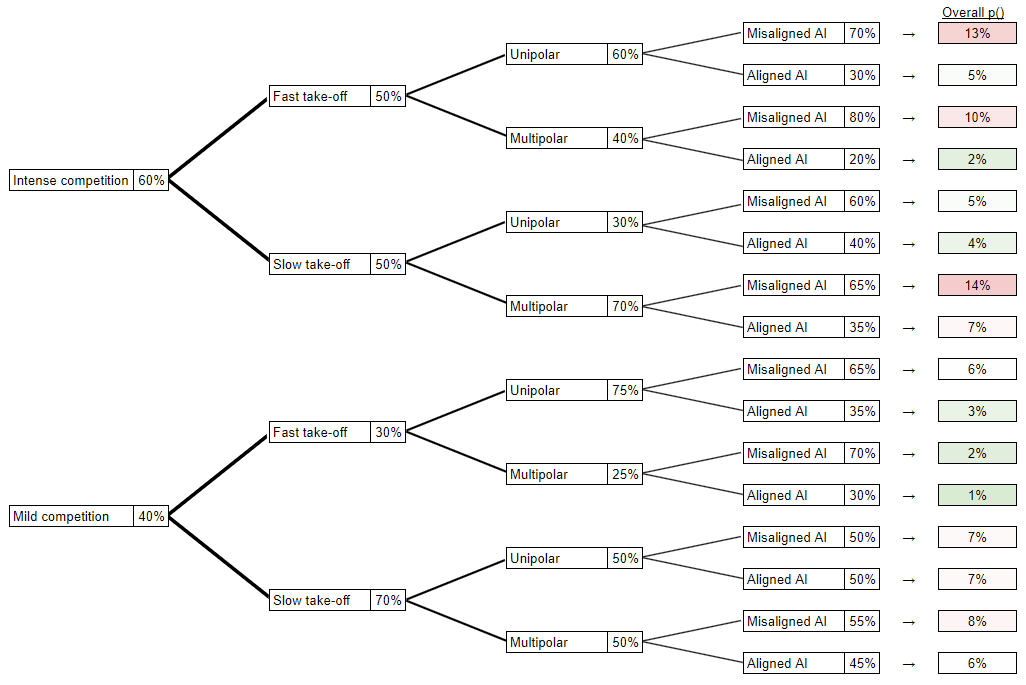
For reference, here are the aggregated probabilities derived from the scenario tree above. Our tree puts more likelihood on intense competitive pressures, slow takeoff, unipolar scenarios, and misaligned AI:
| Intense competitive pressures | 60% | Mild competitive pressures | 40% |
| Fast takeoff | 40% | Slow takeoff | 60% |
| Unipolar | 54% | Multipolar | 46% |
| Misaligned AI | 64% | Aligned AI | 36% |
Table 5
Modeling step 3: estimating probabilities for LoC vs other factors
Given a leaf node (i.e. category of similar AGI-related global catastrophes), this modeling step splits the 100% probability into two groups, following the LoC classification [LW · GW] in the Appendix section:
- p(LoC) i.e. scenarios involving LoC over an AGI system, and
- p(non-LoC) comprising every other scenario not included above
A few high-level remarks:
- The LoC classification suggests that scenarios other than LoC could capture a larger portion of the probability mass of AGI-related catastrophe – what the modeling below looks at is how the probability mass of unrecoverable (i.e. existential) catastrophe splits.
- This is reflected in the granular estimates in Table 6 below, where p(non-LoC) goes up to 99% (in a world with mild competitive pressures, slow takeoff, and aligned unipolar AGI), while p(LoC) only goes up to 70% (because even in a world with intense competitive pressures and fast takeoff leading to multipolar misaligned AGIs, we still think the collective probability of the non-LoC scenarios is nontrivial relative to the LoC scenarios, since the former is very much exacerbated in those conditions; see here [LW · GW] for more discussion)
- We make the assumption that this category split is mutually exclusive – in practice, we might have a complicated mix of e.g. misaligned power-seeking AGI worsening epistemic processes leading to full-scale nuclear war, which our model would simply assign to “LoC - misaligned power-seeking AGI”
- We generally assign higher p(LoC) to these values, all else equal – this does not necessarily mean that p(non-LoC) is reduced in any “real” sense, but rather that we think loss-of-control of AGI system scenarios become likelier to a greater degree than other AGI-related catastrophes; the overall probability of AGI-related catastrophes (as a fraction of all possible futures) may well go up if the following factors are true:
- Intense competition
- Fast takeoff
- Multipolar scenarios
- Misaligned AI
These are our (unweighted) estimates at a granular level:
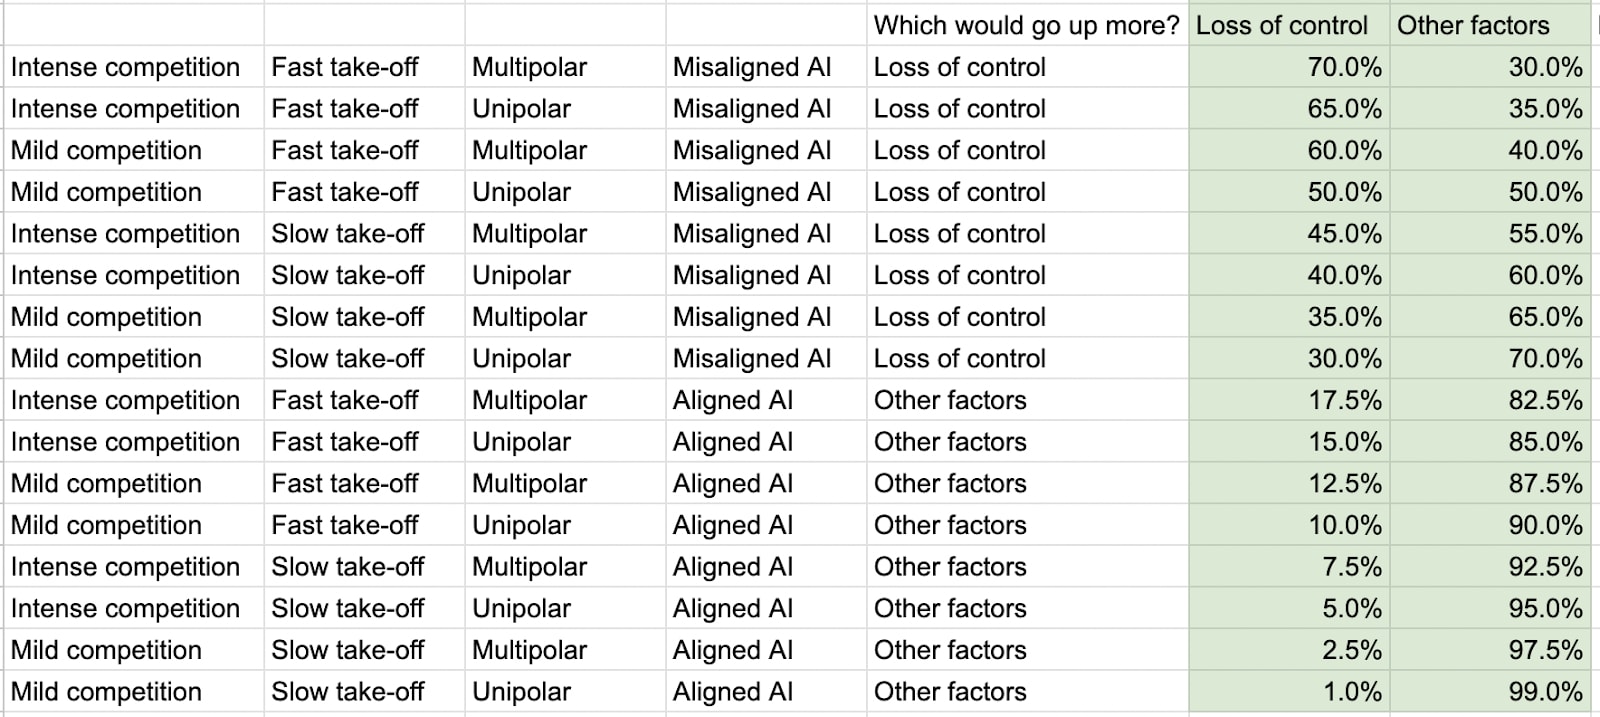
Table 6
Rolling up these granular estimates, we get the following summary table – “scenario weighted” means weighted by the leaf node (i.e. groups of similar scenarios) probabilities in Table 4 in modeling step 2:
| AGI-related catastrophes | LoC scenarios | Non-LoC scenarios |
| Unweighted | 29% | 71% |
| Scenario-weighted | 35% | 65% |
Table 7
While the scenario tree weights LoC scenarios as likelier than non-LoC ones, most of the probability mass of AGI-related catastrophes still comes from the latter, even after scenario-weighting.
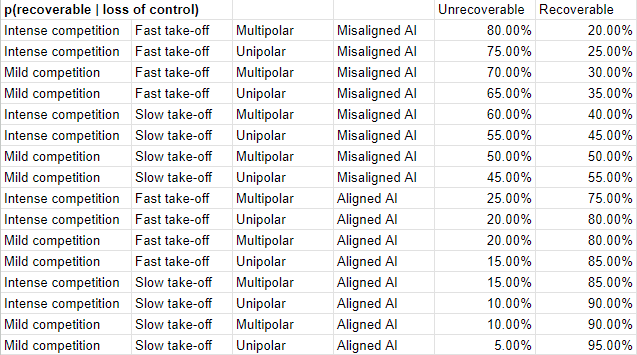
Modeling step 4: estimating recoverability probabilities
Given a leaf node of the scenario tree and whether it’s classified as LoC over the AGI system or not, this modeling step estimates the recoverability of the catastrophe.
At a high level, we have considered the following when we came up with estimates:
- The more intense the competition, the faster the takeoff, the more multipolar, and the more misaligned an AI is, the higher p(unrecoverable) is.
- Note that while the probability of irrecoverability given catastrophe in our model below tops out at 80%, the key takeaway is robust to even more pessimistic parameter choices, e.g. >95% irrecoverability.
- The variance of p(unrecoverable | non-LoC) is smaller.
- We have a higher “floor” of 20% for p(unrecoverable | non-LoC), because we believe that engineered pandemic and nuclear risks exacerbated by in-control AI seem somewhat devastating and more likely. (more [LW · GW])
- We have a lower “ceiling” of 55% for p(unrecoverable | non-LoC), because we think a misaligned AI in control by humanity is likely to have some damage limiting mechanisms in place, as compared to a misaligned AI that humanity has lost control over. (more [LW · GW])
Firstly, here are the granular recoverability probability estimates for LoC scenarios:
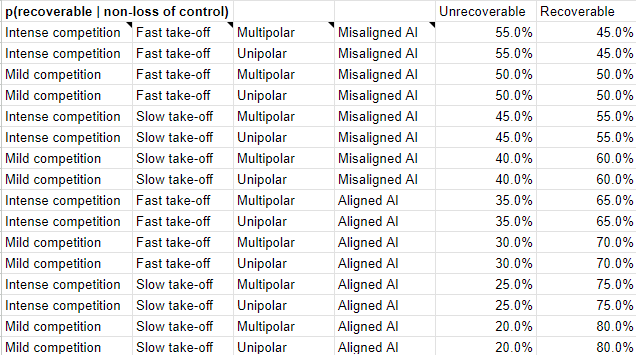
Secondly, here are the same for non-LoC scenarios:
Aggregating these granular estimates, the final probabilities (filling in Table 3.2 above [LW · GW]) are:
| Category | p(LoC → AGI catastrophe) | p(non LoC → AGI catastrophe) | Total p(AGI catastrophe) |
| Unrecoverable | 22% | 23% | 45% |
| Recoverable | 13% | 42% | 55% |
| Total p(AGI catastrophe) | 35% | 65% | 100% |
Table 8
Putting it all together: p(existential catastrophe | LoC) = 5.7% and p(existential catastrophe | non-LoC) = 6.0%
Taking Table 8’s outputs and multiplying by the probability of AGI-driven catastrophe conditional on AGI being developed by 2070 (from this section [LW · GW]) yields our finalized estimates, which recaps Table 1:
Failure mode / recoverability of catastrophe | p(LoC → AGI catastrophe) | p(non LoC → AGI catastrophe) | Total p(AGI catastrophe) |
| Unrecoverable (i.e. existential) | 5.7% | 6.0% | 11.7% |
| Recoverable | 3.3% | 10.9% | 14.3% |
| Total p(AGI catastrophe) | 9.1% | 16.9% | 26.0% |
Table 9 (same as Table 1)
Our total probability of AGI-related existential catastrophe of 11.7% compares well with other estimates:
- Carlsmith (2022) estimates >10% from a single threat model (misaligned power-seeking AI), which in our model is capped to <5%.
- Metaculus estimates 17% x 68% = 12% for all AGI-related existential catastrophes, which is similar to our model.
Conclusion and Recommendations
- Given the numbers above and despite our uncertainties, we think OP should consider broadening their priorities to include non-LoC scenarios (e.g. AI-exacerbated x-risks) as well.
- In particular, we suggest that OP conduct further research into approaches to safeguard against AI-exacerbated development and deployment of full-scale nuclear war (see more potential solutions [EA · GW]) and engineered pandemics (see more potential solution at Section 3).
- Some examples of safeguards against AI-exacerbated nuclear war:
- Pushing for the adoption of a nuclear policy that expands the decision-making time for launching a nuclear weapon, such as by moving away from launch-on-warning (LOW) strategies.
- Pushing for commitment to move away from LOW during peacetime.
- Some examples of safeguards against AI-exacerbated engineered pandemics:
- Stronger regulation to limit the use of AI systems in dual-use research.
- Further develop multilateral governance frameworks related to the production, trade and use of biological weapons
- Some examples of safeguards against AI-exacerbated nuclear war:
- Here are the few cruxes that we think could significantly change things:
- Using probability distributions instead of point estimates for parameter inputs might enable uncertainty analysis that changes outputs enough to invalidate the key takeaway (you can find our spreadsheet here)
- Our estimates have varying quality of evidence to back them up. We might have missed something crucial
- Our estimate of p(AGI-driven catastrophe | AGI developed by 2070) defaulted to a combination of Metaculus’ aggregate predictions and Cotra’s estimates mainly because we did not have time to model them systematically. That said, we don’t think this changes the main recommendation, since the effect is to change all probability estimates by the same multiplier
Appendix
Terminologies
- Existential catastrophe, following Toby Ord in The Precipice, refers to events that ‘drastically reduce the value of the trajectories along which human civilization could realistically develop’. This includes unrecoverable scenarios such as:
- Unrecoverable dystopia: A catastrophe that involves the entirety of humanity, with <50% chance of returning to pre-catastrophe levels within the next 1000 years.
- Unrecoverable civilizational collapse: The absence of any cluster of humans above Minimum Viable Population.
- Extinction: Complete annihilation of humanity. This is the most extreme form of unrecoverable civilizational collapse.
- We use ‘p(existential catastrophe)’ as the cumulative probability that ‘existential catastrophe’ occurs within the next 1000 years.
- We adopt Tom Davidson’s definition [LW · GW] of Artificial General Intelligence (AGI), i.e. an AI that can readily perform 100% of economically-valuable cognitive tasks as well as a human professional, where “AI can readily perform a task” means “performing the task with AI could be done with <1 year of work spent engineering and rearranging workflows, and this would be profitable”.
- We use Paul Christiano’s narrower definition of (intent) alignment, which focuses only on intent / motive instead of including knowledge or ability: an AI is aligned with an operator H if it is trying to do what H wants it to do, even if it might fail by misunderstanding H or failing to recognize that H’s instructions has bad side-effects or interprets H’s instructions overly literally or is simply not competent enough to do the task
- We agree with Richard Ngo [? · GW] that this definition is more useful than the more commonly-used “maximalist” definition of alignment as attempting to make AIs adopt a specific overarching set of values, “because it bundles together technical, ethical and political problems… [and] assumptions about the latter two can significantly reduce clarity about technical issues”
- This implies that our definition of misaligned AI is AI that tries to do things that H wouldn’t want it to do
- Loss of control (LoC) refers to a situation where an agent takes one or more actions in the world where humans were not able to either limit to an acceptable level, intervene and steer away from undesired actions, or stop entirely (more discussion here [LW · GW])
Our model of Open Philanthropy’s views
These are our best guesses as to Open Philanthropy’s views as pertains to Question #2:
- Open Phil focuses on a certain sort of “core” argument: advanced AI agents will be here sooner than we think; they would be very powerful; some of them may have problematic objectives; and they may by default have incentives to disempower humans, which would lead to an existential catastrophe if it’s unintentional, unrecoverable, and morally bad
- Carlsmith (2022) examines a specific version of this: by 2070 it will be possible and financially feasible to built advanced agentic-planning strategically-aware (APS) systems, there will be strong incentives to build and deploy them, the default way to build them would likely result in them seeking and maintaining power in unintended ways due to problematic objectives, some deployed APS systems would be exposed to inputs where power-seeking is damaging, and some of this power-seeking would scale in aggregate to the point of unintentionally permanently disempowering humanity
- Karnofsky (and Cotra) examine an arguably broader version: the long-run future is necessarily radically unfamiliar; a productivity explosion driven by an AI process for automating sci & tech advancement (PASTA) may get us to this radically unfamiliar future faster than we think; PASTA will likely arrive this century; if PASTA is developed using modern deep learning (like many SOTA AIs are today) it is easier to create misaligned systems than aligned ones; misaligned PASTA can make the future go sideways too fast to course-correct
- Both Carlsmith (2022) and Karnosfky [LW · GW] clarify that these arguments are not the only ways to be worried about existential catastrophes resulting from AI, but Carlsmith argues (fn5) that they are core to much of the concern on this topic
- Open Phil’s p(existential catastrophe) varies, but we generally find estimates >10%, consistent with the statement that “Conditional on AGI being developed by 2070, [Open Philanthropy] panelist credences on the probability of existential catastrophe range from ~5% to ~50%.”
- Carlsmith (2022) has p(existential catastrophe by 2070 | misaligned power-seeking AI) > 10%
- Note that Carlsmith’s version of the story conditions on power-seeking behavior, hence excluding other LoC scenarios
- Carlsmith also notes that his estimate is for 2070 in particular: “later dates, or conditioning on the development of sufficiently advanced systems, would bump them up”
- Combination of other Open Philanthropy’s researchers to arrive at p(AI-related existential catastrophe by 2070) > 25%
- Ajeya Cotra estimates p(TAI by 2050) = ~60% [LW · GW]; Carlsmith (2022) notes in Section 2.2 that p(TAI by 2070) >65%
- Conditioning on TAI, Tom Davidson’s probability of “takeoff from AI that can automate 20% of cognitive tasks to AI that could readily automate 100% of cognitive tasks” within 10 years is >80% [LW · GW]
- Holden Karnofsky opines that it is plausible for AIs to defeat all of us combined. Let’s assume this translates to a probability of >50%
- Given these premises and the conjunctive relation between these claims, p(AI-related existential catastrophe by 2070) >25%
- Carlsmith (2022) has p(existential catastrophe by 2070 | misaligned power-seeking AI) > 10%
What counts as ‘loss of control’
There are many AI x-risk sources and even more existential threat models; calculating p(existential catastrophe | LoC) requires us to classify AI x-risk sources as LoC vs non-LoC. Using Sam Clarke’s writeup [EA · GW] as a starting point, we adopt the following classification:
- Loss of control
- Misaligned power-seeking AGI (e.g. Carlsmith 2022) – some examples:
- Bostrom’s outer misaligned brain-in-a-box scenario described in Superintelligence
- Yudkowsky’s inner misaligned brain-in-a-box scenario (“squiggle maximizer [? · GW]”)
- Daniel Kokotajlo’s soft takeoff can still lead to DSA [LW · GW]
- Misaligned AGI scenarios that don’t necessarily involve power-seeking – some examples:
- Critch’s Production Web [LW · GW]
- Critch’s flash economy [LW · GW]
- Christiano’s you get what you measure [LW · GW]
- Christiano’s another alignment failure story [LW · GW]
- Rapid unintentional escalation (and other new more catastrophic sources of error) due to AI-enabled automated military decision-making
- …
- Misaligned power-seeking AGI (e.g. Carlsmith 2022) – some examples:
- Non-loss of control: entails malintent or misuse of an AI system controlled by humanity
- Increasing global catastrophic biorisk (more)
- Increasing risk of full-scale nuclear war (more)
- Increasing both likelihood and severity of conflict, e.g. by enabling the development of new WMDs, or influencing the geopolitical strategic decision landscape in a way that makes conflict more likely
- Rapid intentional increase in escalation due to accelerating build-up of WMD arsenal due to AGI embedded inside manufacturing processes of WMDs
- Worsening epistemic processes, e.g. by enabling groups to misuse AI-developed persuasion tools to gain influence, or generally reducing trust in information thereby hampering coordination and collective action
- Stable totalitarianism: enabling a small group of people to obtain and maintain unprecedented levels of power; especially risky in the context of digital people
- “Lame” future: locking in “lame” choices of features of the world (e.g. values and norms, governance structures) falling short of humanity’s future potential
- Value erosion due to AGI-exacerbated competitive & evolutionary pressures overwhelming humanity’s ability to steer the future
- …
We broadly agree with the discussion in Section 7 of Carlsmith (2022) that
- It’s possible to consider scenarios involving humanity’s permanent and unintentional disempowerment at the hands of AI systems that are nonetheless not existentially catastrophic, e.g. intelligent agents might converge on various forms of cooperative game-theoretic behavior and self-modification, providing reason for optimism
- That said, these optimistic scenarios are very unlikely – Carlsmith assigns 95% in his original estimate, before revising p(existential catastrophe) upwards (which suggests that this parameter estimate may have gone up as well)
p(AGI-driven catastrophe | AGI by 2070)
The following are factors that we think if true, would likely increase p(AGI-driven catastrophe | AGI by 2070):
- Disjunctivity [LW · GW] - framing the estimation of a certain probability in a way that involves fewer conditions that must hold true
- Warning shots - being present but do not necessarily trigger meaningful actions that reduce x-risks, or being absent entirely
- Shorter timelines - which may be caused by algorithmic improvements, other forms of recursive improvements, availability of compute, proliferation of open-sourced AGI research, or even sheer luck
The following are factors that we think if true, would likely decrease p(AGI-driven catastrophe | AGI by 2070):
- Instrumental convergence - where the incentive of pursuing instrumentally convergent goals do not necessarily imply that an agent will in fact pursue them
- Countermeasures - which may be caused by improved coordination in slowing down AI progress, or effective policies regulating large AI labs
- Longer timelines - which may be caused by a slowing of AI advances, or unexpected barriers in creating AGI
Competition intensity
“Intense competition” refers to a scenario where for a duration of more than a year, the involved parties adopt a “win at all costs” strategy. On the other hand, “mild competition” refers to scenarios that don’t involve a “winning at all costs” strategy.
We’ve categorized the parties into two groups:
- AI labs
- Nation-states
Examples of what it means to “win at all costs”:
- AI labs might raise a large pool of funds or allocate a greater proportion of their R&D resources towards improving AI capabilities. Additionally, they could be imposing longer working hours.
- Similar to the intensity seen during the Space Race or wartime scenarios, nation-states could potentially dedicate more than 1% of their GDP towards AI R&D.
Do we expect AI labs or nation-states to adopt a “win at all costs” strategy in 2070?
Let’s start with AI labs.
| Metric | Evidence | More confidence that there will likely be intense competition? |
| Historical gap between release of state of the art (SOTA) AI product and second place in terms of computation used | The median gap is 0.6 and 0.74 years (see more [LW · GW]) | The gap seems pretty small, hence we’re slightly more confident here. |
| Gap between current most powerful LLMs (e.g. ChatGPT, Claude, Bard) | 0.5 years | The gap seems pretty small, hence we’re slightly more confident here. |
| Number of competitors | 4-6 competitors (e.g. OpenAI/Microsoft, Google/Deepmind, Anthropic, Meta, Baidu, HuggingFace) | The number seems pretty low, hence we’re slightly less confident here. |
| Size of economic moat | A leaked internal memo from Google suggests that open source AI products might outcompete Google or OpenAI | There is a possibility that the moat is smaller, but we’re not totally convinced, hence we’re slightly more confident here. |
| Funds raised | 26.7% decrease in private investment from 2021 to 2022, but the overall trend seems to be positive OpenAI raised $10.3B in the last 4 months | We’re slightly more confident here. |
| Adoption rate | ChatGPT got 100 million users in 2 months (fastest ever) There’s also a large historical reference class of businesses who failed to adopt new technology fast enough (e.g. Blockbuster vs Netflix, Borders vs Amazon, Blackberry vs Apple/Google, Kodak vs Canon/Sony) | We’re slightly more confident here. |
| Product release cycles | Uncertain | |
| Profit margin | Uncertain | |
| Working hours | Uncertain |
Despite the above evidence pointing towards increasing competition between AI labs, we still feel very uncertain whether AI labs will adopt a “win at all cost” strategy. What would make us feel more confident? We think we’ll need to see the following evidence:
- Extremely long working hours for the majority of employees in AI labs for >1 year.
- Extremely cut-throat pricing (e.g. an AI lab releasing a free version of a SOTA AI product).
Next, let’s explore competition between nation-states.
| Metric | Evidence | More confidence that there will likely be intense competition? |
| Government expenditure in AI as % of GDP | There’s a trend in the US government of increasing spending in:
There’s a mixed trend in releases of AI national strategies. | We’re slightly confident here. |
| Foreign policy moves | US chip ban to China | We’re slightly confident here. |
| Regulatory moves | The number of AI-Related bills that passed into law has a positive trend, going from 6 bills in 2016 to 37 in 2022. | We’re slightly confident here. |
| Talent and migration | Uncertain | |
| Research output | Uncertain |
Despite the uncertainty, we think it’s more likely than not that nation-states (particularly US and China) will adopt a “win at all cost” strategy when it comes to AI capabilities. We would feel more confident if we have evidence that the US and Chinese governments’ respective expenditure in AI supasses 1% of GDP in a single year.
Gap between SOTA and second place
In terms of computation in petaFLOP
| 2nd place | SOTA | Gap in years |
| NPLM | Word2Vec (large) | 10.74 |
| Word2Vec (large) | RNNsearch-50* | 0.89 |
| RNNsearch-50* | Seq2Seq LSTM | 0.03 |
| Seq2Seq LSTM | GNMT | 2.08 |
| GNMT | T5-11B | 3.12 |
| T5-11B | GPT-3 175B (davinci) | 0.61 |
| GPT-3 175B (davinci) | AlphaCode | 0.15 |
| AlphaCode | Chinchilla | 0.02 |
| Chinchilla | PaLM (540B) | 0.24 |
Median gap in years | 0.74 | |
Median gap in years if NPLM is removed | 0.60 | |
Polarity
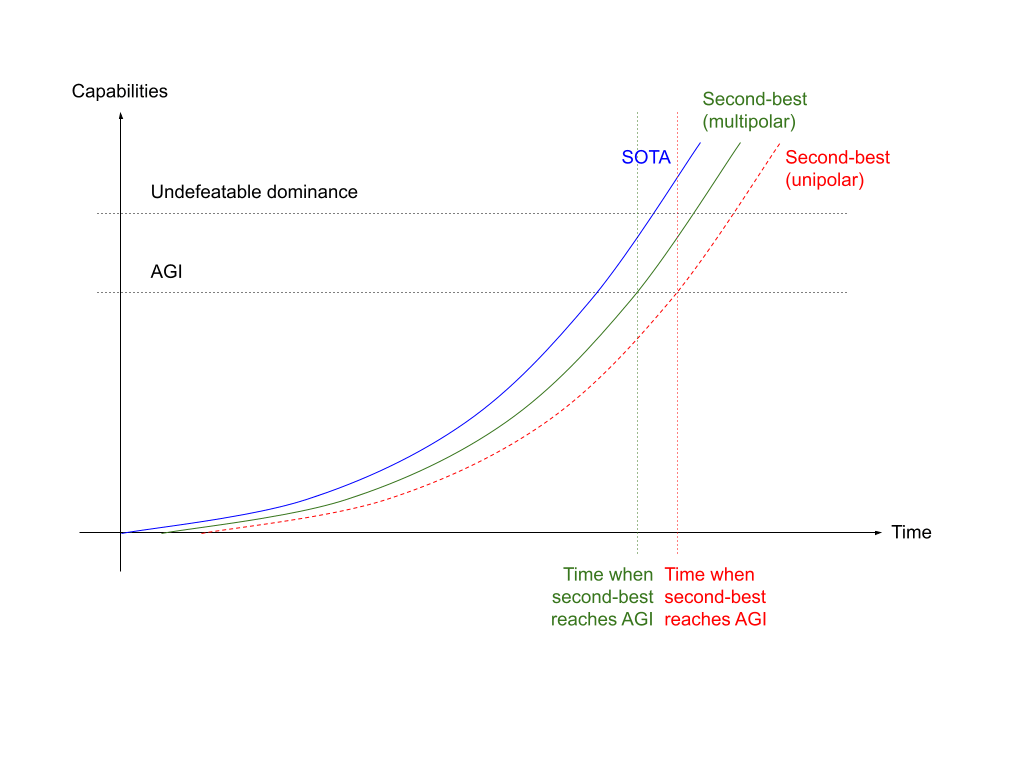
In the diagram above, the curved lines represent the rate of capabilities advances of AI systems, where the blue line represents that of the state-of-the-art (SOTA), while the green solid line and the red dotted line represents that of a potential second-best competitor.
We posit that when an AI achieves AGI, it would yet to assume dominance over the world. Subsequently, when an AI achieves superintelligence, where it is much more powerful than an AGI, it would likely be able to assume dominance over the world and hinder other AGIs from being developed - if they have yet to exist. In the diagram, the gradient of the curve between ‘AGI’ and ‘undefeatable dominance’ loosely corresponds to its takeoff speed.
In the scenario where the second-best AI (green solid line in the diagram) achieves AGI before the SOTA achieves undefeatable dominance, the world would end up in a multipolar scenario, where more than one AGI system exists simultaneously. On the other hand, in the scenario where the second-best AI (dotted red line in the diagram) develops at a pace where it is on track to achieve AGI after the SOTA achieves undefeatable dominance, it will in fact never reach AGI, and the world would end up in a unipolar scenario. As an example, in a fast-takeoff world where the SOTA achieves undefeatable dominance <1 year after achieving AGI, while the second-best is constantly lagging behind by more than 1 year, the world would likely end up in a unipolar scenario.
p(existential catastrophe | non-LoC)
Engineered pandemic
How likely will the use of in-control AGI increase the likelihood of an engineered pandemic?
We think this seems very likely. It seems like there are already use cases for current ML algorithms in DNA sequencing and DNA expressions analysis (O'Brien and Nelson, 2020; Sawaya et al, 2020; Brockmann, 2019; Oliveira, 2019).
[EDIT: Soice et al, 2023]
We’re unsure whether current ML algorithms could also conduct genetic editing or de novo DNA synthesis, as well as strategic deployment, but we think this might be plausible for more advanced AI systems.
Although this isn’t technically related to genetic engineering, we think AI advances in protein folding (in particular AlphaFold) might plausibly increase this risk too.
How unrecoverable would an engineered pandemic enabled by an in-control AGI be?
We think it’s quite likely that an AGI would be capable enough to do the following:
- High transmissibility and mortality rate
- A long asymptomatic infectious period
- High resistance towards antivirals or antibiotics
- Multiple strains are deployed in parallel
- Multiple pathogens are developed that target different groups: humans, agriculture, and ecology.
- Pathogens are deployed at strategic locations
Furthermore, we think reducing humanity’s population size by 95% is enough to cause a civilisation collapse due to a lack of easy-to-extract fossil fuels that don’t require heavy machinery.
Given the above reasons, we think it’s possible that (even if one single strain of highly optimized pathogen is released accidentally) p(unrecoverable | non-LoC) is non-trivially high.
Wouldn’t the use of in-control AGI to defend against engineered pandemic reduce p(unrecoverable)?
Yes, we agree, but we think there’s an asymmetry between the “attacking” party and the “defending” party, where the attacking party has a much bigger upper hand compared to the defending party.
Nuclear winter
How likely will the use of in-control AGI increase the likelihood of a nuclear winter?
Rodriguez (2019) [? · GW] estimates that there’s a 0.38% chance of a US-Russia nuclear exchange each year and a 11% chance that a severe nuclear winter will happen given a US-Russia nuclear exchange. According to Rautenbach (2023) [EA · GW] and Aird and Aldred (2023) [EA · GW], we think that the use of in-control AGI will likely increase Rodriguez’s estimates considerably.
3 comments
Comments sorted by top scores.
comment by Davidmanheim · 2023-07-12T10:31:17.440Z · LW(p) · GW(p)
A few brief notes.
1. Openphil's biosecurity work already focuses on AIxBio quite a bit.
2. re: engineered pandemics, I think the analysis is wrong on several fronts, but primarily, it seems unclear how AI making a pandemic would differ from the types of pandemic we're already defending against, and so assuming no LoC, typical biosecurity approaches seem fine.
3. Everyone is already clear that we want AI away from nuclear systems, and I don't know that there is anything more to say about it, other than focusing on how little we understand Deep Learning systems and ensuring politicians and others are aware.
4. This analysis ignores AIxCybersecurity issues, which also seem pretty important for non-LoC risks.
↑ comment by Yi-Yang (yiyang) · 2023-07-27T02:09:48.300Z · LW(p) · GW(p)
Hey David, thanks for the feedback!
1. I did look at Openphil’s grant database back in May and found nothing. Could you point where we could find more information about this?
2. Hmm are you saying an AI-engineered pandemic would likely be similar to natural pandemics we’re already defending against? If so, I would probably disagree here. I’m also unsure how AI-engineered pandemics might create highly novel strains, but I think the risk of this happening seems non-trivial.
And wouldn’t AI accelerate such developments as well?
3. Thanks for the info! I don’t think we have access to a lot of personal views of researchers besides what we’ve seen in literature.
4. Ah did you mean AI x Cybersecurity x Non-LOC risks? That sounds right. I don't think we've actually thought about this.
Reflecting on this, it feels like we could have done better if we spoke to at least a few researchers instead of depending so much on lit reviews.
Replies from: Davidmanheim↑ comment by Davidmanheim · 2023-07-29T18:32:45.038Z · LW(p) · GW(p)
- The grants are to groups and individuals doing work in this area, so it encompasses much of the grants that are on biorisk in general - as well as several people employed by OpenPhil doing direct work on the topic.
- I'm saying that defense looks similar - early detection, quarantines, contact tracing, and rapid production of vaccines all help, and it's unclear how non-superhuman AI could do any of the scariest things people have discussed as threats.
- Public statements to the press already discuss this, as does some research.
- Yes, and again, I think it's a big deal.
And yes, but expert elicitation is harder than lit reviews.