Cognitive Risks of Adolescent Binge Drinking
post by Elizabeth (pktechgirl), Martin Bernstorff (martin-bernstorff) · 2022-07-20T21:10:01.513Z · LW · GW · 12 commentsContents
  The takeaway
  Motivation
  Problems with research on drinking during adolescence
    Triangulation
      Randomized abstinence studies
      Observational studies on humans
      Observational studies on alcohol for infants
      Rodents
  Conclusion
None
12 comments
The takeaway
Our goal was to quantify the cognitive risks of heavy but not abusive alcohol consumption. This is an inhernetly difficult task: the world is noisy, humans are highly variable, and institutional review boards won’t let us do challenge trials of known poisons. This makes strong inference or quantification of small risks incredibly difficult. We know for a fact that enough alcohol can damage you, and even levels that aren’t inherently dangerous can cause dumb decisions with long term consequences. All that said… when we tried to quantify the level of cognitive damage caused by college level binge drinking, we couldn’t demonstrate an effect. This doesn’t mean there isn’t one (if nothing else, “here, hold my beer” moments are real), just that it is below the threshold detectable with current methods and levels of variation in the population.
Motivation
In discussions with recent college graduates I (Elizabeth) casually mentioned that alcohol is obviously damaging to cognition. They were shocked and dismayed to find their friends were poisoning themselves, and wanted the costs quantified so they could reason with them (I hang around a very specific set of college students). Martin Bernstorff and I set out to research this together. Ultimately, 90-95% of the research was done by him, with me mostly contributing strategic guidance and somewhere between editing and co-writing this post.
 I spent an hour getting DALL-E to draw this
Problems with research on drinking during adolescence
Literature on the causal medium- to long-term effects of non-alcoholism-level drinking on cognition is, to our strong surprise, extremely lacking. This isn’t just our poor research skills; in 2019, the Danish Ministry of Health attempted a comprehensive review and concluded that:
“We actually know relatively little about which specific biological consequences a high level of alcohol intake during adolescence will have on youth”.
And it isn’t because scientists are ignoring the problem either. Studying medium- and long-term effects on brain development is difficult because of the myriad of confounders and/or colliders for both cognition and alcohol consumption, and because more mechanist experiments would be very difficult and are institutionally forbidden anyway (“Dear IRB: we would like to violently poison some teenagers for four years, while forbidding the other half to engage in standard college socialization”). You could randomize abstinence, but we’ll get back to that.
One problem highly prevalent in alcohol literature is the abstinence bias. People who abstain from alcohol intake are likely to do so for a reason, for example chronic disease, being highly conscientious and religious, or a bad family history with alcohol. Even if you factor out all of the known confounders, it’s still vanishingly unlikely the drinking and non-drinking samples are identical. Whatever the differences, they’re likely to affect cognitive (and other) outcomes.

Any analysis comparing “no drinking” to “drinking” will suffer from this by estimating the effect of no alcohol + confounders, rather than the effect of alcohol. Unfortunately, this rules out a surprising number of studies (code available upon request).
Confounding is possible to mitigate if we have accurate intuition about the causal network, and we can estimate the effects of confounders accurately. We have to draw a directed acyclic graph with the relevant causal factors and adjust analyses or design accordingly. This is essential, but has not permeated all of epidemiology (yet), and especially for older literature, this is not done. For a primer, Martin recommends “Draw Your Assumptions” on edX here.
Additionally, alcohol consumption is a politically live topic, and papers are likely to be biased. Which direction is a coin flip: public health wants to make it seem scarier, alcohol companies want to make it seem safer. Unfortunately, these biases don’t cancel out, they just obfuscate everything.
What can we do when we know much of the literature is likely biased, but we do not have a strong idea about the size or direction?
Triangulation
If we aggregate multiple estimates that are wrong, but in different (and overall uncorrelated) directions, we will approximate the true effect. For health, we have a few dimensions that we can vary over: observational/interventional, age, and species.
Randomized abstinence studies
Ideally, we would have strong evidence from randomized controlled trials of abstinence. In experimental studies like this, there is no doubt about the direction of causality. And, since participants are randomized, confounders are evenly distributed between intervention and control groups. This means that our estimate of the intervention effect is unbiased by confounders, both measured and unmeasured.
However, we were only able to find two such studies, both from the 80s, among light drinkers (mean 3 standard units per week), and of a duration of only 2-6 weeks (Bimbaum et al., 1983; Hannon et al., 1987).
Bimbaum et al. did not stick to the randomisation when analyzing their data, opening the door to confounding:
Which should decrease our confidence in their study. They found no effect of abstinence on their 7 cognitive measures.
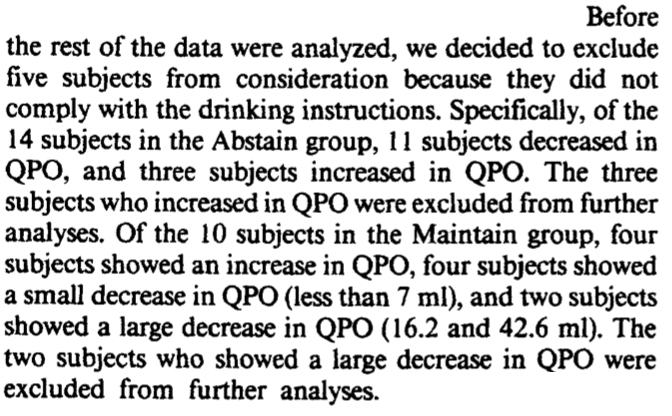
In Hannon et al., instruction to abstain vs. maintain resulted in a difference in alcohol intake of 12.5 units pr. week over 2 weeks. On the WAIS-R vocabulary test, abstaining women scored 55.5 ± 6.7 and maintaining women scored 51.0 ± 8.8 (both mean ± SD). On the 3 other cognitive tests performed, they found no difference.
Especially due to the short duration, we should be very wary of extrapolating too much from these studies. However, it appears that for moderate amounts of drinking over a short time period, total abstinence does not provide a meaningful benefit in the above studies.
Observational studies on humans
Due to their observational nature (as opposed to being an experiment), these studies are extremely vulnerable to confounders, colliders, reverse causality etc. However, they are relatively cheap ways of getting information, and are performed in naturalistic settings.
One meta-analysis (Neafsey & Collins, 2011) compared moderate social drinking (< 4 drinks/day) to non-drinkers (note: the definition of moderate varies a lot between studies). They partially compensated for the abstinence bias by excluding “former drinkers” from their reference group, i.e. removing people who’ve stopped drinking for medical (or other) reasons. This should provide a less biased estimate of the true effect. They found a protective effect of social drinking on a composite endpoint, “cognitive decline/dementia” (Odds Ratio 0.79 [0.75; 0.84]).
Interestingly, they also found that studies adjusting for age, education, sex and smoking-status did not have markedly different estimates from those that did not (ORadjusted 0.75 vs. ORun-adjusted 0.79). This should decrease our worry about confounding overall.
Observational studies on alcohol for infants
Another angle for triangulation is the effect of moderate maternal alcohol intake during pregnancy on the offspring’s IQ. The brain is never more vulnerable than during fetal development. There are obviously large differences between fetal and adolescent brains, so any generalization should be accompanied with large error bars. However, this might give us an upper bound.
(Zuccolo et al., 2013) perform an elegant example of what’s called Mendelian randomization.
A SNP variant in a gene (ADH1B) is associated with decreased alcohol consumption. Since SNP are near-randomly assigned (but see the examination of assumptions below), one can interpret it as the SNP causing decreased alcohol consumption. If some assumptions are met, that’s essentially a randomized controlled trial! Alas, these assumptions are extremely strong and unlikely to be totally true – but it can still be much better than merely comparing two groups with differing alcohol consumption.

As the authors very explicitly state, this analysis assumes that:
1. The SNP variant (rs1229984) decreases maternal alcohol consumption. This is confirmed in the data. Unfortunately, the authors do this by chi-square test (“does this alter consumption at all?”) rather than estimating the effect size. However, we can do our own calculations using Table 5:

If we round each alcohol consumption category to the mean of its bounds (0, 0.5, 3.5, 9), we get a mean intake in the SNP variant group of 0.55 units/week and a mean intake in the non-carrier of 0.88 units/week (math). This means that SNP-carrier mothers drink, on average, 0.33 units/week less. That’s a pretty small difference! We would’ve liked the authors to do this calculation themselves, and use it to report IQ-difference per unit of alcohol per week.
2. There is no association between the genotype and confounding factors, including other genes. This assumption is satisfied for all factors examined in the study, like maternal age, parity, education, smoking in 1st trimester etc. (Table 4), but unmeasured confounding is totally a thing! E.g. a SNP which correlates with the current variant and causes a change in the offspring’s IQ/KS2-score.
3. The genotype does not affect the outcome by any path other than maternal alcohol consumption, for example through affecting metabolism of alcohol.
If we believe these assumptions to be true, the authors are estimating the effect of 0.33 maternal alcohol units per week on the offspring’s IQ and KS2-score. KS2-score is a test of intellectual achievement (similar to the SAT) for 11-year-olds with a mean of 100 points and a standard deviation of ~15 points.
They find that the 0.33 unit/week decrease does not affect IQ (mean difference -0.01 [-2.8; 2.7]) and causes a 1.7 point (with a 95% confidence interval of between 0.4 and 3.0) increase in KS2 score.
This is extremely interesting. Additionally, the authors complete a classical epidemiological study, adjusting for typical confounders:
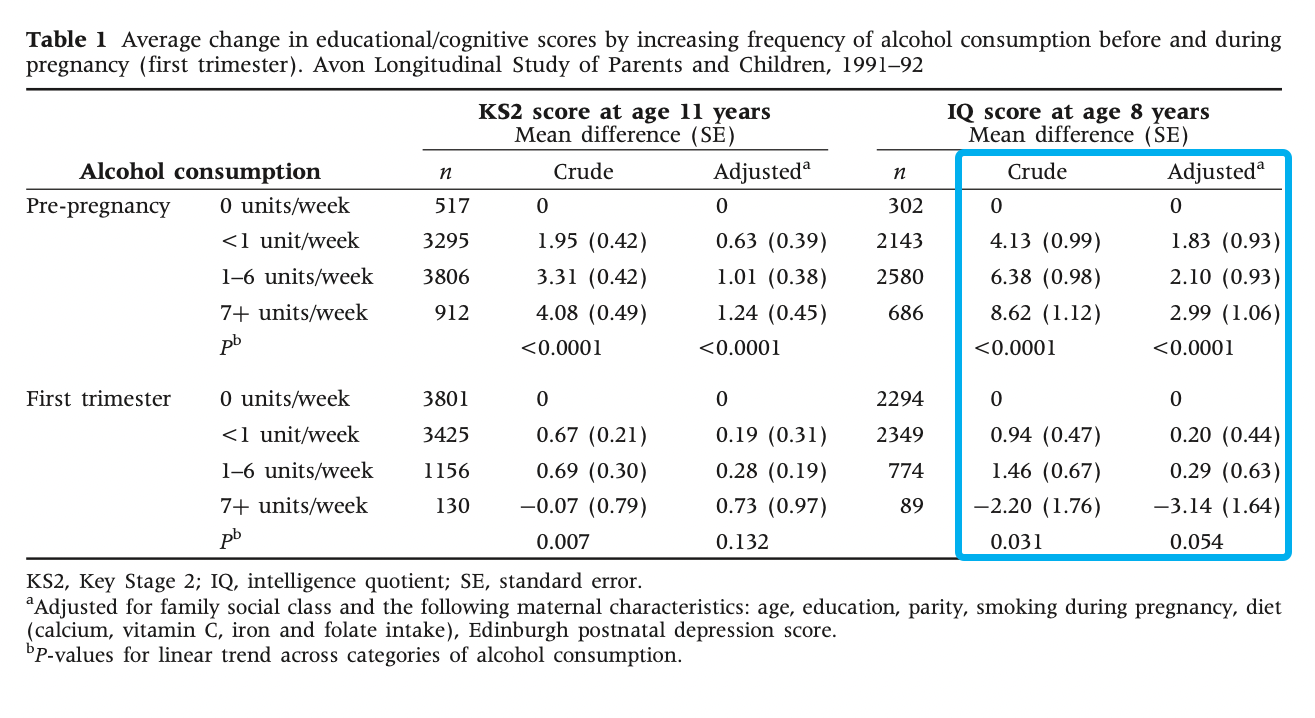
This shows that the children of pre-pregnancy heavy drinkers, on average, scored 8.62 (with a standard error of 1.12) points higher on IQ than non-drinkers, 2.99 points (SE 1.06) after adjusting for confounders. However, they didn’t adjust for alcohol intake in other parts of the pregnancy! Puzzlingly, first trimester drinking has an effect in the opposite direction: -3.14 points (SE 1.64) on IQ. However, this was also not adjusted for previous alcohol intake. This means that the estimates in table 1 (pre-pregnancy and first trimester) aren’t independent, but we don’t know how they’re correlated. Good luck teasing out the causal effect of maternal alcohol intake and timing from that.
Either way, the authors (and I) interpret the effects as being highly confounded; either residual (the confounder was measured with insufficient accuracy for complete adjustment) or unknown (confounders that weren’t measured). For example, pre-pregnancy alcohol intake was strongly associated with professional social class and education (upper-class wine-drinkers?), whereas the opposite was true for first trimester alcohol intake. Perhaps drinking while you know you’re pregnant is low social status?
If you’re like Elizabeth you’re probably surprised that drinking increases with social class. I didn’t dig into this deeply, but a quick search found that it does appear to hold up.
This result is in conflict with that of the Mendelian randomization, but it makes sense. Mendelian randomization is less sensitive to confounding, so maybe there is no true effect. Also, the study only estimated the genetic effect of a 0.33 units/week difference, so the analyses are probably not sufficiently powered.
Taken together, the study should probably update towards a lack of harm from moderate (whatever that means) levels of alcohol intake, although how big an update that is depends on your previous position. We say “moderate” because fetal alcohol syndrome is definitely a thing, so at sufficient alcohol intake it’s obviously harmful! .
Rodents
There is a decently sized, pretty well-conducted literature on adolescent intermittent ethanol exposure (science speak for “binge drinking on the weekend”). Rat adolescence is somewhat similar to human adolescence; it’s marked by sexual maturation, increased risk-taking and increased social play (Sengupta, 2013). The following is largely based on a deeper dive into the linked references from (Seemiller & Gould, 2020).
Adolescent intermittent ethanol exposure is typically operationalised as a blood-alcohol concentration of ~10 standard alcohol units, 0.5-3 times/day every 1-2 days during adolescence.
To interpret this, we make some big assumptions. Namely:
- Rodent blood-alcohol content can be translated 1:1 to human
- Effects on rodent cognition at a given alcohol concentration are similar to those on human cognition
- Rodent adolescence can mimic human adolescence
Now, let’s dive in!
Two primary tasks are used in the literature:
The 5-choice serial reaction time task.
Rodents are placed in a small box, and one of 5 holes is lit up. Rodents are measured at how good they are at touching the hole.
Training in the 5-CSRTT varies between studies, but the two studies below consist of 6 training sessions at age 60 days. Initially, rats were rewarded with pellets from the feeder in the box to alert them to the possibility of reward.
Afterwards, training sessions had gradually increasing difficulty. To begin with, the light stays on for 30 seconds to start, but the duration gradually decreases to 1 second. Rats progressed to the next training schedule based on either of 3 predefined criteria: 100 trials completed, >80% accuracy or <20% omissions.
Naturally, you can measure a ton of stuff here! Generally, focus is on accuracy and omissions, but there are a ton of others:

From (Boutros et al., 2017) sup. table 1, congruent with (Semenova, 2012).
Now we know how they measured performance; but how did they imitate adolescent drinking?
Boutros et al. administered 5 g/kg of 25% ethanol through the mouth once per day in a 2-day on/off pattern, from age 28 days to 57 days – a total of 14 administrations. Based on blood alcohol content, this is equivalent to 10 standard units at each administration – quite a dose! Surprisingly, they found a decrease in omissions with the standard task, but no other systematic changes, in spite of 50+ analyses on variations of the measures (accuracy, omissions, correct responses, incorrect responses etc.) and task difficulty (length of the light staying on, whether they got the rats drunk etc.). We’d chalk this up to a chance finding.
Semenova et al. used the same training schedule, but administered 5 g/kg of 25% ethanol through the mouth every 8h for 4 days – a total of 12 administrations. They found small differences in different directions on different measures, but have the same multiple comparisons problem. Looks like noise to us.

The Barnes Maze
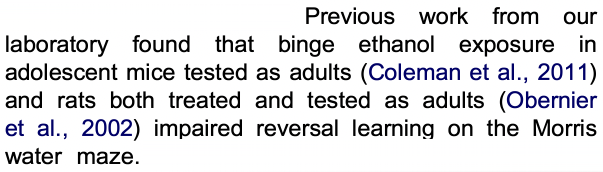
Rodents are placed in the middle of an approximately 1m circle with 20-40 holes at the perimeter and are timed on how quickly they arrive at the hole with a reward (and escape box) below it. For timing spatial learning, the location of the hole is held constant. In (Coleman et al., 2014) and (Vetreno & Crews, 2012), rodents were timed once a day for 5 days. They were then given 4 days of rest, and the escape hole was relocated exactly 180° from the initial location. They were then timed again once a day, measuring relearning.
Figure: Tracing of the route taken by a control mouse right after the location was reversed, from Coleman et al., 2014.

Both studies found no effect of adolescent intermittent ethanol exposure on initial learning rate or errors.
Vetreno found alcohol-exposed rats took longer to escape on their first trial but did equally well in all subsequent trials:

Whereas Coleman found a ~3x difference in performance on the relearning task, with similar half-times:

Somewhat suspiciously, even though Vetreno et al. is performed 2 years later than Coleman et al. and they share the same lab, they do not reference Coleman et al..
This does, technically, show an effect. However given the small size of effect, the number of metrics measured, file drawer effects, and the disagreement with the rest of the literature, we believe this is best treated as a null result.
Conclusion
So, what should we do? From the epidemiological literature, if you care about dementia risk, it looks like social drinking (i.e. excluding alcoholics) reduces your risk by ~20% as compared to not drinking. All other effects were part of a heterogenous literature with small effect sizes on cognition. Taking together, long-term cognitive effects of conventional alcohol intake during adolescence should play only a minor role in determining alcohol-intake.
Thanks to an FTX Future Fund regrantor for funding this work.
12 comments
Comments sorted by top scores.
comment by trevor (TrevorWiesinger) · 2022-07-20T22:23:50.727Z · LW(p) · GW(p)
It makes sense that this investigation is valuable to do (and therefore worth of funding), since so many important people consume alcohol.
In that same vein, do you think you could also do a study on Long Covid to estimate the odds of permanent cognitive dysfunction? Covid is infecting nearly everyone, and many articles indicate that long covid is extremely common and that congitive dysfunction is extremely common in Long Covid. I also have never come across any papers concluding that cognitive dysfunction is unlikely, or negligible in any way.
Replies from: Jackson Wagner↑ comment by Jackson Wagner · 2022-07-21T00:23:14.274Z · LW(p) · GW(p)
You are in luck; it would appear that Elizabeth has already produced some significant long-covid analysis of exactly this nature! [LW · GW]
Replies from: TrevorWiesinger, lc↑ comment by trevor (TrevorWiesinger) · 2022-07-21T01:34:08.194Z · LW(p) · GW(p)
I was hoping more for something based on the current strains. I know that's a lot to ask for though, since they change so frequently.
Replies from: pktechgirlcomment by tailcalled · 2022-07-21T07:47:00.888Z · LW(p) · GW(p)
Alas, these assumptions are extremely strong and unlikely to be totally true – but it can still be much better than merely comparing two groups with differing alcohol consumption.
It can also be much worse than just comparing the two groups. In fact the degree to which it can get worse exceeds the degree to which it can get better, so unless one has good reason otherwise, one should not do this.
Replies from: pktechgirl↑ comment by Elizabeth (pktechgirl) · 2022-07-21T20:02:37.151Z · LW(p) · GW(p)
Can you expand on this?
Replies from: tailcalled↑ comment by tailcalled · 2022-07-22T17:22:03.828Z · LW(p) · GW(p)
Sure.
Probably the easiest way to talk about it is using standardized effect sizes, i.e. multiplying and dividing the effects with the population standard deviations to end up with unitless numbers.
If you've got a causal chain, e.g. SNP -> alcohol consumption -> IQ, and this causal chain is the only thing linking the variables together (no confounding or alternative mechanisms or reverse causation), then the correlation between variables in the chain is computed by multiplying the effects together along the chain. For instance, if we let r(X, Y) denote the correlation between X and Y, and e(X, Y) denote the standardized effect of X on Y, then we have:
r(SNP, IQ) = e(SNP, alcohol consumption) * e(alcohol consumption, IQ)
Now, the basic principle of Mendelian randomization is that under appropriate circumstances, r(SNP, X) = e(SNP, X). So we can rearrange the equation above to get:
e(alcohol consumption, IQ) = r(SNP, IQ)/r(SNP, alcohol consumption)
This is essentially how the MR (and other IV) effect size estimates are computed (though they may use fancier math for various reasons).
Now, the first thing that should make you uncomfortable here is that you are dividing by a very small number, r(SNP, alcohol consumption). But what effects could that have? Well, let us for a moment imagine that the effect actually goes in the opposite direction, so SNP -> IQ -> alcohol consumption (possibly unlikely in this case for mechanistic reasons, but the point is that one should always discuss those mechanistic reasons). Then the previous estimate reduces to:
r(SNP, IQ)/r(SNP, alcohol consumption) = e(SNP, IQ)/(e(SNP, IQ)*e(IQ, alcohol consumption)) = 1/e(IQ, alcohol consumption)
Most effect sizes in social science tend to be fairly small, so e(IQ, alcohol consumption) is probably also small, and therefore 1/e(IQ, alcohol consumption) is probably fairly large. For instance, if e(IQ, alcohol consumption) was 0.1, then your estimated effect would be 10 (in practice standardized effect sizes are nearly always between -1 and 1, because otherwise you need strong alternative effects that cancel them out, so this is "impossibly big" - but there are other biases that could lead to milder results than "impossibly big").
(The full rules for how to compute these sorts of things, including for more unstandardized effect sizes and more complex causal graphs, are called path tracing rules/path analysis.)
Replies from: ryqiem↑ comment by MartinB (ryqiem) · 2022-07-25T04:44:45.051Z · LW(p) · GW(p)
Martin here, the main author of the above. Thanks a ton for this!
If I understand your reply correctly, your conclusion is that epidemiologists should:
- Discuss the mechanistic reasons re: the direction of IQ <-> Alcohol consumption and
- Especially distrust mendelian randomization studies where (1.) isn't strongly argued for, and which get really large estimates.
I think these are important points!
But given the very small effects estimated here, you aren't arguing for a change to the interpretation of the studies in the post, right? :-)
Replies from: tailcalled, tailcalled↑ comment by tailcalled · 2022-07-25T18:38:53.132Z · LW(p) · GW(p)
If I understand your reply correctly, your conclusion is that epidemiologists should:
- Discuss the mechanistic reasons re: the direction of IQ <-> Alcohol consumption and
- Especially distrust mendelian randomization studies where (1.) isn't strongly argued for, and which get really large estimates.
I think these are important points!
Yep!
But given the very small effects estimated here, you aren't arguing for a change to the interpretation of the studies in the post, right? :-)
In principle, this sort of problem can also lead to smaller effects, but it's probably less likely, so it might be fine? I mean it's possible I've missed something that could make it a problem.
Looking closer, the ADH1B that the variant is in is involved in alcohol metabolism, so that probably gives a plausible idea of how the MR mechanism would work.
↑ comment by tailcalled · 2022-08-04T15:11:15.523Z · LW(p) · GW(p)
Discuss the mechanistic reasons re: the direction of IQ <-> Alcohol consumption and
Actually I wanna issue a correction here. They should discuss the mechanistic reasons for the SNP -> alcohol consumption link. The point of MR is to figure out things about the IQ <-> alcohol consumption causal link without necessarily having good mechanistic knowledge of it. But as Pearl says, if you put no causes in, you get no causes out; in exchange for the IQ <-> alcohol consumption causal link, you must know even more details about the effects of the SNP that you use for estimation.