Omicron Post #13: Outlook
post by Zvi · 2022-01-07T21:20:01.328Z · LW · GW · 24 commentsContents
  South Africa and Other Already-Peaked Areas
  Uncontrolled spread: Europe, North America, India, Israel, Australia and Argentina.
  Without an Omicron wave, or without good data: Third world, Russia.
  Previous containment: South Korea, Japan, Taiwan and New Zealand
  China
  Vaccine Effectiveness
  Testing
  Hospitals
  Threads and Posts
  Probability Updates
    China keeps daily cases under 50 per million through 2022: ?% → 40%.
    Median peak cases day for United States: ??? → January 19, 2022
    Mode peak cases day for United States: ??? → January 19, 2022
    Daily cases in the the United States have peaked by February 1, 2022: 85% → 90%.
    Will There Be a Federal Mask Requirement on Domestic Flights as of November 8, 2022? 50% (unchanged, no new information).
    Chance that Omicron has a 100% or bigger transmission advantage in practice versus Delta: 55% (unchanged, no new information).
    Chance that Omicron is importantly (25%+ in the same person) less virulent than Delta: 90% → 95%.
    Chance we will be getting boosters modified for Omicron within 6 months of our previous booster shot: 20% (unchanged, no new info)
    Chance we are broadly looking at a future crisis situation with widely overwhelmed American hospitals, new large American lockdowns and things like that: 5% → 3%.
    Generation time (serial interval) of Omicron is 3.5 days or less: 87% → 90%.
None
24 comments
Omicron is now the dominant strain, so much of what would otherwise have gone into this Omicron post ended up in the latest weekly post instead, and I’m considering the right way to merge the two streams together.
In addition to some amount of the usual business, the focus of this post will be an explicit attempt to look at what’s likely to happen from here, and give my baseline scenario.
I recently had reason to chart out what I expected that baseline scenario to be around the world, so it makes sense to share it here.
The world can be divided into five (highly unequally sized) parts, with increasing levels of uncertainty, some places are unclear on whether they’re in groups two, three or four:
- South Africa and other already-peaked areas.
- Uncontrolled spread: Europe, North America, India, Israel, Australia and Argentina.
- Without an Omicron wave, or without good data: Third world, Russia.
- Previous containment: South Korea, Japan, Taiwan and New Zealand.
- Special case of previous containment: China.
South Africa and Other Already-Peaked Areas
This is the easy story to tell. Predictions about the past are often still hard, but they’re a lot easier.
A few African countries have already finished their Omicron waves, and got through mostly unscathed. Since they’re in the southern hemisphere, one can worry that there’s a wave coming in their winter a few months from now, but I would expect any such wave to be mild even if relatively little is done to prepare, given how things went this time, and that those infections are now baked in.
Uncontrolled spread: Europe, North America, India, Israel, Australia and Argentina.
This is where most of my readers live, and where I live, so it’s been my main focus. There is now a very clear baseline scenario.
Infection rates increase exponentially until they hit a peak. In major cities, this plateau will usually be quite high, with more than 1% of people infected each day, and likely 10%+ of the population testing positive at any given time. In rural areas, the plateau is likely going to be somewhat lower, but not dramatically lower.
Once you hit that peak, there will be a short period (a week or less probably in most cases) before the decline starts in earnest, then picks up speed. Once it’s gone down to something that will usually be between 25% and 50% of its maximum over the course of a few weeks, the decline starts to slow in percentage terms as behaviors adjust back somewhat. Then over time, there is a slow decline, which mostly continues until such time as other dynamics (like weather, or another variant) change the game once more, or you stabilize at low endemic levels.
There are substantial disruptions during the peak period, lasting roughly a month, but nothing as scary or severe as early 2020, and no breakdowns of civil order. Schools end up closed for a few weeks to a month in many places, others have to quickly close for a few days due to staffing issues, but some manage to stay open and it’s fine, they don’t meaningfully make anything worse.
As long as the hospitals manage to continue to provide care, there’s a ton of cases, but not that many deaths. The hospitals come under stress about six days after the relevant cases, through a mix of a lack of staffing and a flood of new patients. The question is what the true capacity is, and what happens when you exceed it, and what our ability is to do triage. Even when we ‘get through’ those weeks, life in the hospitals is still terrible during this period.
Once hospital admissions peak and start turning downward again, and it’s clear this isn’t simply hitting capacity limits and turning people away, we can know that we’re going to make it through in a given area.
We do know that London and New York in particular are almost certainly going to be fine, but other areas have lower capacity, sometimes much lower, and are ‘running behind’ in terms of how far along on this map they are, so they are not yet in the clear.
One can talk in terms of countries, but the situation is everywhere a local phenomenon.
Even within New York City, Manhattan has peaked, Brooklyn probably peaked a few days after that, but the rest of the city probably hasn’t peaked quite yet. I don’t know the details in London, but the situation is likely similar, with the center already declining, but other areas still going up along with the rest of the UK. The combining of local peaks into a region or nation gives a broader curve that looks less dramatic than the local graphs.
Who gets there when?
New York and London (or at least their central areas, and their aggregates) are the two places we can confirm have already hit peak. San Francisco has the hospital data that shows something similar, so it’s likely many major cities are also in this group.
Most other places are running somewhat behind that. The more rural you are, the slower things are to develop, and the decline will likely also be somewhat (although not as much) slower.
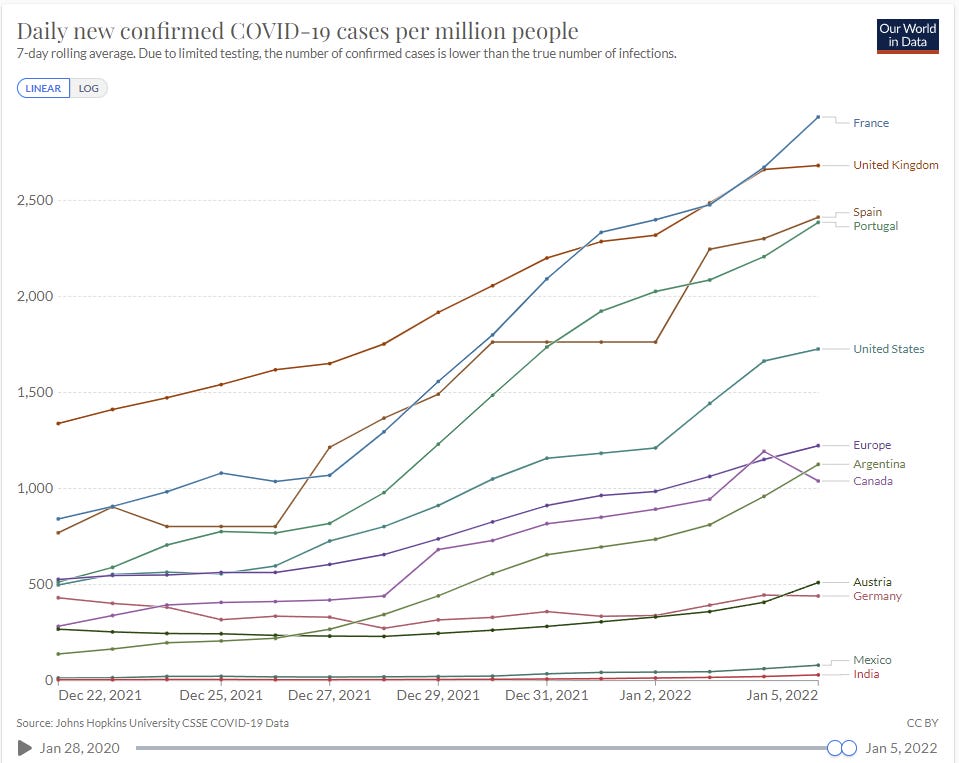
A lot of Europe and North America are on remarkably similar timelines. The United States, United Kingdom, France, Spain and Italy are all in this group.
I expect the peak for this group to be something like January 19. Exponential growth happens fast, so there’s less uncertainty in the timeline than there might appear to be, but being a week off in either direction would still be inside my 80% confidence interval. If the group hasn’t broadly peaked by month’s end, that would be very surprising.
Other places got started slower, but are still in the same boat. This is a combination of less international travel causing things to start slower, and slower spread once things get started. If there’s a place that has a lot of travel but hasn’t taken off yet, it’s probably developing slower, and its timeline will get further behind over time. Whereas places that have less travel are likely equally fast.
Here’s some of the key members of the group.
And here’s only the ones that have low case numbers.
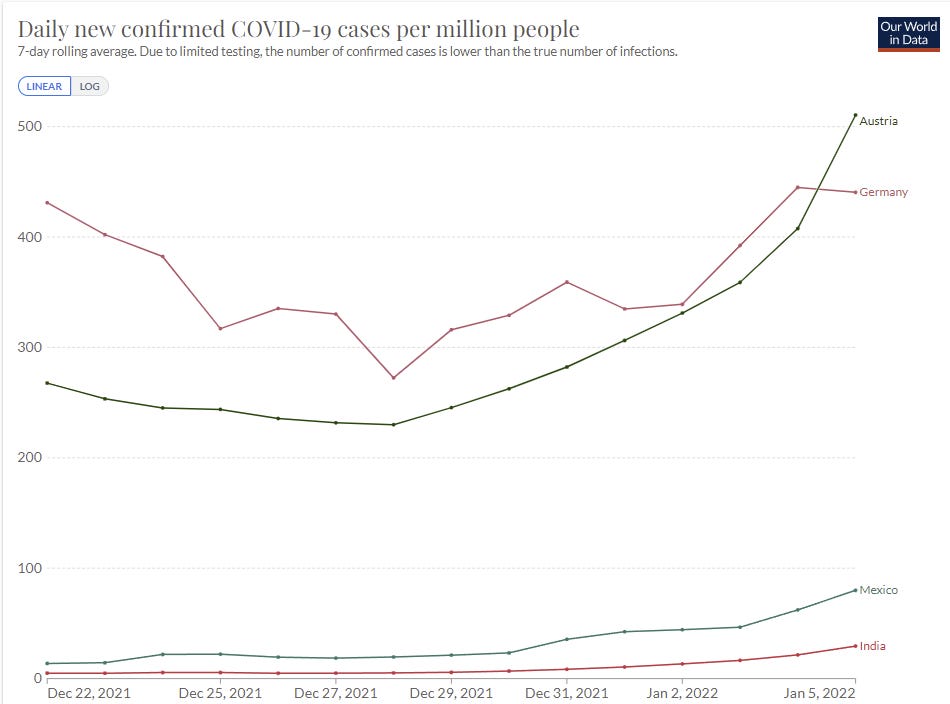
Austria, Mexico and India here all show accelerating growth as Omicron takes over from Delta. Germany is the weird one, where there’s been sufficient prevention to make it close, but looking at the Omicron-specific graphs makes it clear that the same thing is going to happen eventually, it’s simply going to happen slower, and that extra time seems unlikely to be put to good use. There won’t be that much of it. I’m still confident they belong in this category.
Canada is doing a more reasonable thing, and instituting prevention measures when they get in danger of exceeding their hospital capacity, to try and flatten the top of the curve. Flattening the curve on the way up doesn’t accomplish anything, you need to flatten the top. I don’t expect it to accomplish all that much or be worth the trouble, but at least it’s not automatically doomed. The last day of data is likely a reporting delay there.
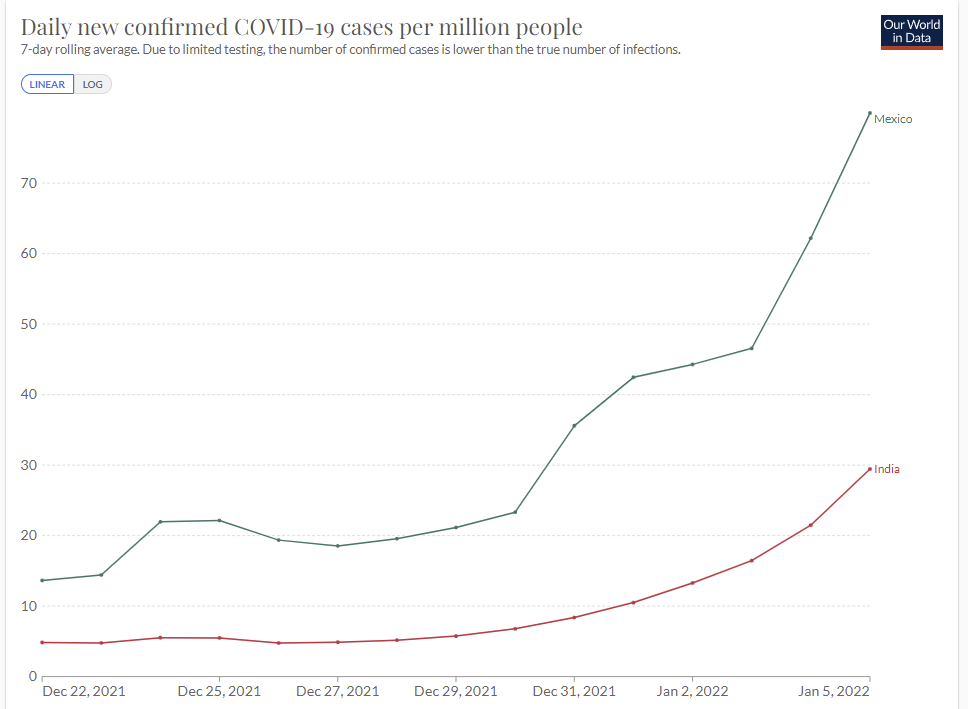
Mexico and India are a few weeks behind the USA and Europe, but they’ll get there soon enough. Note that deaths in India have been severely undercounted. When things get bad in India, that is the place I am most worried will get quite bad, and we should be thinking now about how to use aid to get mitigation efforts in place.
The fundamental insight is, either you can contain this thing, or you can’t. For a while Mexico didn’t look like it had a problem, but there was no reason to think they could contain it, so all that did was delay things. India was the same, and now we are seeing the same rapid exponential growth there we saw elsewhere, and getting to 1000+ from 30 is not that many doublings. They’re only two or three weeks behind.
There are doubtless some places I’m missing here. For example, when I started writing up the model Peru wouldn’t have been included, but it probably goes here now, and Brazil could join soon as well.
Without an Omicron wave, or without good data: Third world, Russia.
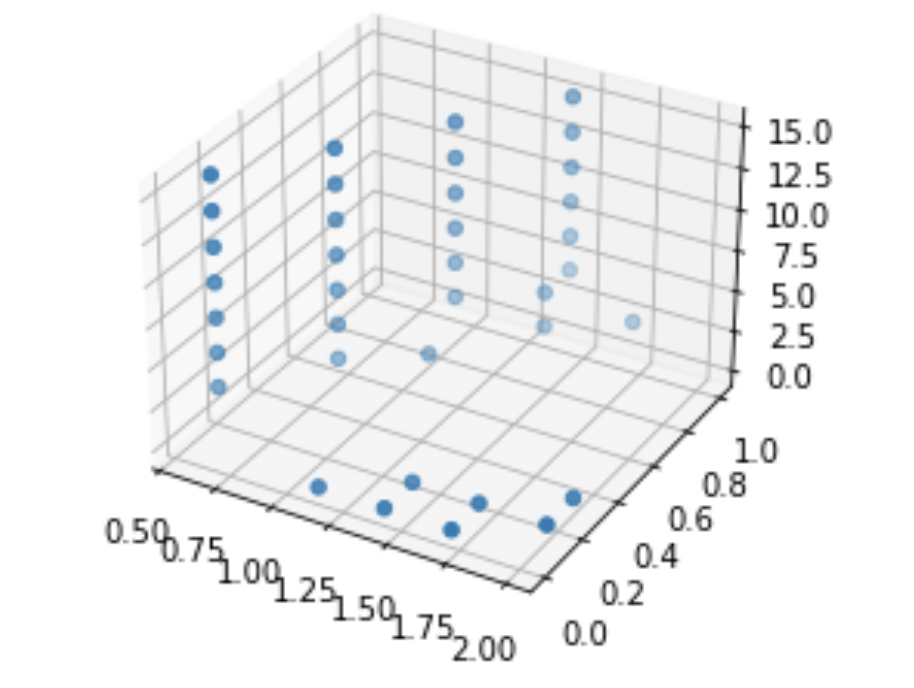
Some such countries show some signs of a potential wave, but many flat out don’t, as you can see here.
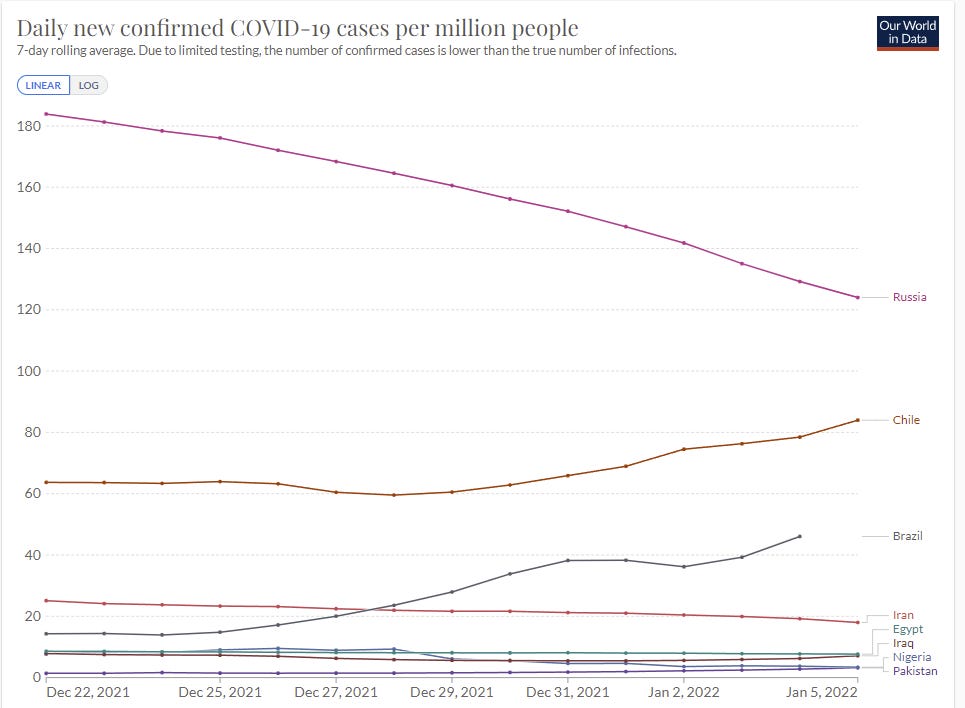
Many of these places have had much higher rates in the past, so it isn’t a pure testing issue for them. Some of these places are sufficiently unnatural places for Covid-19, at least at this time, that it’s possible waves will not arrive, or that once they get to moderate levels moderate behavioral adjustments will stabilize things at a level they can handle.
The key distinction between this and the next category is that these nations didn’t take extreme measures to get containment, which gives potential for more slack to solve the issue or contain the damage.
Previous containment: South Korea, Japan, Taiwan and New Zealand
If Australia was on the graph it would destroy the y-axis. That’s what happens when procedures that previously were sufficient become inadequate. Here South Korea is still doing a similar thing, levels are very different.
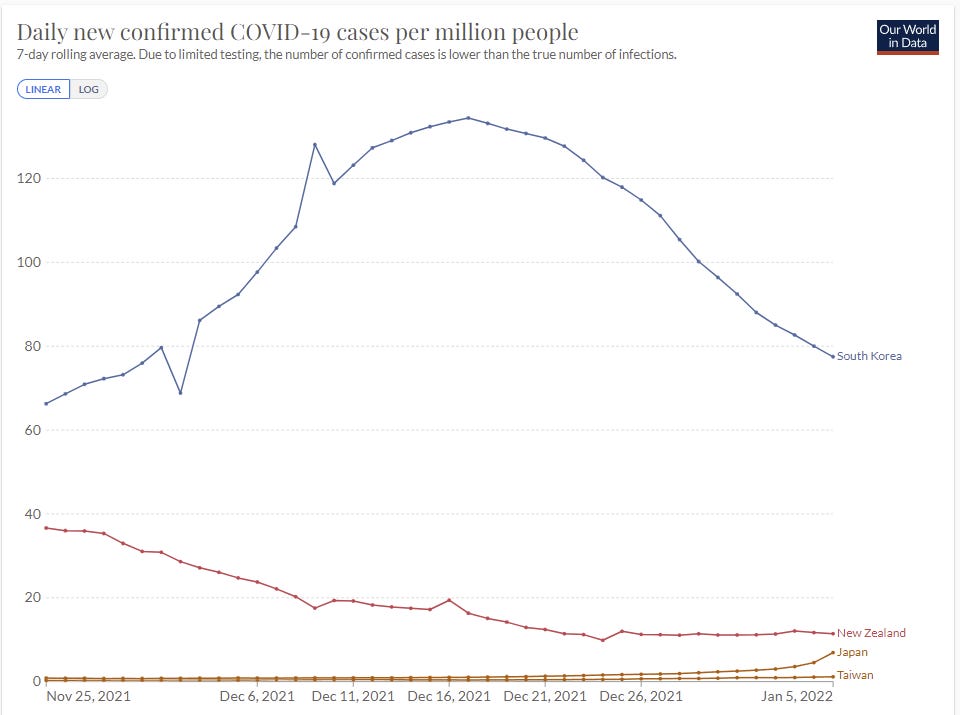
Word from New Zealand in the comments is that border controls are holding for now, but that this is widely expected to fail, and if Delta wasn’t fully wiped out then I agree with this assessment. It may be a bit, but they’re going to be in group one before their winter is out.
The last few days in Japan do not bode well, but it’s probably fine? They’ve gone from under 1.66 per million two weeks ago to 6.91. That’s one doubling per week. My guess is that Japan retains enough slack to continue to contain the situation. Taiwan also seems like it’s got a chance.
For now South Korea is still headed downwards, which indicates they’ve managed to keep Omicron out, but also they got high enough before that I am highly skeptical that they can contain this for that long. I expect them to end up in the first category.
That leaves the big one. China.
China
China is the big question. They managed to maintain a zero Covid policy so far, so almost none of them have immunity that way. The Chinese vaccine was always less effective, and offers minimal protection against infection by Omicron.
Thus, China is facing a much harder problem with Omicron than they faced in previous waves. Measures that previously would have been enough will no longer be enough.
Locking down Xi’an, with 1% of their population, has been frustratingly slow at containing the situation there. My presumption is that China can and if necessary would continue to do things on this level, but that doing that for 10% of the population for long periods is a very different proposition. There is only so much ammunition available.
Thing is, if China can’t get to and stay at actual zero Omicron, then they need a sustainable way to keep it from exploding, or they will lose and nothing they do will matter. Taking extreme measures on outbreaks requires that the rest of your strategy be close to enough on its own. Keeping things out via borders requires that you really mean it, or all you do is slow things down.
Meanwhile, they’re planning to host the Olympic Games, and, well, whoops?
I’ve underestimated China’s containment abilities throughout, and been repeatedly surprised. Once again, I’m skeptical they can pull this off, and once again it’s mostly a Boolean, either the strategy works or it doesn’t. But given their track record I can’t count them out of it, neither result would surprise me, nor could I find any prediction markets that speak directly to this. Where there is a will, there can sometimes be a way, and China has a will in a way that Western countries do not.
I’m going to tentatively put my probability that China keeps Omicron contained at 40%, but I don’t have great knowledge about many details that could update that, including the opinions of others who have thought about it. So I would update quickly, especially if someone offered to wager on either side.
Now a round up of the other Omicron News. Remember, a lot of this got moved to the weekly update.
Vaccine Effectiveness
Third dose holds up at 90% effectiveness against hospitalization for at least three months for the elderly. UK using this to decline to authorize fourth doses.
In this study, we demonstrate both markedly decreased neutralization in serology assays and real-world vaccine effectiveness in recipients of two doses of vaccine, with efficacy partially recovered by a third mRNA booster dose. We also show that immunity from natural infection (without vaccination) is more protective than two doses of vaccine but inferior to three doses. Finally, we demonstrate fundamental changes in the Omicron entry process in vitro, towards TMPRSS2-independent fusion, representing a major shift in the replication properties of SARS-CoV-2. Overall, these findings underlie rapid global transmission and may alter the clinical severity of disease associated with the Omicron variant.
…
Our estimates of protection in the current GG&C cohort, whose median time since most recent dose is 5 months, were notably lower (Fig.4D). This waning of protection was evident for both variants, leading to very low levels of protection against Omicron in double vaccine recipients of ChAdOx1, BNT162b2 and mRNA-1273 (5.19%, 24.39% and 24.86% respectively). Our estimates for current protection against Omicron in recipients of a third booster dose of BNT162b2 or mRNA-1273 were much higher at 59.21% and 64.9%. We next estimated the additive protective effect of previous natural infection. Infection-acquired immunity directed against other VOCs may be broader in nature and may wane more slowly than that induced by vaccines. The level of protection following previous infection was 53.2% for Omicron, and 88.7% for Delta.
Paper has a bunch more detail along with some cool diagrams and charts. These numbers all make intuitive sense to me.
Meanwhile, vaccines in children are ludicrously effective in terms of reducing what risk is left, a 180x reduction, although they are also largely unnecessary in terms of the kids not having been at much risk in the first place.
Testing
‘Ethical rules’ versus the need to f*** around and find out. We are all poorer for it. We should be able to have very good info on relative performance of different tests, in particular. Here’s some new results, which suggest that nasal swabs are slow to start turning positive, in the study median additional time required was 3 days after the PCRs were positive, which is in the range of not being all that useful if you need to confirm you’re not infectious. Suggestion is to use saliva for rapid tests to get that time back, but by the time we do that, I’m assuming the wave will already be over.
Combined with a lot of anecdotal reports I’ve seen, I’m moving towards assuming that while rapid tests are probabilistically very useful, transmission with Omicron is much faster and has outpaced the speed at which the tests turn positive, and this means that if you want to be confident rapid tests are not that useful on their own. And strongly agree with Mina that if you have symptoms, you have to act as if you’re positive unless you’re negative several days later.
As it usually goes when we are scared of public reaction and use price controls rather than ration to those who value something the most, here is the ongoing quest for Binex tests.
Hospitals
Report of hospital telling employees to return five days after first symptoms or positive test unless they have ‘true Covid symptoms,’ and otherwise being forced to work while sick, including with those true Covid symptoms.
Hospitals in DC risk being overwhelmed and going into crisis care mode, but have seen few deaths. They’re bringing back Covid-positive staff quickly, and offering increasingly rich shift bonuses of $1000 or more.
Hospital admission growth rates in UK, London has gone negative and we are clearly past peak growth. The danger is always that if you get close to the edge you start turning people away and then the graph is misleading you.
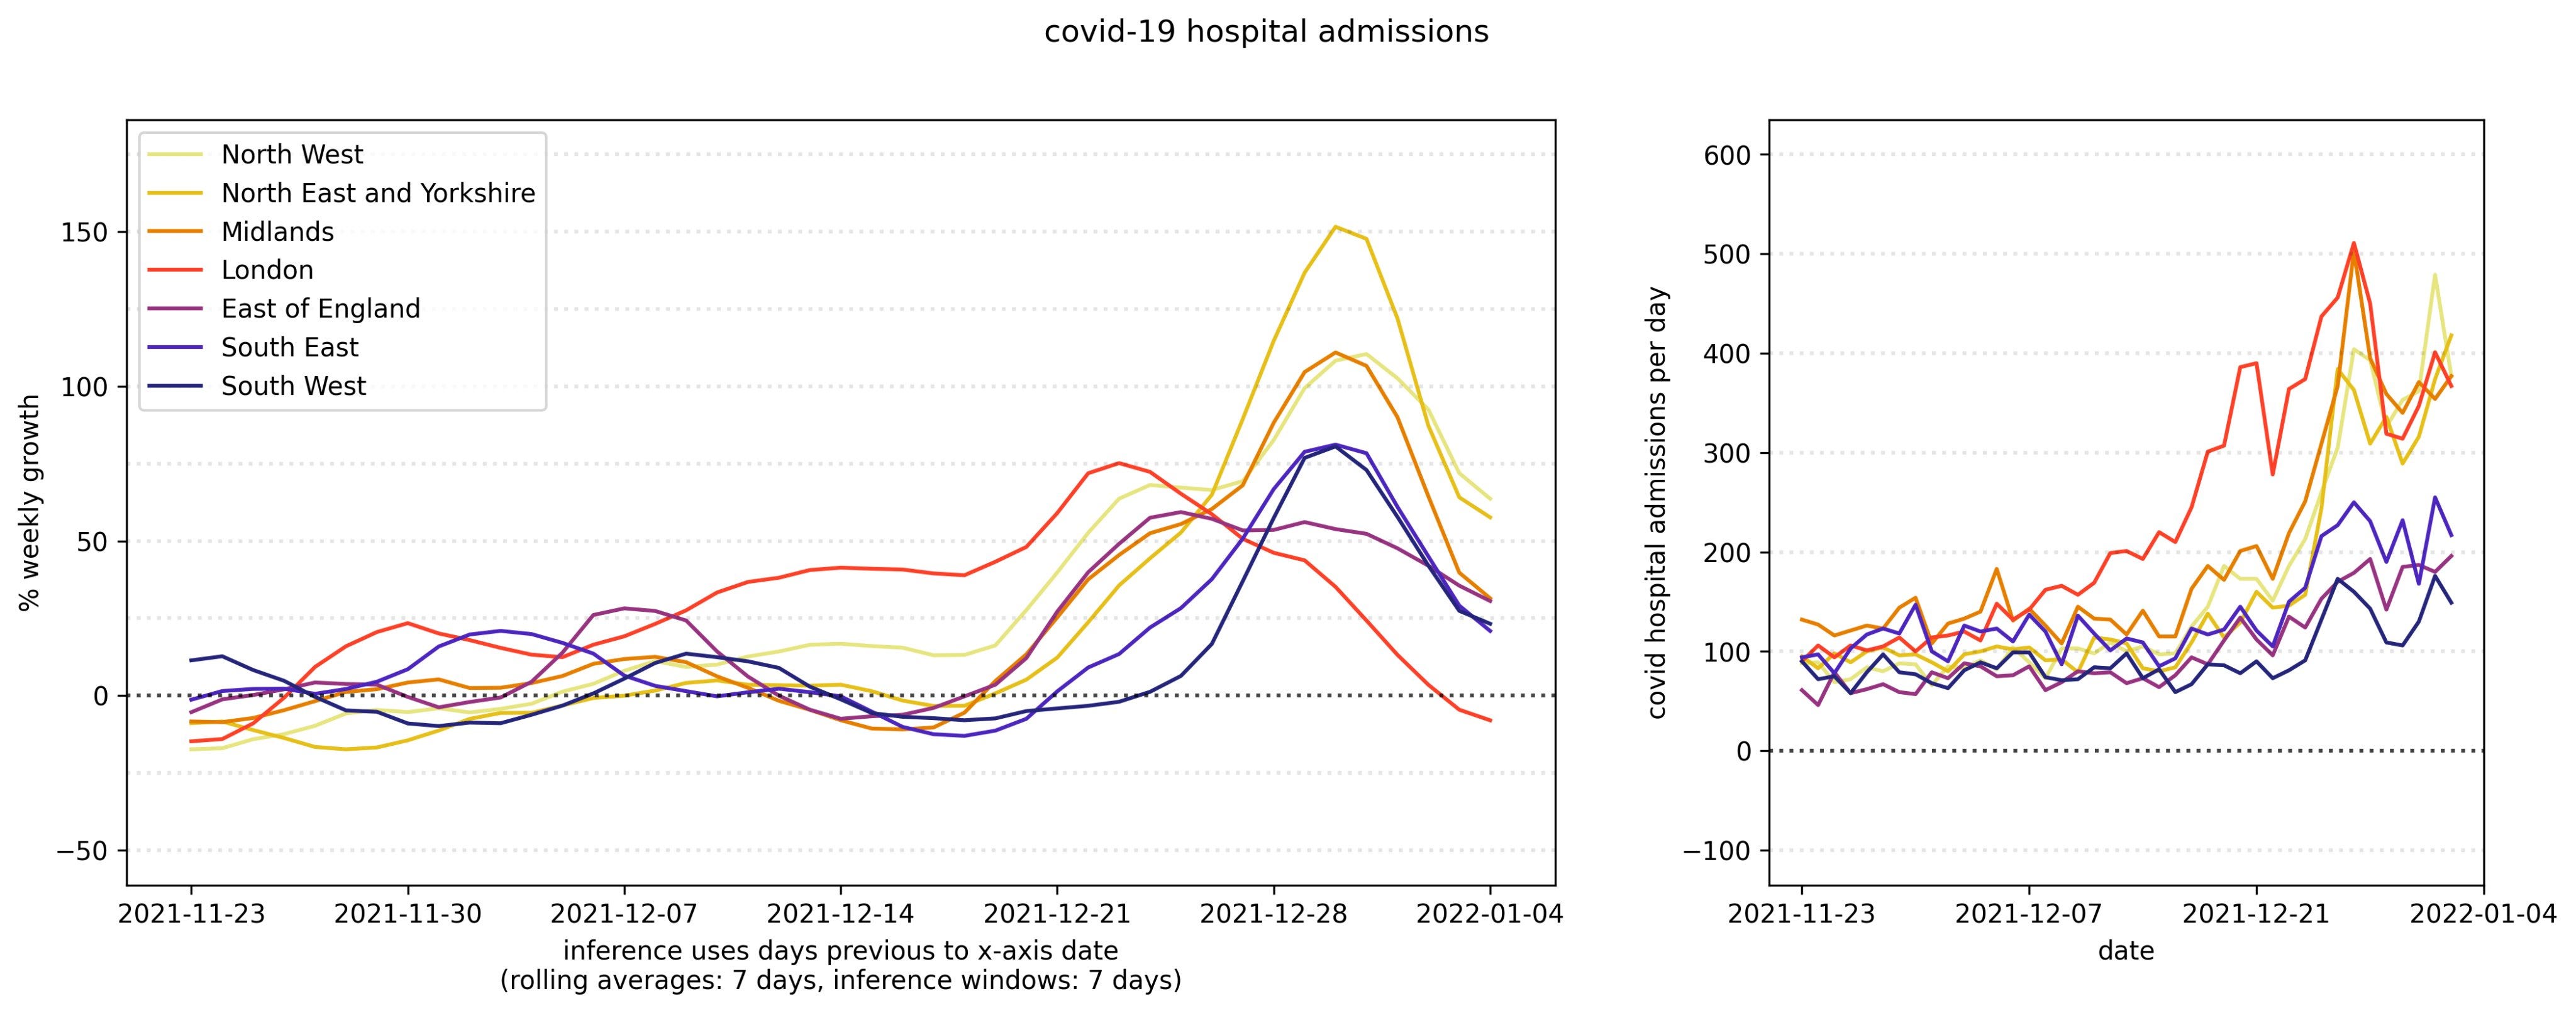
Report from NHS, seems consistent with previous reports.
Threads and Posts
Your Local Epidemiologist brings us the good news, general summary post. All seems right, good summary, nothing new.
Look at the impact of Omicron on cancer treatment.
Eric Topol breaks down the details of why our immune systems have been dealing with Omicron so well.
An argument moderately against Omicron coming from Gain of Function research, including what new information would move the needle.
WHO being an unhelpful broken record.
Probability Updates
I want to explicitly encourage people to say in the comments which predictions you disagree with, what your probability is, and what your model is that is causing you to disagree. Especially on China.
China keeps daily cases under 50 per million through 2022: ?% → 40%.
I talked about this above, and expect to update this soon more on better thinking and others’ opinions (including prediction markets if we can get one) rather than primarily through new information. We’ll know if this is failing, but in most worlds where this fails it doesn’t fail right away, so short term lack of evidence of failure is only weak evidence of long term success. I’m mostly throwing this out to start a conversation.
Median peak cases day for United States: ??? → January 19, 2022
Mode peak cases day for United States: ??? → January 19, 2022
Daily cases in the the United States have peaked by February 1, 2022: 85% → 90%.
I think this is better than more probability estimates here. Note that the most likely path is that the median updates to somewhat later as we continue to see case growth, rather than me expecting the peak to be the next day as a median and then the next day we get a peak, we get an asymmetrical distribution. The mode is more likely to stay where it is or not move much, and will likely quickly become ‘any day now’ if it doesn’t happen when I expect.
With some areas already peaking we can be more confident the peak will come in January, but not super confident until we see it in more places more definitively. There’s still a lot of error bars.
Will There Be a Federal Mask Requirement on Domestic Flights as of November 8, 2022? 50% (unchanged, no new information).
Chance that Omicron has a 100% or bigger transmission advantage in practice versus Delta: 55% (unchanged, no new information).
Chance that Omicron is importantly (25%+ in the same person) less virulent than Delta: 90% → 95%.
Chance that Omicron is vastly (75%+ in the same person) less virulent than Delta: 25% → 30%.
Time keeps passing and we keep seeing the same patterns, I think we can safely say that it’s importantly less virulent, I’m keeping the 5% around mainly for model error (e.g. maybe my reasoning is bad). I’m up to 30% on there being a big difference based on the large disconnects in deaths, including in the United States.
Chance we will be getting boosters modified for Omicron within 6 months of our previous booster shot: 20% (unchanged, no new info)
Chance we are broadly looking at a future crisis situation with widely overwhelmed American hospitals, new large American lockdowns and things like that: 5% → 3%.
The big cities, especially the blue ones, are going to get through this, and I don’t see any way big lockdowns happen based on the needs of rural areas.
Generation time (serial interval) of Omicron is 3.5 days or less: 87% → 90%.
Creeping up a bit on reflection and on everything continuing to fit the pattern, especially the reports of rapid tests not picking up on the newly quickly infectious. Pretty confident here at this point, but don’t know we’ll ever confirm this.
24 comments
Comments sorted by top scores.
comment by Jacob Falkovich (Jacobian) · 2022-01-11T02:57:34.586Z · LW(p) · GW(p)
I feel like I don't have a good sense of what China is trying to do by locking down millions of people for weeks at a time and how they're modeling this. Some possibilities:
- They're just looking to keep a lid on things until the Chinese New Year (2/1) and the Olympics (2/4 - 2/20) at which point they'll relax restrictions and just try to flatten the top in each city.
- They legit think they're going to keep omicron contained forever (or until omicron-targeting vaccines?) and will lock down hard wherever it pops out.
- No one thinks they're not merely delaying the inevitable, but "zero COVID" is now the official party line and no one at any level of governance can ever admit it and so by the spring they're likely to have draconian lockdowns and exponential omicron.
Ironically, if the original SARS-COV-2 looked like a bioweapon targeted at the west (which wasn't disciplined enough about lockdowns), omicron really looks like a bioweapon targeted at China (which is too disciplined about even hopeless lockdowns).
Replies from: None↑ comment by [deleted] · 2022-01-11T22:58:09.196Z · LW(p) · GW(p)
What, in your mind, makes Omicron hopeless to stop in China? Omicron doesn't seem to be much more infectious among the unvaccinated than previous strains, and they did manage to wipe out the original Wuhan strain completely within their borders.
Replies from: Lukas_Gloor↑ comment by Lukas_Gloor · 2022-01-11T23:51:34.009Z · LW(p) · GW(p)
The Wuhan strain is the one before the Greek alphabet. Alpha was more infectious, then Delta even more. Omicron is comparable to Delta, so still a lot more infectious than the Wuhan strain.
Replies from: None↑ comment by [deleted] · 2022-01-12T09:36:19.552Z · LW(p) · GW(p)
True, but none of these variants made it in China either, and vaccines could only have helped stopping Delta due to timing. Sinovac is also much less effective even for Delta. Maybe China has run out of dakka and Omicron will be the final straw, but it is far from obvious imo (especially considering China has been able to keep its economy running normally all this time).
If China does break though, this will be an important datapoint for future biodefense. It roughly represents how much infectiousness humanity can handle at most if it got really, really serious.
comment by NormanPerlmutter · 2022-01-10T03:22:04.128Z · LW(p) · GW(p)
Healthdata.org (the University of Washington team) released a new projection January 8, projecting that cases in the US (actual cases, not reported cases) peaked January 6. Had you seen this already when you wrote this post, and if not, does it impact your projection of a January 19 peak for the US?
(Edit: added hyperlink)
Replies from: NormanPerlmutter↑ comment by NormanPerlmutter · 2022-01-11T05:53:44.575Z · LW(p) · GW(p)
Looks like Zvi just wrote a whole post [LW · GW] in response to the healthdata.org update. In particular, January 19 was his prediction of a peak of reported cases, not of actual cases.
comment by fiddler · 2022-01-08T07:41:17.611Z · LW(p) · GW(p)
I cobbled together a compartmental fitting model for Omicron to try to get a handle on some viral characteristics empirically. It's not completely polished yet, but this is late enough already, so I figured the speed premium was enough to share this version in a comment before writing up a full-length explanation of some of the choices made (e.g. whether to treat vaccination as some chance of removal or decreased risk by interaction).
You can find the code here in an interactive environment.
https://mybinder.org/v2/gh/pasdesc/Omicron-Model-Fitting/main
I built it to be architecturally pretty easy to tinker with (models are fully polymorphic, cost function can be swapped easily, almost all parameters are tweakable), but my messy code and lack of documentation may jeopardize that. Right now, it's only loaded with the UK and Denmark, because those are the two nations that had high-resolution Omicron case data available, but if anyone is aware of more sources, it's just some data parsing in a spreadsheet to add them, which I'm happy to do. It should optimize the viral characteristics across all of the populations simultaneously, i.e. assuming Omicron is identical in all these places. It also doesn't currently account for prior Delta infection, because there was a full OOM variation in those statistics, and the ~20% protection offered didn't seem 100% crucial to incorporate in an alpha version. Similarly, NPIs are not included.
With those disclaimers out of the way, here are some results!
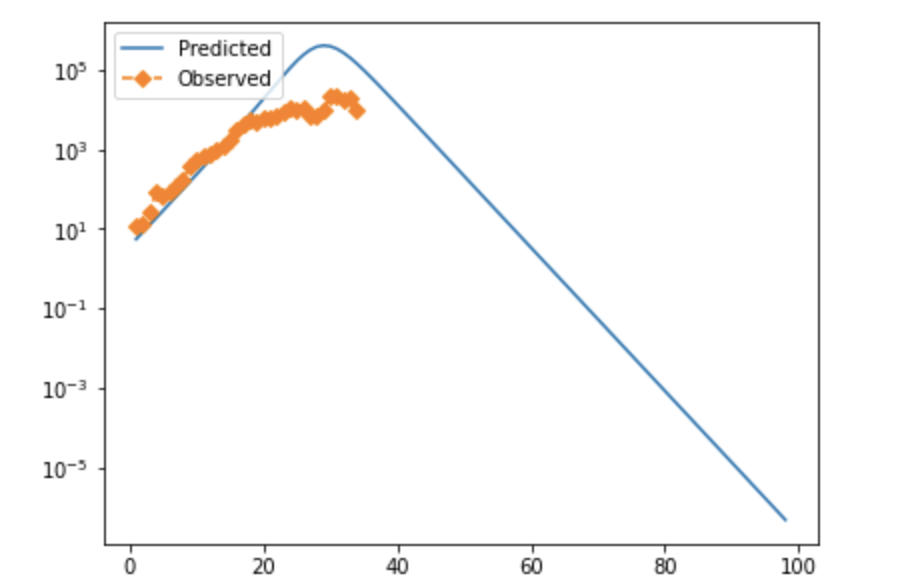
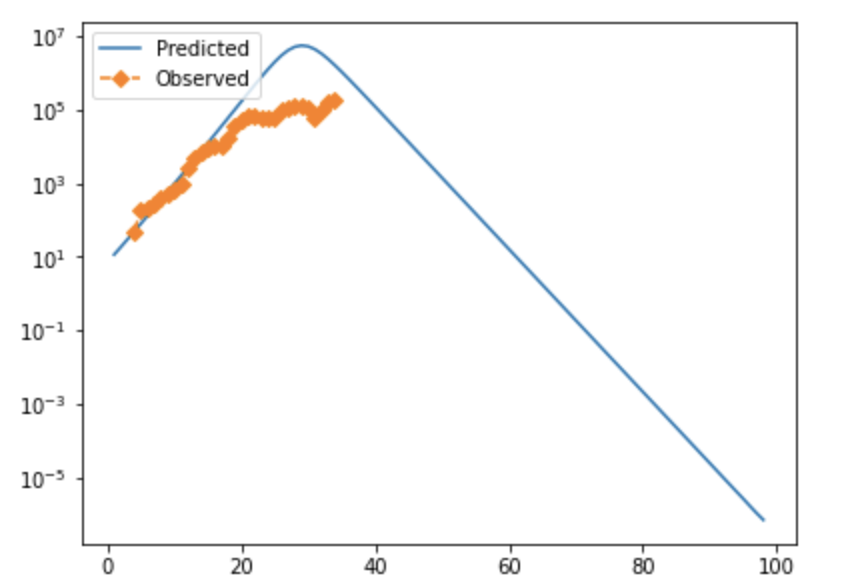
In full moderately high-resolution optimization mode, the numbers I've found are something along the lines of Beta: 1.15-1.7 Gamma: 0.7-0.85 Alpha: 10+ (varies significantly, implies a very short pre-infectious exposure period). The implied serial interval is on the order of ~16 hours, which is short enough to strain plausibility (Very roughly, R_0=beta/gamma, serial interval=1/beta. Better estimates for these are another v2 thing.). However, these numbers can't be quite taken at face value as the "best" solution, because the numeric "grid" I'm using to evaluate different options can't evaluate the depth of local minima in a first pass, meaning that the program could privilege certain spots on a roughly level accuracy curve because the test point chosen happens to coincide with the bottom of the trough.
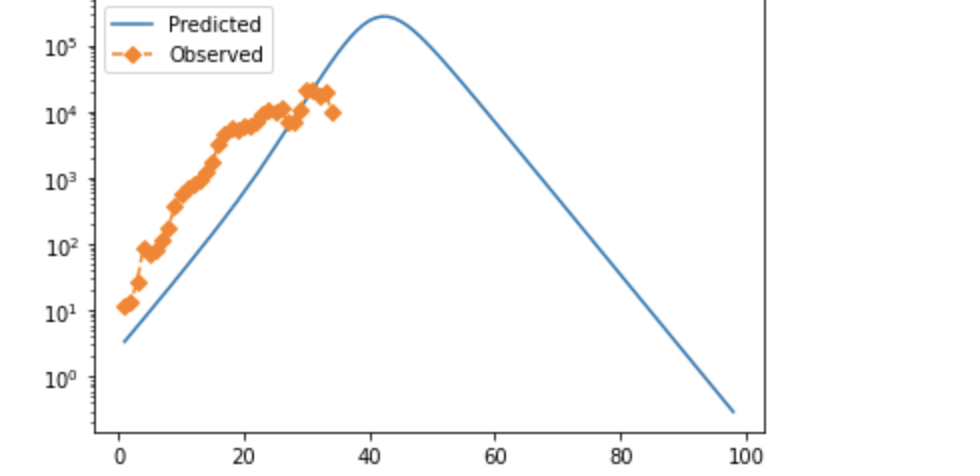
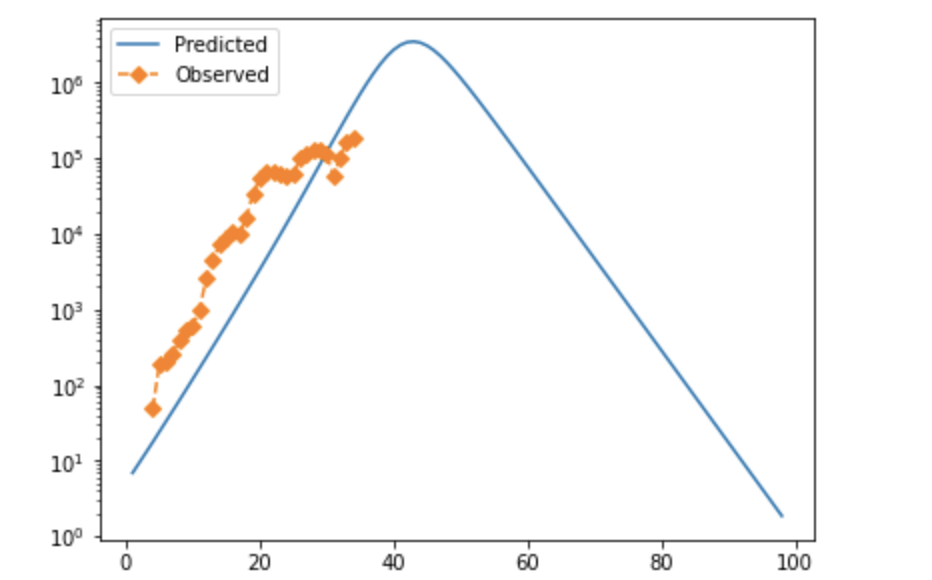
Note that in both cases, observed cases flatten as time goes on/cases rise. I strongly suspect this is due to testing failure, and will likely modify the error function to prioritize mid-case data or adjust for positivity rate. If anyone has rigorous suggestions about how to do that, I'd be very interested. These fits also look not-very-impressive because they're pretty exponential at the moment; they aren't perfect, but the similarity between the UK and Denmark is suggestive, and if you tweak things slightly accounting for both of these factors, you can get visually better fits—see below for why.
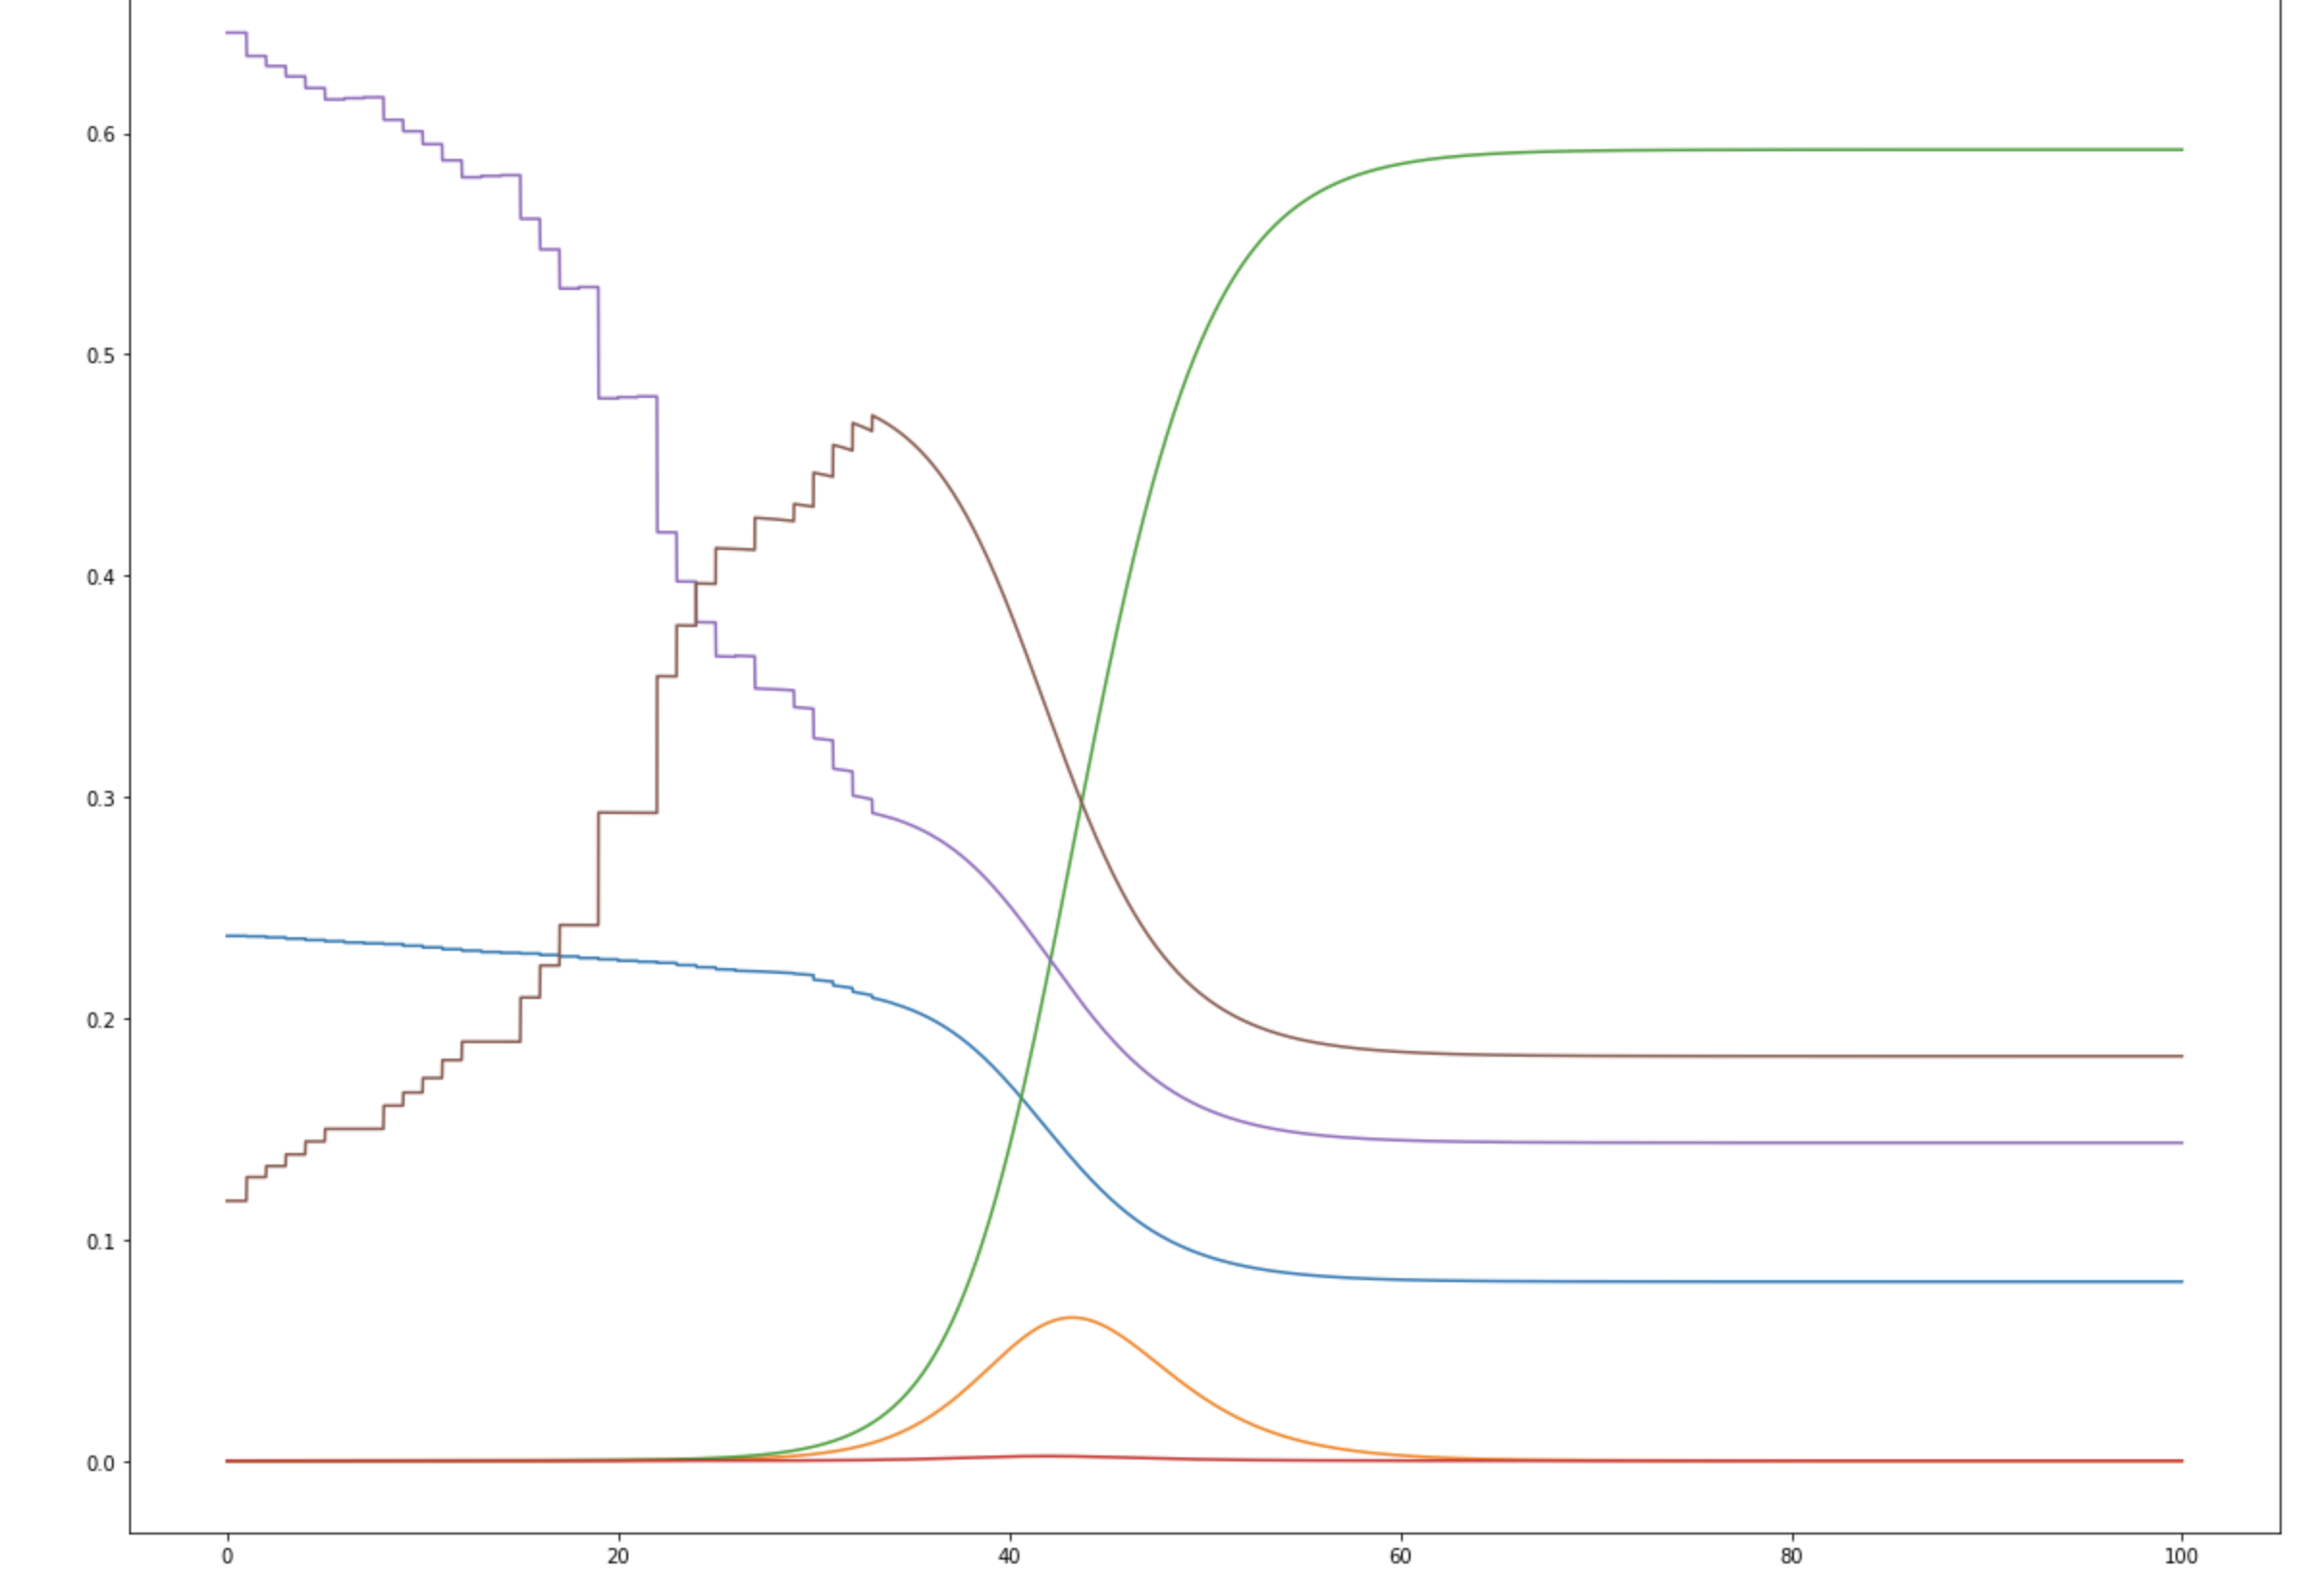
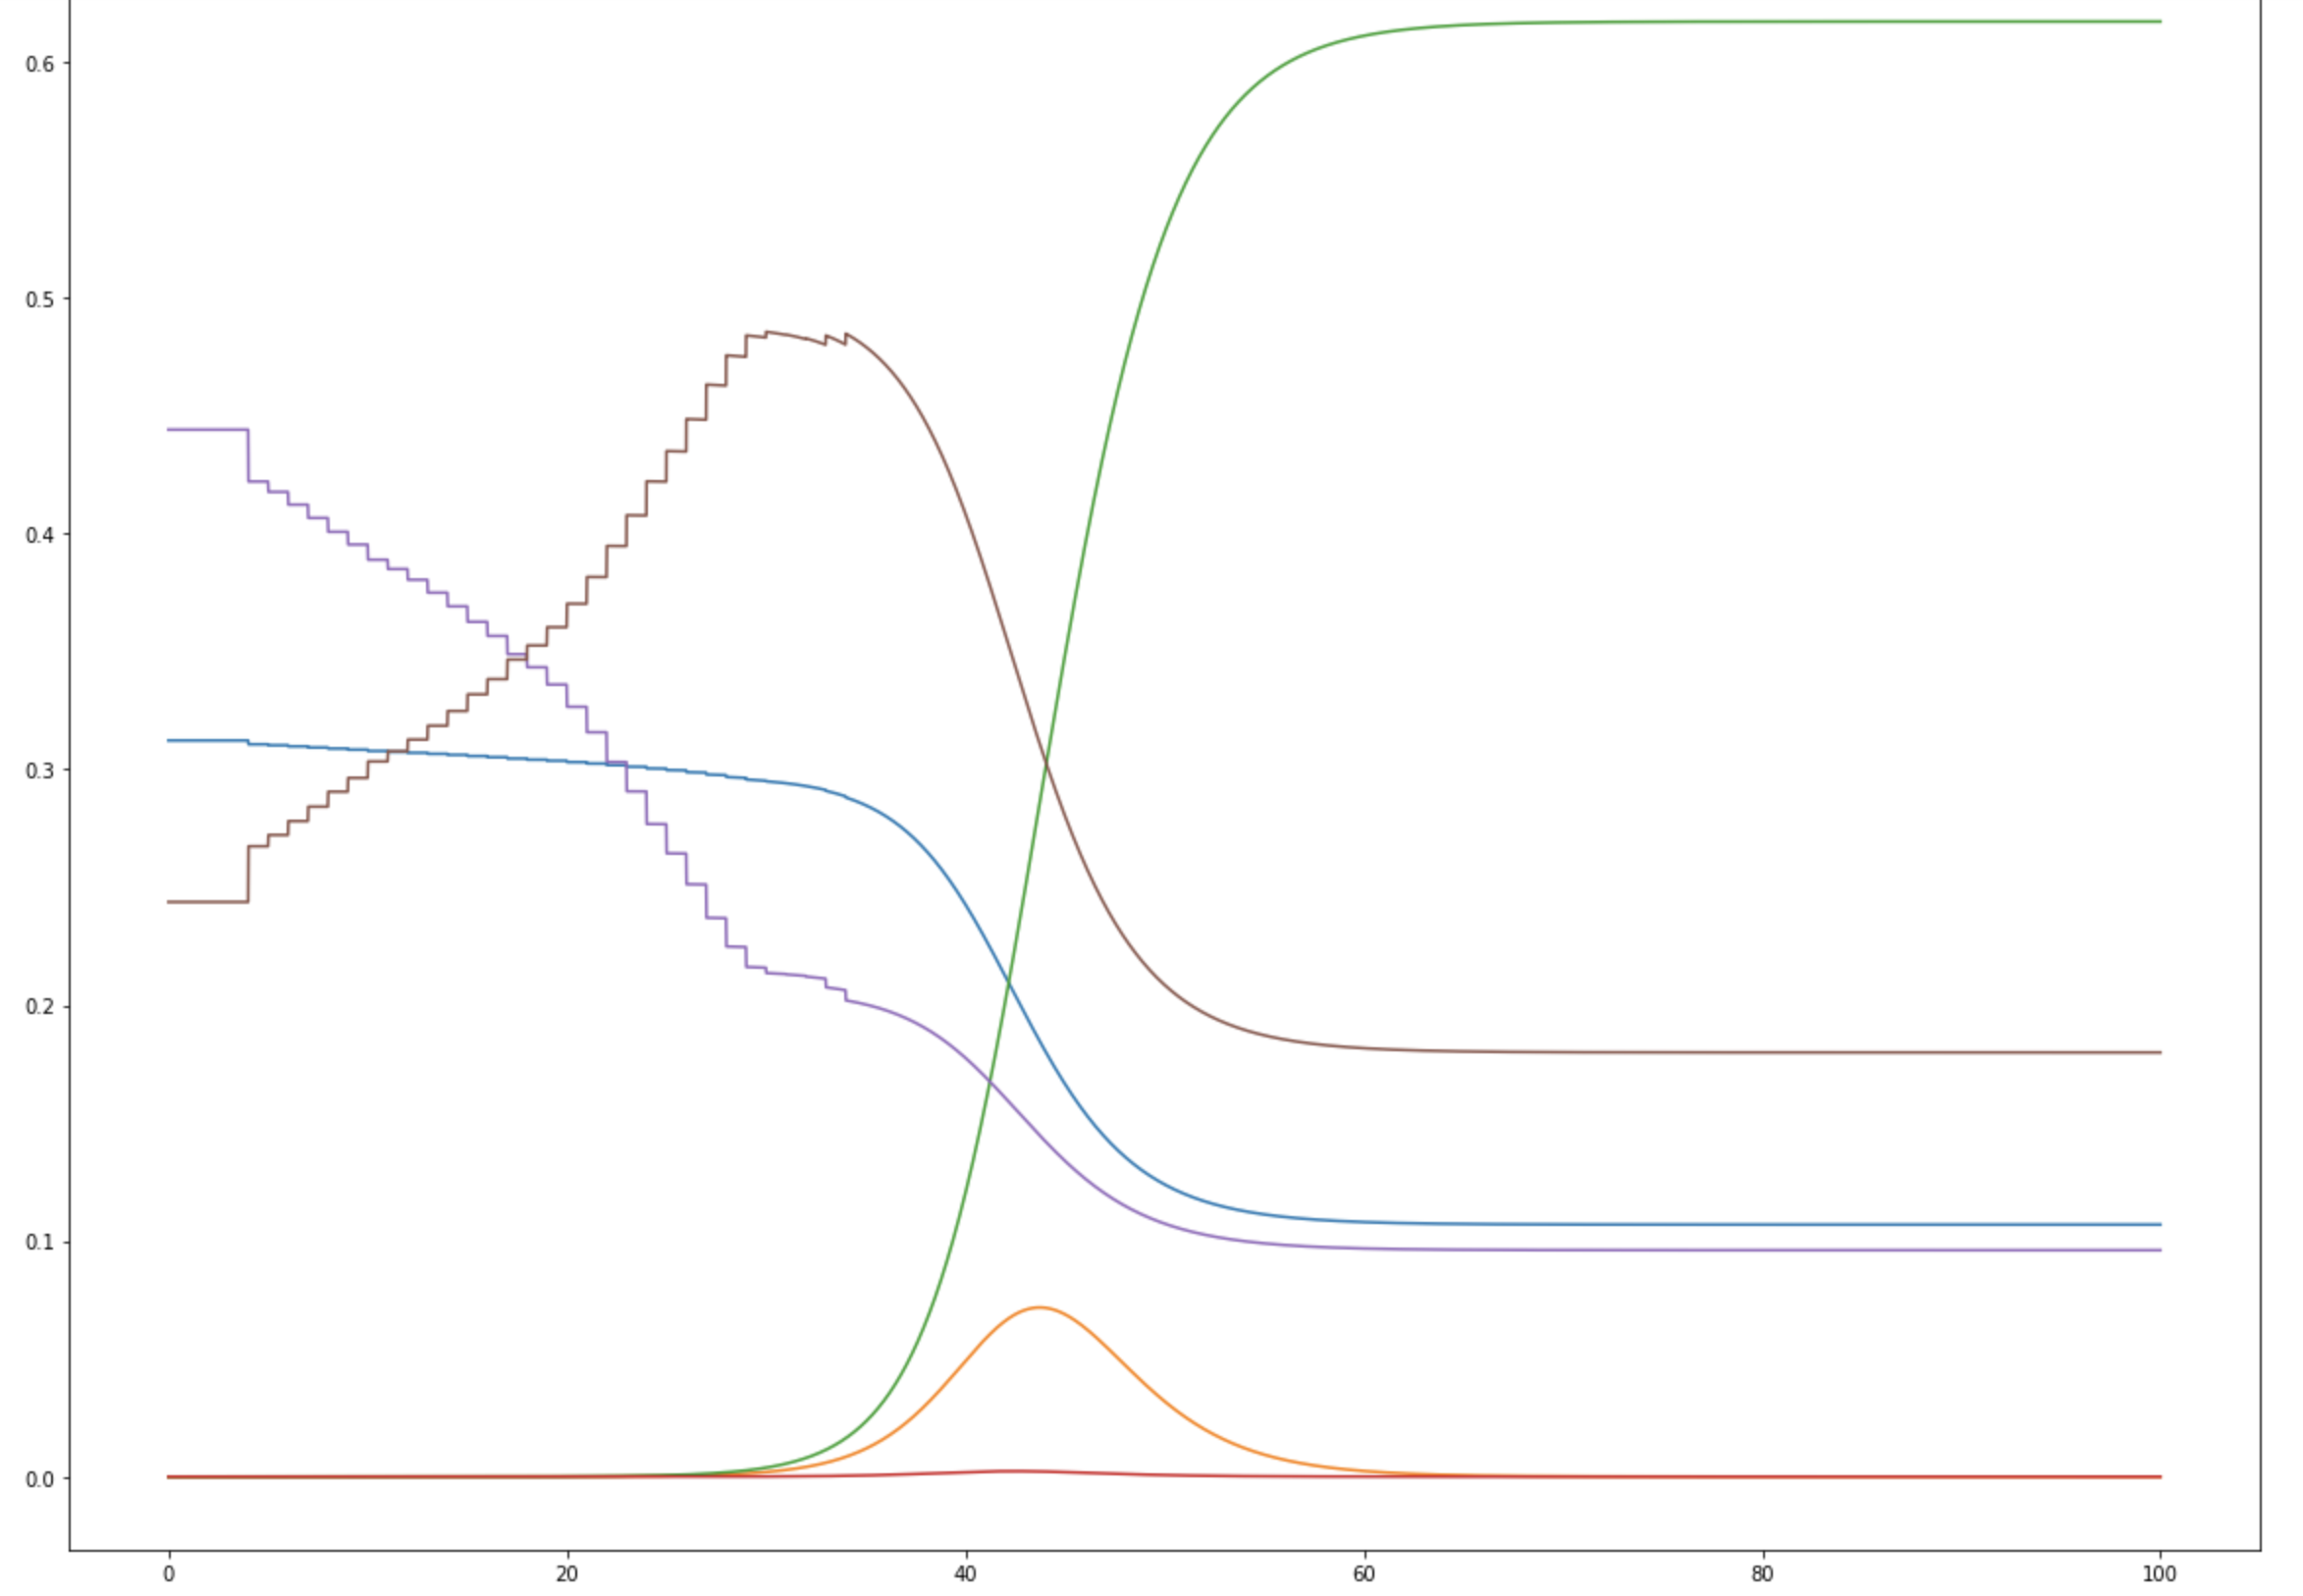
I'm not aware of a way to do fully numeric gradient descent, but in v2 of this, I'm going to improve the iteration element of the optimization algorithm to slide to an adjacent "square" if appropriate and/or add numeric discrete-direction descejnt. In the meantime, it's more appropriate to look at the points within a threshold of optimal, which form clouds as shown below (note that because many of these variables are at least partially inverted when considered in terms of viral characteristics, bigger clouds further from the origin are to be expected.
Please let me know if anyone's interested in any specific scenarios, confused, or having issues—there's a known bug where if any of the coefficients is greater than 1/resolution, things go to hell very quickly.
comment by arunto · 2022-01-08T01:27:09.417Z · LW(p) · GW(p)
When it comes to China a crucial question is how much more contagious Omicron is in a naive population (i.e. how much of Omicron's tramsmission advantage is not explained by its potential for breakthrough infections.) Do we have good estimates for that?
Replies from: markus-knoke, fiddler↑ comment by Markus Knoke (markus-knoke) · 2022-01-09T12:03:44.931Z · LW(p) · GW(p)
Yes, per this Danish study Omicron is actually not more infectious for immo-naive persons, at least in household setting:
https://twitter.com/ProfPHansen/status/1476308265764102144
https://www.medrxiv.org/content/10.1101/2021.12.27.21268278v1
Transmission advantage mostly, if not completely, coming from immun escape + shorter generational interval.
comment by Jackson Wagner · 2022-01-08T03:27:21.703Z · LW(p) · GW(p)
"Suggestion is to use saliva for rapid tests to get that time back, but by the time we do that, I’m assuming the wave will already be over."
I'm confused; is this saying:
- That we should use saliva-based PCR tests instead of nasal-swab rapid tests? (But PCRs are expensive and their turnaround time is often terrible?)
- That we should manufacture new types of rapid tests which can use saliva?
- That existing rapid tests can already use saliva, and we should just start popping rapid tests in our mouths like lollipops instead of sticking them up our noses??
I'm guessing the correct answer is #2, even though #3 would be by far the most fun and convenient thing to be true.
Replies from: Daniel V↑ comment by Daniel V · 2022-01-08T14:52:46.315Z · LW(p) · GW(p)
Yeah the "ethical rules" linked tweet asks, since tests are available in the UK, what if we just had Londoners take two - one in the nose and one in the throat, to see if they work? (so a non-confident version of #3)
It's more complicated too, not just #2 of developing tests we know work with saliva. From the linked preprint, the viral loads are somewhat higher in saliva than nasal earlier but nasal than saliva later (low sample size for this inference though).
And those data are a bit sad as they show that regardless of the saliva/nasal viral loads, antigen struggles even for high viral loads until day 3 post-PCR-positive. PCR can detect pre-symptomatic cases (so day 0 PCR-positive can be...fudging a bit for the shorter serial interval, maybe day -3 of symptoms for omicron), which implies that taking an antigen test when you develop symptoms is right on day 3 post-PCR-positive. Maybe the FDA was getting signals of this (additional citations also included in the linked preprint) when they issued their cryptic statement about lower antigen sensitivity for omicron. It feels like we had more wiggle room on an informative antigen testing window for delta than we do for omicron. Antigen testing was weakly informative pre-symptoms for delta, but, based on this preprint, it seems antigen testing is wholly uninformative pre-symptoms for omicron.
↑ comment by Daniel V · 2022-01-11T02:17:43.958Z · LW(p) · GW(p)
A single omicron antigen test is good after showing symptoms, not before (Table 1). The good news is antigen doesn't miss randomly (of course not) - it misses lower viral load cases (Figure 1a). But we can't be sure those cases are at a steady-state of viral load, so it doesn't necessarily ensure that missed cases remain low viral load. Asymptomatic cases tend to be lower viral load than symptomatic cases (makes sense), but it's by no means a guarantee (Figure 1b-c, median Ct of symptomatic is ~25 while median Ct of asymptomatic is ~30, higher Ct means lower viral load).
https://www.medrxiv.org/content/10.1101/2022.01.08.22268954v2.full.pdf+html
↑ comment by tkpwaeub (gabriel-holmes) · 2022-01-11T11:25:18.623Z · LW(p) · GW(p)
Is it accurate to say that Ct count is similar to the # of zero bits of the density of RNA in the sample (expressed in binary)?
comment by ndr · 2022-01-09T23:13:20.755Z · LW(p) · GW(p)
China keeps daily cases under 50 per million through 2022: ?% → 40%. [...] We’ll know if this is failing,
How do you know that we'll know if this is failing?
I'll go with 60% that by December 31st 2022 we'll have no credible reports (or even the OWID feed) say China had any day with 50+ cases per million, at least this puts an upper bound on the resolution.
This is the sum of three things:
- Even if >50/mil, Information doesn’t get out, not by December 31st 2022 at least
- China manages to mitigate effectively
- China is already mostly immune. See this comment thread on ACX
Last one has low probability, certainly lower than #1, but it’s still there.
But I’m curious, what makes you think we’ll know if China will fail to contain Omicron?
Replies from: Zvi, yunxiang-zhu↑ comment by Zvi · 2022-01-10T03:18:08.599Z · LW(p) · GW(p)
Link didn't work.
China can downplay things for a week or two but this fails quickly in the face of exponentials. If they hit 70k and pretend they didn't, they then hit 200k and then 400k and then can't pretend.
Replies from: ndr, ndr↑ comment by ndr · 2022-01-10T12:08:15.262Z · LW(p) · GW(p)
Oops, link fixed, here it is again for convenience.
I understand you say these are large numbers, but I don't know what signal we can expect to see if they can't contain the outbreak. Number of travelers from China that need isolating?
Or do you expect that the number of deaths will be considerably high?
↑ comment by Yunxiang Zhu (yunxiang-zhu) · 2022-01-10T01:20:27.294Z · LW(p) · GW(p)
70,000 is a large number, and hard to hide.
comment by JBlack · 2022-01-09T01:32:46.514Z · LW(p) · GW(p)
If Australia was on the graph it would destroy the y-axis. That’s what happens when procedures that previously were sufficient become inadequate.
No, this is actually completely incorrect. Most of the procedures that previously were sufficient were deliberately abolished when the 16+ vaccination rate went over 80%. For most states that happened just before the first reports of Omicron from South Africa.
This is what happens when a government changes from "COVID zero" to "let it rip" just as a strain comes along that infects vaccinated people almost as easily as unvaccinated. Except in the state of Western Australia, which peaked at 16 new cases a few days ago and returned to zero yesterday.
We currently have no restrictions almost everywhere else. People who have been in contact outside their home with known cases have no requirement to isolate or get tested, and there are essentially no restrictions on large gatherings in most areas. There are some ridiculous and ineffective restrictions in some areas (such as no dancing or singing in hospitality venues). Some states are considering asking health workers to come to work while known to be infected if they're not displaying symptoms.
Update: Household close contacts of known cases who would normally be required to quarantine (used to be 14 days, now 7) are now allowed back to work if they are in "critical" positions such as hospital workers and not showing symptoms.
To avoid looking up the relevant government websites or news, you could look at the "stringency index" graph for Australia on OurWorldInData: from being one of the highest in Western nations in November, it's now lower than most of them.
comment by npostavs · 2022-01-08T14:42:01.714Z · LW(p) · GW(p)
[Canada's] last day of data is likely a reporting delay there.
I think it's likely more about testing capacity. E.g., Ontario restricted tests to high risk population since Dec 31.